HAL Id: hal-02569242
https://hal-amu.archives-ouvertes.fr/hal-02569242
Submitted on 22 Sep 2020HAL is a multi-disciplinary open access
archive for the deposit and dissemination of sci-entific research documents, whether they are pub-lished or not. The documents may come from teaching and research institutions in France or abroad, or from public or private research centers.
L’archive ouverte pluridisciplinaire HAL, est destinée au dépôt et à la diffusion de documents scientifiques de niveau recherche, publiés ou non, émanant des établissements d’enseignement et de recherche français ou étrangers, des laboratoires publics ou privés.
Microclimate in Mediterranean pine forests: What is the
influence of the shrub layer?
Bernard Prévosto, Manon Helluy, Jordane Gavinet, Catherine Fernandez,
Philippe Balandier
To cite this version:
Bernard Prévosto, Manon Helluy, Jordane Gavinet, Catherine Fernandez, Philippe Balandier. Micro-climate in Mediterranean pine forests: What is the influence of the shrub layer?. Agricultural and Forest Meteorology, Elsevier Masson, 2020, 282-283, pp.107856. �10.1016/j.agrformet.2019.107856�. �hal-02569242�
1 Microclimate in Mediterranean pine forests: What is the influence of the shrub layer? 1
2
Bernard Prévosto a,*, Manon Helluy b, Jordane Gavinet c, Catherine Fernandez d, Philippe 3
Balandier e 4
5
a Irstea, Aix Marseille Univ, UR RECOVER, 3275 route de Cézanne CS 40061, F-13182 Aix-en-Provence cedex 5, France 6
b AgroParisTech, Irstea, Aix Marseille Univ, UR RECOVER, 3275 route de Cézanne CS 40061, F-13182 Aix-en-Provence cedex 5, France 7
c Centre d’Ecologie Fonctionnelle et Evolutive (CEFE), UMR 5175, CNRS, Univ Montpellier, Univ Paul Valéry Montpellier 3, EPHE, IRD, 8
1919 route de Mende, F-34293 Montpellier, Cedex 5, France 9
d IMBE, Aix-Marseille Univ, CNRS, IRD, Avignon Université, UMR 7263, 3 place Victor-Hugo, F-13331 Marseille cedex 3, France 10
e Irstea, UR EFNO, Domaine des Barres, F-45290 Nogent-sur-Vernisson, France 11
12
* Corresponding author 13
14
E-mail adresses : bernard.prevosto@irstea.fr (B. Prévosto), manon. helluy @irstea.fr (M. Helluy), jordane.gavinet@cefe.cnrs.fr (J. Gavinet), 15
catherine.fernandez@imbe.fr (C. Fernandez), philippe.balandier@irstea.fr (P. Balandier). 16
17
Abstract 18
Forest cover creates a specific microclimate by buffering most environmental variables. If the 19
influence of the overstory on microclimatic variables has been well studied, the role of the 20
understory has received less attention. In this study we investigated how the shrub layer 21
modifies solar radiation, air temperature (T), relative air humidity (RH), vapor pressure deficit 22
(VPD) and soil moisture under different thinning treatments in an Aleppo pine forest (Pinus 23
halepensis Mill.). Microclimatic variables were measured along a vegetation cover gradient 24
made up of three pine densities (dense, medium, low) and open conditions, with or without the 25
presence of shrubs. The results were analyzed with a focus on the summer period which 26
represents a major bottleneck for plant development in the Mediterranean area. 27
Average T and VPD values increased with decreasing vegetation cover (+1.38°C and +0.21 28
kPa for the whole year) while RH decreased (-2.34%). Along the same gradient, daily amplitude 29
of T, RH, VPD increased while the buffering capacity decreased. These patterns were more 30
2 pronounced during the summer period compared to the whole year and were primarily driven 31
by overstory transmittance. However, the shrub layer played a significant role in the low pine 32
cover treatment where it was developed and in open conditions. Soil water content in the forest 33
area was higher under low pine cover without shrubs than it was in the other treatments, though 34
differences were less marked during summer drought episodes. In open conditions, soil 35
moisture was always significantly lower beneath the shrub canopy than outside it. Despite a 36
reduction in soil moisture, shrubs may represent safe sites for woody seedling development in 37
sparse pine forests and in treeless areas by buffering the microclimate during the summer 38
period. 39
40
Keywords: Temperature, vapor pressure deficit, light, soil water content, thinning, Aleppo 41 pine. 42 43 Declaration of interest. 44
The authors have no competing interests to declare 45
46
Highlights 47
48
A buffering effect on T, VPD, RH was noted for the overstory and the understory 49
This effect was more pronounced in summer due to a stronger shading effect 50
Shrub influence on T, RH, VPD was higher in low pine cover and in open conditions 51
Soil moisture was reduced in the presence of a developed shrub layer 52
3 1. Introduction
54 55
Mediterranean forests are primarily threatened by climate change and its associated 56
disturbances, in particular more severe and prolonged drought episodes as well as recurrent heat 57
waves (e.g. Peñuelas et al., 2017). These disturbances result in an increase in tree mortality, 58
shifts in species distribution and higher fire risk (Allen et al, 2010; Carnicer et al., 2011; Pausas 59
and Fernández-Muñoz, 2012). In this context, management methods mitigating these risks and 60
improving forest resistance and resilience are urgently needed. The reduction of stand density 61
by thinning is certainly one of the most studied adaptive management practices (Vila-Cabrera 62
et al., 2018). Thinning increases light availability and reduces competition between trees. It also 63
has a large influence on the water budget of the ecosystem (e.g. Aussenac and Granier, 1988). 64
The reduction of tree density decreases rainfall interception, limits stand transpiration and can 65
therefore delay soil water depletion (Cabon et al., 2018) and reduce tree drought stress (Bréda 66
et al., 1995). Recent studies have shown that this alleviation of water stress can improve drought 67
resistance and recovery, but these effects vary greatly between site conditions, species and 68
thinning intensities (Giuggiola et al., 2013, 2016; Sohn et al., 2016). However, the effects of 69
thinning on tree water alimentation may be dampened by several factors. For example, the 70
transpiration of the remaining trees can increase (Bréda et al., 1995) and the development of 71
the understory and ground vegetation, boosted by the light increase, can drain above and below 72
ground resources (Aranda et al., 2012; Simonin et al., 2007), possibly cancelling or even 73
reversing the effects of thinning on stand water consumption (del Campo et al., 2019). 74
Thinning, by reducing the tree cover, leads to the modification of microclimatic conditions 75
(sensu Geiger et al., 2003) in which we include air temperature, air humidity, air water vapor 76
pressure deficit (VPD), light availability and soil moisture. A main effect of tree cover is to 77
moderate most of the meteorological variables and several previous studies have highlighted 78
this buffering ability by comparing the microclimate within forest stands and in nearby open 79
4 areas (e.g. Renaud et al., 2011, von Arx et al., 2012, De Frenne et al., 2019). Below-canopy 80
microclimates are generally characterized by lower annual and seasonal maximum 81
temperatures, with higher minimum temperature and air humidity values (Gaudio et al., 2017; 82
Renaud et al., 2011), although the magnitude of these effects varies with forest structure and 83
site conditions. Buffering of daily microclimate variations has also been reported: air 84
temperature increases less during the day and decreases less during the night, whereas the 85
reverse trend was noted for relative air humidity (Aussenac, 2000; von Arx et al., 2012). Such 86
fine-scale modifications of microclimate by forest cover have important implications for tree 87
seedling and understory species establishment and diversity (e.g. De Frenne et al. 2015, Gavinet 88
et al. 2016). 89
Several studies have explored the relationship between tree cover and microclimatic conditions 90
in relation to overstory composition and structure (e.g. Heithecker and Halpern, 2007; Porté et 91
al., 2004; von Arx et al., 2012). However, few have considered the influence of the understory 92
vegetation on microclimatic conditions (Kovács et al., 2017; Giuggiola et al., 2018). In fact, the 93
understory also influences light interception, water budget and variations in other microclimatic 94
variables (Balandier et al., 2013; Giuggiola et al., 2018; Riegel et al., 1992). Moreover, 95
understory composition and structure are affected by climate change and by the reduction of 96
overstory cover (Bernhardt-Römermann et al., 2015, Coll et al., 2011; De Frenne et al., 2015). 97
Lastly, the understory can be also impacted by certain management practices that involve 98
reducing or removing the understory vegetation for economic purposes, such as biomass 99
harvesting, or for fire risk limitation. 100
In this study, we explored the role of the understory vegetation on several microclimatic 101
variables in a Mediterranean Aleppo pine (Pinus halepensis Mill.) forest and a nearby open 102
area. We first thinned pine stands at different intensities to create a gradient of overstory cover 103
conditions, and then conducted an understory removal experiment. The understory was 104
composed of shrubs, which is very common in Mediterranean systems especially in open forests 105
5 and in open habitats (e.g. garrigues, matorrals). Many of the microclimatic variables fluctuate 106
with time and influence plant processes differently, depending on the season (Ogle et al., 2012) 107
and should therefore be studied at different time-scales. We monitored the main microclimatic 108
variables: soil water content (SWC), air temperature (T), relative humidity (RH), vapor pressure 109
deficit (VPD) and light availability. 110
In Mediterranean areas, summer period represents a major constraint for many processes 111
affecting plant development and is clearly identified as a bottleneck for vegetation dynamics 112
(e.g. Castro et al., 2005; Gómez-Aparicio et al. 2004, 2005). Furthermore, climate models for 113
the next few decades forecast even drier and warmer climate during summer, that puts most 114
ecosystem functions at risk (Cramer et al., 2018). We therefore specifically studied the 115
fluctuations of microclimatic conditions during summer and compared them with those 116
recorded during the whole year. More specifically, our questions were the following: 117
i) To what extent are variations in microclimatic variables affected by overstory and 118
understory cover? 119
ii) How do interactions between the overstory and the understory influence 120
microclimate? 121
iii) Are there any seasonal patterns in the effect sizes of below-canopy microclimate? 122
In particular, we have investigated how the microclimate was modified during the 123
summer period compared to the whole year. 124
125
2. Material and methods 126
127
2.1 Study site and experimental design 128
129
The study site is located in Southeastern France (43°4’N; 5°0’E) at about 30 km Northwest of 130
the city of Marseille, on a flat area at an altitude of 130 m. Mean annual temperature is 14.5°C 131
6 and mean annual rainfall is 550 mm based on historical records (1961-2010) of the nearby 132
weather station of Istres (Météo France). However, as it is often observed in the Mediterranean 133
climate, rainfall fluctuations are pronounced: 2014 and 2015 were ‘wet’ years (705 and 619 134
mm) whereas 2016 and 2017 were ‘dry years’ (382 and 318 mm). Differences in total rainfall 135
during the summer period were even more pronounced between 2014-2015 (138 mm and 157 136
mm) and 2016-2017 (17 mm and 35 mm). The soils developed on a calcarenite bedrock 137
composed of sandy limestone material and fossil shells. Alteration of this bedrock has led to 138
calcareous soils (mean depth 60 cm) with mostly sandy textures (52% ± 0.7), followed by silt 139
(34% ± 0.5) and clay (14% ± 0.6). 140
The site was covered by a 60-year-old Pinus halepensis forest that had naturally established on 141
former agricultural fields. The tree layer was composed of Aleppo pine solely, with the 142
evergreen holm oak (Quercus ilex L.) present in some places in the sub-canopy layer, the shrub 143
layer was dominated by Quercus coccifera L., Quercus ilex, Rosmarinus officinalis L., 144
Phyllirea angustifolia L. and the herb layer was scant. 145
In 2007, we established twelve 25 m × 25 m plots (Fig. 1) in the pine forest and thinned eight 146
randomly selected plots according to two intensities (4 plots per thinning intensity): heavy 147
thinning removing 2/3 of the basal area and moderate thinning removing 1/3 of the basal area. 148
Four plots were not thinned and left as control. This led to three levels of ‘pine cover 149
treatments’: low cover (L) after heavy thinning, medium cover (M) after medium thinning and 150
dense cover (D) in the unthinned control. In February 2016, half of the surface of the shrub 151
layer that had developed was removed from each plot of the L and M treatments, while the 152
other half was left untouched. Shrub removal was not performed in plots of the D treatment as 153
the shrub cover was already very low. Shrub regrowth was then suppressed each year during 154
the winter period in the shrub removal treatments. Stand characteristics of the overstory and the 155
understory are summarized in Table 1 and pictures of the treatments are provided in the 156
supplementary material. 157
7 158
159 160
161
Figure 1. Location of the 12 plots (squares) in the forest area and the open treeless area (in the 162
insert). Treatments are as follows: low pine cover (L, after heavy thinning, white squares), 163
medium pine cover (M, after medium thinning, grey squares) and dense cover (D, no thinning 164
= control, black squares). 165
8 167
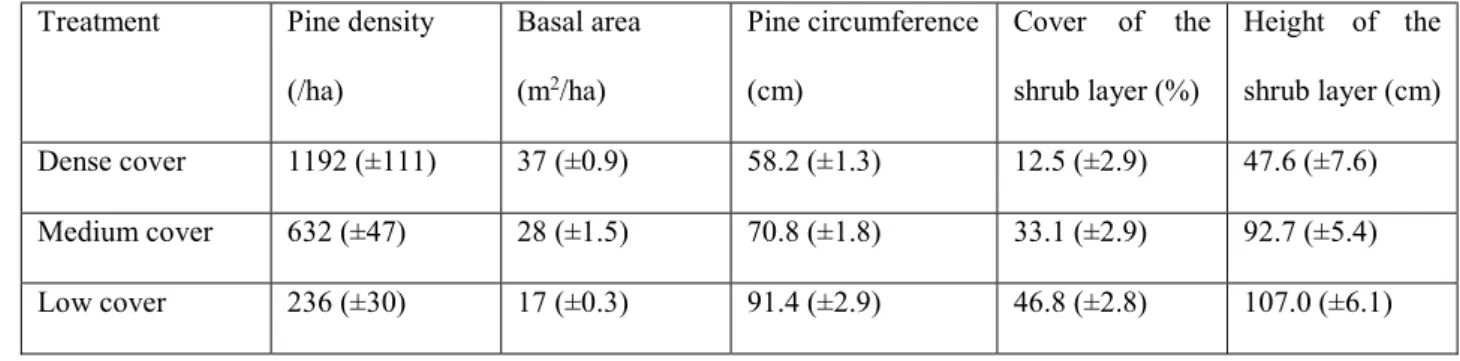
Table 1. Mean characteristics (mean ± se) of the plots in 2016 168
Treatment Pine density (/ha) Basal area (m2/ha) Pine circumference (cm) Cover of the shrub layer (%) Height of the shrub layer (cm) Dense cover 1192 (±111) 37 (±0.9) 58.2 (±1.3) 12.5 (±2.9) 47.6 (±7.6) Medium cover 632 (±47) 28 (±1.5) 70.8 (±1.8) 33.1 (±2.9) 92.7 (±5.4) Low cover 236 (±30) 17 (±0.3) 91.4 (±2.9) 46.8 (±2.8) 107.0 (±6.1) 169
In addition to the forest plots, we also selected a nearby open area (O, see Fig. 1) that was 170
covered by a discontinuous shrub layer with the same species as in the forest area. 171
Hereafter we refer to the seven different treatments resulting from the canopy cover and the 172
shrub treatments as follows: dense pine cover without shrubs (D), medium pine cover with 173
(M+S) and without (M) shrubs, low pine cover with (L+S) and without (L) shrubs, open area 174
with shrubs (O+S) and without shrubs (O). 175
176
2.2 Measurements of the microclimatic variables 177
2.2.1 Light transmittance of the pine cover 178
Light availability in the photosynthetically active radiation (PAR) domain was measured in the 179
forest plots using 65 measurement points distributed along transects in the different plots and 180
treatments, below pine canopy (D, M, L) and below pine + shrub canopy (M+S, L+S). At each 181
measurement point, light availability (µmol m-2 s-1) was recorded every minute for 24 hours by 182
a solarimeter tube of 30 cm length (DPAR/LEC1C, Solems S.A., France) installed at 40 cm 183
height. Data were recorded during two successive clear days of April 2017. Light was also 184
measured simultaneously in the open area as a proxy of above tree canopy light availability 185
(full light conditions) using two solarimeters. Light transmittance was computed as the ratio of 186
below canopy light availability at each forest point to light availability in the open. 187
2.2.2 Light transmittance of the shrub cover 188
9 To accurately investigate the interception of light by the shrub layer in the forest area, we 189
measured the light under shrubs using two different methods. Light availability above and 190
below the shrub canopy was measured at 314 points distributed in the different plots with shrub 191
manipulation (M+S, L+S, O+S) with a PAR ceptometer (AccuPAR LP 80, METER Group, Inc. 192
USA). Because shrub transmittance may strongly vary within the day, we additionally 193
measured shrub transmittance using continuous measurements over 24 hours on 17 additional 194
points, using light sensors (SKP 215, Skye Instrument, UK, Supp. Fig. S1C) installed above 195
and below the shrub canopy. At each measurement point, shrub cover was visually estimated 196
in 5% classes using a 1 m2 square grid. Light transmittance (below/above) of the shrub layer 197
was established by computing the mean values for each 5% shrub cover class. 198
Finally, in the open area, light availability below shrub canopy was measured using a PAR 199
ceptometer during a clear day in July. A total of 24 shrubs of the same species as those recorded 200
in the forest area were selected and light was measured above and below the canopy at different 201
time intervals during the day. The light transmittance was then computed for each shrub. 202
2.2.3 Air temperature and relative air humidity 203
We used 26 loggers (DS1923, iButton®, Maxim int., USA) in the forest plots to measure air 204
temperature (T, ± 0.06°C) and relative air humidity (RH, ± 0.04%), distributed among the 205
different treatments and 6 additional loggers distributed in the O and O+S treatments. The 206
loggers were placed in a small meteorological shelter 30 cm above the ground, below the shrub 207
canopy (M+S, L+S, O+S) and outside shrub influence (D, M, L, O). Data were collected from 208
June 2016 to November 2018 at a one-hour time interval. 209
2.2.4 Soil water content 210
Soil volumetric water content (%, SWC) was monitored from June 2016 to November 2018 211
with a total of 42 soil moisture probes measuring the dielectric constant of the soil based on 212
capacitance technology (EC-5, Decagon Device, UK) and distributed among the different 213
treatments of the forest area. Only 8 of the 12 plots presenting the most similar soil conditions 214
10 were sampled (2 plots in the control treatment D, and 3 plots in each of the two thinning 215
treatments, L and M). Probes were initially calibrated in the laboratory before being installed 216
at 30 cm depth in the field. Data were collected every 4 hours with CR 800 data loggers 217
(Campbell Scientific Ltd, France). For the open area, soil moisture was measured in 2014 and 218
2015 using 6 EC-5 probes installed at 30 cm depth below the shrub canopy and 6 probes outside 219
of the shrub canopy. 220
221
2.3 Data analysis 222
223
By analogy with the Beer-Lambert’s law, light transmittance as a function of shrub cover was 224
described by fitting an exponential negative regression model as follows : T = e-k × Shrub cover, 225
where T, the light transmittance (%) and k, the extinction coefficient, which depends on the 226
shrub cover properties (Sonohat et al., 2014). 227
T, RH, SWC data series were quality-checked before analysis by checking maximum and 228
minimum range limits, and variability over time, in order to detect any unusual behavior of the 229
probes and data outliers which were discarded from later analyses. The T and RH data were 230
used to produce the hourly VPD using the following formula: 231
VPD (Pa) = (1-RH/100) ×610.7×10 7.5T/(237.3+T) where T, the temperature in °C. 232
The hourly data were used to compute daily maximum and minimum values for the summer 233
period (from the summer of 2016, 2017 and 2018, respectively) and for the whole observational 234
period (from October 2016 to October 2018) for each treatment. SWC mean daily values were 235
also calculated for each treatment. 236
The buffering capacity was defined as the difference between the open area and the below 237
canopy in daily maximum temperature (ΔTmax), relative air humidity (ΔRHmax) and vapor 238
pressure deficit (ΔVPDmax). 239
11 Treatment effects on the different environmental variables were tested by one-way ANOVA 240
followed by post-hoc Tukey’s test. We used logarithm or power transformation to satisfy the 241
assumptions of normality (Kolmogorov-Smirnov test) and homogeneity of variance (Levene’s 242
test). When these conditions were not met, we performed non-parametric Kruskal-Wallis test 243
that was followed by multiple comparison test according to Siegel and Castellan (1988). In both 244
cases, statistical differences were assumed at P<0.05. All statistical analyses were performed 245
using R (R core Team, 2017), for multiple comparisons related to the Kruskal-Wallis test, the 246
'pgirmess' package was used. 247
248 249
12 3. Results 250 251 3.1 Light transmittance 252 253
There was a gradient of increasing light availability in the pine plots from dense cover to light 254
cover without shrub (Fig. 2A). However, due to the high variability of light transmittance below 255
forest vegetation cover, we did not detect significant differences among the treatments D, M, 256
M+S and L+S, although values ranged from 0.08 for D up to 0.15 for L+S. In contrast, there 257
was a clear difference between these later treatments and the L and O+S treatments, both of 258
which showed higher light transmittance values (0.27 and 0.28 respectively). 259
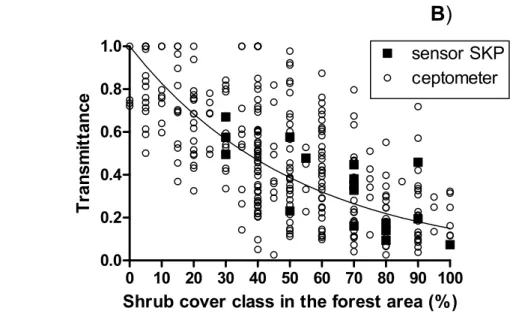
In the forest area, despite high variability, we found a significant negative exponential 260
relationship between light transmittance and shrub cover with an extinction coefficient k of 261 0.019 (Fig. 2B). 262 263 264 265 266 267 268 269 270 271 272 273 274 275
13 276 277 278 279 280 281 282 283 284 285 286 287
Figure 2. A) Light transmittance (mean ±SE) according to the treatments, computed as the ratio 288
of light availability below canopy compared to open conditions (O). D=dense cover, 289
M=medium cover, L=low cover, O=open, S=presence of the shrub layer. Letters indicate 290
statistically significant differences according to Tukey’s post-hoc test (F= 30.2, P<0.001). B) 291
Light transmittance according to shrub cover class in the forest area. The corresponding 292
regression curve is shown (y = exp(-0.019× cover class), R2=0.35, P<0.001). The black squares 293
indicate the daily measurements based on SKP sensors, whereas the white circles indicate the 294
instantaneous ceptometer measurements. 295
296
3.2 Air temperature, relative humidity and VPD 297
298
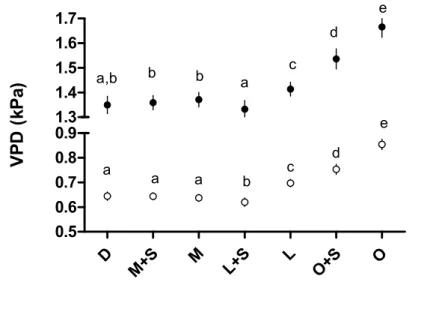
Mean daily values of T and VPD followed similar trends among the different treatments (Fig. 299
3, Table S1): although the lowest values were recorded in the L+S treatment, they remained 300
comparable among the treatments D, M, M+S and L+S. In contrast, a significant increase was 301 0 10 20 30 40 50 60 70 80 90 100 0.0 0.2 0.4 0.6 0.8 1.0 sensor SKP
B)
ceptometerShrub cover class in the forest area (%)
T ra n sm it ta n ce
14 noted for the low cover treatment without shrub layer (L), for both the summer season and the 302
whole year. The influence of the shrub layer on the forest area was only noticeable in the L 303
treatment. The increase of T and VPD was marked in the O+S and O treatments, particularly 304
for the summer season. In contrast to these two factors, RH exhibited a regular decrease from 305
the L+S treatment to the O treatment. However, this decrease was less pronounced in the 306
summer season than during the year. Overall, L+S had the highest mean RH. 307 308 309 D M+S M L+S L O+S O 15 16 17 18 24 25 26 a,b b b a c d e a b c c d d e T ( °C ) D M+S M L+S L O+S O 58 60 62 64 66 72 74 76 78 a b a c a a d a a e d b c f R H ( % )
15 310
311
Figure 3. Mean temperature (T), relative humidity (RH) and vapor pressure deficit (VPD) 312
hourly values (mean ± 5SE) by treatments. Letters indicate statistically significant differences 313
for the summer period (black points) and the whole year (white points). 314
315
The daily range for the three variables followed the same trend (Fig. 4, Table S1): they increased 316
along the decreasing vegetation cover gradient from dense pine cover (D) to open conditions 317
(O) and always showed higher values in summer than for the whole year. The influence of the 318
shrub layer was not significant in the medium cover treatment but was clearly marked for the 319
light cover and open treatments. Similar results were found for the maximal daily temperatures, 320
which ranged from 31.10°C in D to 34.96°C in O when averaged over the summer season and 321
from 20.64°C to 25.02°C for the whole year. Similarly, maximum daily VPD values were the 322
lowest in D (summer: 2.89 kPa, whole year: 1.43 kPa) and the highest in O (summer: 3.95 kPa, 323
whole year: 2.22 kPa). 324 D M+S M L+S L O+S O 0.5 0.6 0.7 0.8 0.9 1.3 1.4 1.5 1.6 1.7 a,b b b a c d e a c a a b d e V P D ( kP a)
16 325 326 327 328 D M+S M L+S L O+S O 8 10 12 14 16 18 a b,c c c d e f a b b b c d e T m ax -T m in ( °C ) D M+S M L+S L O+S O 30 35 40 45 50 55 60 a a,b b a,b c d e a b b b c d e R H m ax -R H m in ( % ) D M+S M L+S L O+S O 1.0 1.5 2.0 2.5 3.0 3.5 4.0 a b b b c d e a b b b c d e V P D m ax -V P D m in ( kP a)
17 Figure 4. Temperature (T), relative humidity (RH) and vapour pressure deficit (VPD) mean 329
daily range values (mean ± 5SE). Letters indicate statistically significant differences for the 330
summer period (black points) and the whole year (white points) 331
332
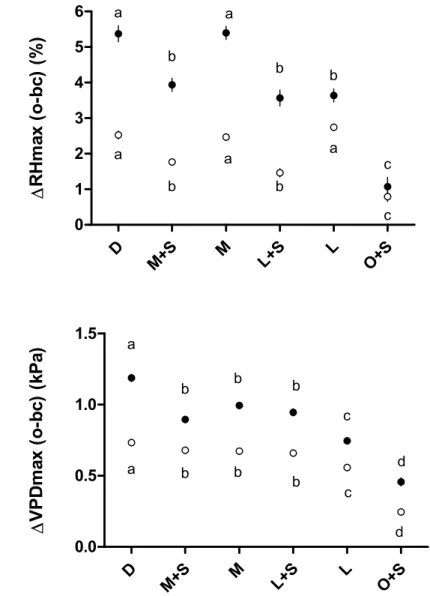
The buffering capacity, represented as the difference between open area and below canopy in 333
daily maximum temperature (ΔTmax), relative air humidity (ΔRHmax) and vapor pressure 334
deficit (ΔVPDmax), globally decreased along the vegetation gradient (from D to O) as shown 335
in Fig. 5 (see also Table S1). It must be noted that all values were positive even for RHmax due 336
to more frequent water condensation in the open favored by stronger daily temperature 337
differences. The buffering capacity was higher in summer compared to the whole year for RH 338
and VPD but not for T in the intermediate cover treatments. The buffering capacity was 339
consistently the highest in the dense cover treatment (respective values in summer for T, RH 340
and VPD: 3.96°C, 5.37%, 1.19 kPa) and the lowest in the O+S treatment (1.53°C, 1.07%, 0.46 341
kPa). During the summer season, the effect of the shrub layer on the forest area was pronounced 342
in the light cover treatment for T and VPD but not for RH. In contrast, its effect was not 343
significant in the medium cover treatment although ΔRHmax was higher in M than in M+S. 344 345 D M+S M L+S L O+S 0 1 2 3 4 5 a b b b c d a a b b b c T m ax ( o -b c) ( kP a)
18 346
347
Figure 5. Buffering capacity (mean ± SE) calculated as the difference in maximum daily 348
temperature (ΔTmax), relative humidity (ΔRHmax) and vapor pressure deficit (ΔVPDmax) 349
between treatment O (o, open area) and below-canopy treatments (bc). Letters indicate 350
statistically significant differences for the summer period (black points) and the whole year 351
(white points). 352
353
3.3 Soil water content 354
355
Variations in soil volumetric water content in both forest and open areas were characterized by 356
several peaks corresponding to rainfall events and a marked decrease during the summer season 357
(Fig. 6A and 6B). In the forest area (Fig. 6A), the L treatment consistently exhibited the highest 358 D M+S M L+S L O+S 0 1 2 3 4 5 6 a b b a b c a b b a a c R H m ax ( o -b c) ( % ) D M+S M L+S L O+S 0.0 0.5 1.0 1.5 a b b b c d a b b b c d V P D m ax ( o -b c) ( kP a)
19 soil moisture throughout the year. However, the differences among the treatments were less 359
pronounced in summer, particularly during the dry year 2017 (values ranging from 13.8% to 360
16.2%), compared to the other seasons (18.9% to 22.6%, Fig. 6C). The shrub cover had a 361
negative effect on soil moisture in the L treatment, both during the summer and the whole year. 362
Similarly, in the open area, soil moisture values were always higher outside the shrub canopy 363
than beneath the shrub canopy for the two years of measurement (Fig. 6B). As summers were 364
wetter in 2014 and 2015 (years of SWC measurement in the open area), variations in soil 365
moisture values were similar between the summer period (18.7% to 21.2%) and the other 366 seasons (22.3% to 24.8%) (Fig. 6D). 367 368 369 100 150 200 250 300 350 400 450 500 550 600 650 700 750 15 20 25 30 35 D M+S M L+S L summer 2016 summer 2017
Days
A)
S W C ( % v o l)20 370 371 372 373 100 150 200 250 300 350 400 450 500 550 600 650 700 750 15 20 25 30 35 O+S O summer 2014 summer 2015
Days
B)
S W C ( % v o l) D M+S M L+S L DM+S M L+S L 14 16 18 20 22 24 26 a a a a b cC)
a a b c Summer (2016,2017) Other seasons S W C ( % v o l) O+S O O+S O 14 16 18 20 22 24 26 a a b bD)
Other seasons Summer (2014,2015) S W C ( % v o l)21 374
Figure 6. Variations in soil volumetric water content (SWC, at 30 cm depth) according to the 375
treatments A) in the forest area (18 April 2016 to 18 April 2018), B) in the open area (18 April 376
2014 to 18 April 2016). Mean SWC according to the treatments during summer and other 377
seasons C) in the forest area and D) in the open area. Letters indicate significant differences 378
among the treatments for a given period (summer/other seasons). 379
380
4. Discussion 381
382
4.1 Variation in microclimatic variables 383
384
Values of pine transmittance in the PAR domain are in the same range as those recorded in 385
previous studies on Aleppo pine forests. Cooper et al. (2014) recorded in Israel a transmittance 386
of 14-23% for a basal area between 14-16 m2 ha-1, while in Spain, it ranged from 14.7% in 387
dense closed pine stands (32 m2 ha-1) to 36% in more open stands (12.4 m2 ha-1) (Gavinet et al., 388
2015). The shrub transmittance was strongly correlated with its cover percentage following the 389
formalism of the Beer-Lambert’s law (Fig. 2B). The extinction coefficient (k) of 0.019 found 390
in this study indicates moderate light interception compared to other species. For instance, in 391
temperate forests, the transmittance of Calluna vulgaris (L.) Hull was found to be very high (k 392
between 0.004 and 0.012) but it was considerably reduced by Rubus fruticosus L. (k=0.074) 393
(Gaudio et al., 2011; Balandier et al., 2013). The influence of the understory vegetation on 394
transmittance was only clearly marked in the light pine cover treatment and in the open 395
treatment, whereas in the medium pine cover treatment the moderately developed understory 396
only had a weak effect on light interception. 397
The increase in transmittance with decreasing pine cover mainly explains the gradient of 398
increased T and VPD and decreased RH from closed canopies (D) to open conditions (O). The 399
22 effect of the shrub layer on the microclimate was also consistently significant and more 400
pronounced in the light pine cover and open treatments. This is probably linked to a shading 401
effect and the reduction of air movement, leading to higher humidity and a reduced temperature 402
gradient (Kovács et al., 2017; Unterseher and Tal, 2006). In mixed oak stands, Clinton (2003) 403
also found that the sclerophyllous evergreen shrub Rhododendron maximum L. significantly 404
lowered air temperature; while Williams and Ward (2010) found that relative air humidity was 405
positively related to the development of a thorny invasive shrub (Berberis thunbergiide DC.) 406
in eastern USA. These gradients are more pronounced during the summer season than the whole 407
year due to stronger solar radiation, which varies on average from 269 W/m2 in summer to 168 408
W/m2 for the whole year in our study area. 409
410
4.2 The effect of the vegetation cover on daily range and the buffering capacity 411
412
The daily ranges for T, RH and VPD (Fig. 4) increased along a decreasing vegetation gradient 413
(from D to O). Shading provided by the overstory and understory vegetation cover, prevents 414
the solar shortwave radiation from reaching the forest floor and warms up the near-surface air, 415
resulting in lower Tmax and VPDmax values, and higher RHmin values. Furthermore, 416
fluctuations are dampened in the presence of vegetation cover due to the reduction of the 417
longwave radiative losses during the night (Rambo and North, 2009). Amplitudes are also 418
higher during the summer season. This is mainly driven by the increase in solar radiation during 419
the summer period which results in a stronger buffering effect of the vegetation layers, as has 420
been reported in previous studies (Renaud and Rebetez, 2009; Renaud et al., 2011; von Arx et 421
al., 2012). 422
The buffering capacity (Fig. 5) was more significant under dense cover than under sparse cover 423
(Renaud and Rebetez, 2009; De Frenne et al., 2013; von Arx et al., 2013). This buffering 424
capacity was also more intense during the dry summer period for VPDmax compared to the 425
23 whole year. In contrast, in sparse evergreen temperate forests in Switzerland, von Arx et al. 426
(2013) noted an absent or very low buffering capacity during the summer dry season on Tmax 427
and VPDmax. They attributed this finding to more intense solar radiation during this period and 428
less cooling by soil evaporation. The ΔTmax, contrary to ΔVPDmax and ΔRHmax, showed 429
similar values in summer and in the whole year, a result also reported in a previous study (von 430
Arx et al., 2012). Certain factors could have played a role, such as lower soil moisture in 431
summer resulting in an attenuation of the evaporative cooling effect (von Arx et al., 2012). 432
The effect of the shrub layer on buffering capacity was particularly marked where there was a 433
well-developed shrub layer i.e. in the open and light pine cover treatments. This strong 434
buffering capacity is mainly linked with the light interception of these two treatments. In fact, 435
light dropped down from 100% to 28% under the shrub canopy in open conditions and from 436
27% under light pine cover without shrub cover to 15% in the presence of shrubs. Taken 437
together, we can conclude that the daily range of microclimatic variables and buffering capacity 438
were primarily driven by overstory cover, as was also reported by Ehbrecht et al. (2019). 439
However, under low overstory cover (L+S), microclimatic variables and buffering were mostly 440
driven by the shrub layer where it was more developed. It must be noted that the buffering 441
capacity of tree cover has not always been observed in the case of pine species. For instance, 442
during the very hot summer of 2003, Renaud and Rebetez (2009) observed in Switzerland that 443
the maximum daily air temperature was higher below the pine canopy, composed of Scots pine 444
and Mugo pine, than in open conditions. They explained this finding by the higher transparency 445
in the crowns at their site that was caused by high pine mortality rates. The role of thermal 446
inertia of the air mass should be also considered in the process of buffering. Indeed, the air 447
temperature in forest stands has been reported to decline more slowly in the afternoon on 448
summer days than would be otherwise expected based on the decline in solar radiation (Gaudio 449
et al., 2017). In contrast, our Aleppo pine stands were healthy, with dense crowns that 450
intercepted about 70% of incoming light. 451
24 452
4.3 Variations of soil moisture 453
Reducing pine densities (L) increased soil water availability in summer and for the whole year, 454
as reported in other studies (e.g. Bréda et al., 1995; Aussenac, 2000; Giuggiola et al., 2016). 455
In this study, we observed a clear effect of the shrub layer in the light pine cover and open 456
conditions. In both cases, reduced soil moisture beneath shrub canopy was noted. For the forest 457
area, this finding is in line with previous studies. In an understory removal experiment in a 458
Scots pine forest at a dry site in Switzerland, Giuggiola et al. (2018) observed an increase in 459
soil water content at 5 and 30 cm depth. A similar result was found by Zahner (1958) in a mixed 460
Pinus taeda - Pinus echinata stand in a dry site in USA. However, such an effect is debated in 461
Mediterranean conditions.Under heavy radiation, soil evaporation represents a significant part 462
of the water losses of the ecosystem. In a semi-arid, low density (300 stems ha-1, LAI=1.5) 463
Aleppo pine forest in Israel, Raz-Yaseef et al. (2010) found that soil evaporation could represent 464
36% of the annual precipitation. In a Mediterranean cork oak (Q. suber) stand invaded by Cistus 465
ladanifer, Caldeira et al. (2015) found that shrub presence increased soil moisture in the upper 466
40 cm but decreased it below this point, resulting in an overall reduction in water availability 467
for the oak trees. 468
In fact, the influence of the shrub layer on the soil moisture depends on several factors. On the 469
one hand, water loss by soil evaporation is reduced due to the shading provided by the shrubby 470
vegetation. In some cases, higher water availability below the shrub layer can also be linked to 471
hydraulic lift (Prietoet al., 2011) or modified soil properties such as porosity, organic matter or 472
texture (Pugnaire et al., 2004). On the other hand, the shrub layer has a detrimental effect on 473
the water budget by transpiration (Simonin et al., 2007; Rascher et al. 2011; Caldeira et al. 474
2015) and by intercepting a substantial amount of the rainfall. For instance, Llorens and 475
Domingo (2007) in a literature review, reported a mean relative throughfall of about 49% for 476
shrubs and bushes with large variation depending on species and environmental conditions. In 477
25 our study, the balance between these different processes results in a negative effect on soil 478
moisture which is particularly prominent in open conditions but is not noticeable under 479
moderate and dense pine covers. However, some studies have reported an absence of soil 480
moisture variation between shrubs and nearby open areas (e.g. Gómez-Aparicio et al., 2004) 481
while others have noted higher soil water content beneath the shrub canopy (e.g. Allegrezza et 482
al., 2016). The impact of the shrub canopy on soil moisture may also differ depending on total 483
soil depth (Caldeira et al., 2015) and therefore the water reservoir size. This suggests that the 484
effect of shrubs on the water budget depends on multiple factors such as the species considered, 485
and the climatic and edaphic conditions (Butterfield et al.,2016). It must also be emphasized 486
that during the drought episode of 2017 (46 mm for the period June-October), the soil water 487
content was very low and varied little among treatments in the forest area, suggesting that the 488
influence of the shrubby understory cover is downplayed during such extreme episodes. 489
490
5. Conclusions 491
Very few studies have manipulated the vegetation layer to investigate the role of the understory 492
in regulating forest microclimate. Our experiment reveals the buffering effect of both the 493
overstory and understory on temperature, air humidity and VPD in Mediterranean pine 494
woodlands. This effect is more clearly expressed during the summer period in link with the 495
dominant role of light interception (reduction of the radiative forcing). The influence exerted 496
by the pine overstory on microclimatic variables and their fluctuations is of primary 497
importance. It is only when the tree cover is strongly reduced that the role of the shrub layer is 498
more pronounced and could substitute the overstory which is the primary regulator of 499
microclimatic conditions. These results have management implications for the development of 500
adult trees and woody seedlings. In highly thinned stands (below 20 m2 ha-1), a well-developed 501
shrub layer can lead to a reduction in soil moisture during the growing season, increasing water 502
stress and thus limiting tree growth. As a consequence, a reduction of the shrub layer can be an 503
26 option to limit these negative effects on growth. In contrast, the positive effect of shrubs on 504
seedling development has been emphasized by many previous studies, particularly in opened 505
Mediterranean environments (e.g. Gómez-Aparicio et al., 2004, 2005; Heydari et al., 2017). 506
Our results have shown that this positive effect is due to the amelioration of the aerial 507
microclimate, in particular a strong reduction of T, VPD and radiation, although the soil 508
moisture is reduced under the shrub cover. However, this effect also depends on seedling stress-509
tolerance and ecophysiological strategy (Gavinet et al., 2016) such as sensitivity to air (VPD) 510
and soil droughts (Saccone et al., 2009). 511
512
Acknowledgements 513
514
This study was supported by the French Ministry of Ecology (MTES/DEB). 515
Acknowledgements are also expressed to the French Ministry of Agriculture which funded 516
the research activities. 517
The authors are especially grateful to M. Audouard, J.M. Lopez for measurements and field 518
work and, to Kurt Villsen for proofreading. 519
27 References
521
Allegrezza, M., Corti, G., Cocco, S., Pesaresi, S., Chirico, G.B., Saracino, A., Bonanomi, G., 522
2016. Microclimate buffering and fertility island formation during Juniperus-communis 523
ontogenesis modulate competition-facilitation balance. J. Veg. Sci. 27, 616-627. 524
Allen, C.D., Macalady, A.K., Chenchouni, H., Bachelet, D., McDowell, N., Vennetier, M., 525
Kitzberger, T., Rigling, A., Breshears, D.D., Hogg, E.H., 2010. A global overview of drought 526
and heat-induced tree mortality reveals emerging climate change risks for forests. For. Ecol. 527
Manage. 259, 660–684. 528
Aranda, I., Forner, A., Cuesta, B., Valladares, F., 2012. Species-specific water use by forest 529
tree species: from the tree to the stand. Agr. Water Manage. 114, 67-77. 530
Aussenac, G., 2000. Interactions between forest stands and microclimate. Ecophysiological 531
aspects and consequences for silviculture. Ann. For. Sci. 57, 287-301. 532
Aussenac, G., Granier, A., 1988. Effects of thinning on water stress and growth in Douglas-533
fir. Can. J. For. Res. 18, 100-105. 534
Balandier, P., Marquier, A., Casella, E., Kiewitt, A., Coll, L., Wehrlen, L., Harmer, R., 2013. 535
Architecture, cover and light interception by bramble (Rubus fruticosus): a common 536
understorey weed in temperate forests. Forestry 86, 39-46. 537
Bernhardt-Römermann, M., Baeten, L., Craven, D., De Frenne, P., Hedl, R., Lenoir, J., Bert, 538
D., Brunet, J., Chudomelova, M., Decocq, G., et al., 2015. Drivers of temporal changes in 539
temperate forest plant diversity vary across spatial scales. Global Change Biol., 21, 3726-540
3737. 541
Bréda, N., Granier, A., Aussenac, G., 1995. Effects of thinning on soil and tree water 542
relations. Transpiration and growth in an oak forest (Quercus petrae (Matt.)). Tree Physiol., 543
15, 295-306. 544
28 Butterfield, B.J., Bradford, J.B., Armas, C., Prieto, I., Pugnaire, F.I., 2016. Does the stress-545
gradient hypothesis hold water? Disentangling spatial and temporal variation in plant effects 546
on soil moisture in dryland systems. Funct. Ecol., 30, 10-19. 547
Cabon, A., Mouillot, F., Lempereur, M., Ourcival, J.M., Simioni, G., Limousin, J.M., 2018. 548
Thinning increases tree growth by delaying drought-induced growth cessation in a 549
Mediterranean evergreen oak coppice. For. Ecol. Manage., 409, 333-342. 550
Caldeira, M.C., Lecomte, X., David, T.S., Pinto, J.G., Bugalho, M.N., Werner, C., 2015. 551
Synergy of extreme drought and shrub invasion reduce ecosystem functioning and resilience 552
in water-limited climates. Scientific Reports 5, 15110. 553
Carnicer, J., Coll, M., Ninyerola, M., Pons, X., Sánchez, G., Peñuelas, J., 2011. Widespread 554
crown condition decline, food web disruption, and amplified tree mortality with increased 555
climate change-type drought. Proc. Natl. Acad. Sci. USA, 108, 1474-1478. 556
Castro, J., Zamora, R., Hodar, J.A., Gomez, J.M., 2005. Alleviation of summer drought boosts 557
establishment success of Pinus sylvestris in a Mediterranean mountain: an experimental 558
approach. Plant Ecol. 181, 191-202. 559
Clinton, B.D., 2003. Light, temperature, and soil moisture responses to elevation evergreen 560
understory, and small, canopy gaps in the southern Appalachians. For. Ecol. Manage. 186, 561
243-255. 562
Coll, L., Gonzalez-Olabarria, J.R., Mola-Yudego, B., Pukkala, T., Messier, C., 2011. 563
Predicting understory maximum shrubs cover using altitude and overstory basal area in 564
different Mediterranean forests. Eur. J. For. Res. 130, 55-65. 565
Cooper, A., Shapira, O., Zaidan, S., Moshe, Y., Zangy, E., Osem, Y., 2014. Oak restoration in 566
water-limited pine plantations: interactive effects of overstory light interception and water 567
availability on understory oak performance. Eur. J. For Res., 133, 661-670. 568
29 Cramer, W., Guiot, J., Fader, M., Garrabou, J., Gattuso, J.P., Iglesias, A., Lange, M.A. et al., 569
2018. Climate change and interconnected risks to sustainable development in the 570
Mediterranean. Nat. Clim. Change, 8, 972-980. 571
De Frenne, P., Rodríguez-Sánchez, F., Coomes, D.A., Baeten, L., Verstraeten, G., Vellend, 572
M., Bernhardt-Römermann, M., Brown, C.D….Verheyen, K., 2013. Microclimates moderates 573
plant responses to macroclimate warming. PNAS, 110, 18561-18565. 574
De Frenne, P., Rodríguez-Sánchez, F., De Schrijver, A., Coomes, D.A., Hermy, M., 575
Vangansbeke, P., Verheyen, K., 2015. Light accelerates plant responses to warming. Nature 576
Plants 1, 15110. 577
De Frenne, P., Zellwegger, F., Rodríguez-Sánchez, F., Scheffers, B.R., Hylander, K., Luoto, 578
M., Vellend, M., Verheyen, K., Lenoir, J., 2019. Global buffering of temperatures under 579
forest canopies. Nat. Ecol. Evol. 3, 744-749. 580
Del Campo, A.D., Gonzalez-Sanchis, M., Gracia-Prats, A., Ceacero, C.J., Lull, C., 2019. The 581
impact of adaptive forest management on water fluxes and growth dynamics in a water-582
limited low-biomass oak coppice. Agr. For. Meteorol. 264, 266-282. 583
Ehbrecht, M., Schall, P., Ammer, C., Fischer, M., Seidel, D., 2019. Effects of structural 584
heterogeneity on the diurnal temperature range in temperate forest ecosystems. Forest 585
Ecology and Management 432, 860–867. 586
Gaudio, N., Balandier, P., Dumas, Y., Ginisty, C., 2011 Growth and morphology of three 587
forest understorey species (Calluna vulgaris, Molinia caerulea and Pteridium aquilinum) 588
according to light availability. For. Ecol. Manage. 261, 489–498. 589
Gaudio, N., Gendre, X., Saudreau, M., Seigner, V., Balandier, P., 2017. Impact of tree canopy 590
on thermal and radiative microclimates in a mixed temperate forest: A new statistical method 591
to analyse hourly temporal dynamics. Agric. For. Meteorol. 237-238, 71-79. 592
30 Gavinet, J., Vilagrosa, A., Chirino, E., Granados, M.E., Vallejo, R., Prévosto B., 2015.
593
Hardwood seedling establishment below Aleppo pine depends on thinning intensity in two 594
Mediterranean sites. Ann. For. Sci. 72, 999-1008. 595
Gavinet, J., Prévosto, B., Fernandez, C., 2016. Do shrubs facilitate oak seedling establishment 596
in Mediterranean pine forest understory? For. Ecol. Manage. 381, 289-296. 597
Geiger, R., Aron, R.H., Todhunter, P., 2003. The Climate Near the Ground. Rowman & 598
Littlefield, Lanham, MD, USA. 599
Giuggiola, A., Bugmann, H., Zingg, A., Dobbertin, M., Rigling, A., 2013. Reduction of stand 600
density increases drought resistance in xeric Scots pine forests. For. Ecol. Manage. 310, 827-601
835. 602
Giuggiola, A., Ogee, J., Rigling, A., Gessler, A., Bugmann, H., Treydte, K., 2016. 603
Improvement of water and light availability after thinning at a xeric site: which matters more? 604
A dual isotope approach. New Phytol. 210, 108-121. 605
Giuggiola, A., Zweifel, R., Feichtinger, LM., Vollenweider, P., Bugmann, H., Haeni, M., 606
Rigling, A., 2018. Competition for water in a xeric forest ecosystem – Effects of understory 607
removal on soil micro-climate, growth and physiology of dominant Scots pine trees. For. 608
Ecol. Manage. 409, 241-249. 609
Gómez-Aparicio, L., Zamora, R., Gómez, J.M., Hódar, J.A., Castro, J., Baraza, E., 2004. 610
Applying plant facilitation to forest restoration: a meta-analysis of the use of shrubs as nurse 611
plants. Ecol. Appl. 14, 1128-1138. 612
Gómez-Aparicio, L., Gómez, J.M., Zamora, R., Boettinger, J.L., 2005. Canopy vs. soil effects 613
of shrubs facilitating tree seedlings in Mediterranean montane ecosystems. J. Veg. Sci. 16, 614
191-198. 615
31 Heithecker, T.D., Halpern, CB., 2007. Edge-related gradients in microclimate in forest
616
aggregates following structural retention harvests in western Washington. For Ecol. Manage. 617
248, 163-173. 618
Heydari, M., Prévosto, B., Naji, H.R., Mehrabi, A.A., Pothier, D., 2017. Influence of soil 619
properties and burial depth on Persian oak (Quercus brantii Lindl.) establishment in different 620
microhabitats resulting from traditional forest practices. Eur. J. For. Res. 136, 287-305. 621
Kovács, B., Tinya, F., Ódor, P., 2017. Stand structural drivers of microclimate in mature 622
temperate mixed forests. Agr. For. Meteorol. 234-235, 11-21. 623
Llorens, P., Domingo, L., 2007. Rainfall partitioning by vegetation under Mediterranean 624
conditions. A review of studies in Europe. J. Hydrol. 335, 37-54. 625
Ogle, K., Lucas, R.W., Bentley, L.P., Cable, J.M., Barron-Gafford, G.A., Griffith, A., Ignace 626
D., Jenerette, G.D.,Tyler, A., et al., 2012. Differential daytime and night-time stomatal 627
behavior in plants from North American deserts. New Phytol. 194, 464-476. 628
Pausas, J.G., Fernández-Muñoz, S., 2012. Fire regime changes in the Western Mediterranean 629
Basin: from fuel-limited to drought-driven fire regime. Clim. Change 110, 215-226. 630
Peñuelas, J., Sardans, J., Filella, I., Estiarte, M., Llusià, J., Ogaya, R., … Terradas, J. (2017). 631
Impacts of global change on Mediterranean forests and their services. Forests, 8(12), 1–37. 632
Porté, A., Huard, F., Dreyfus, P., 2004. Microclimate beneath pine plantation, semi-mature 633
pine plantation and mixed broadleaved-pine forest. Agr. For. Meteorol. 126, 175-182. 634
Prieto, I., Padilla, F.M., Armas, C., Pugnaire, F.I., 2011. The role of hydraulic lift on seedling 635
establishment under a nurse plant species in a semi-arid environment. Persp. Plant Ecol. Evol. 636
& Systematics 13, 181-187. 637
32 Pugnaire, F.I., Armas, C., Valladares, F., 2004. Soil as a mediator in plant-plant interactions 638
in a semi-arid community. J. Veg. Sci. 15, 85-92. 639
R Core Team., 2017. R: A language and environment for statistical computing. Vienna, 640
Austria: R Foundation for Statistical Computing. 641
Rambo, T.R., North, M.P., 2009. Canopy microclimate response to pattern and density of 642
thinning in a Sierra Nevada forest. For. Ecol. Manage. 257, 435-442. 643
Rascher, K. G., Große-Stoltenberg, A., Máguas, C., Werner, C., 2011. Understory invasion by 644
Acacia longifolia alters the water balance and carbon gain of a Mediterranean pine forest. 645
Ecosystems 14, 904-919. 646
Renaud, V., Innes, J.L., Dobbertin, M., Rebetez, M., 2011. Comparison between open-site 647
and below-canopy climatic conditions in Switzerland for different types of forests over 10 648
years (1998-2007). Theor. Appl. Climatol. 105, 119-127. 649
Renaud, V., Rebetez, M., 2009. Comparison between open-site and below canopy climatic 650
conditions in Switzerland during the exceptionally hot summer of 2003. Agr. For. Meteorol. 651
149, 873–880. 652
Riegel, G.M., Miller, R.F., Krueger, W.C., 1992. Competition for resources between 653
understory vegetation and overstory Pinus ponderosa in northeastern Oregon. Ecol. Appl. 2, 654
71-85. 655
Saccone, P., Delzon, S., Pages, J.P., Brun, J.J., Michalet, R., 2009. The role of biotic 656
interactions in altering tree seedling responses to an extreme climatic event. J. Veg. Sci. 3, 657
403-414. 658
Siegel, S., Castellan, N.J., 1988. Nonparametric statistics for the behavioural sciences. 659
MacGraw Hill Int., New York. 660
33 Simonin, K., Kolb, T.E., Montes-Helu, M., Koch, G.W., 2007. The influence of thinning on 661
components of stand water balance in a ponderosa pine forest during and after extreme 662
drought. Agr. For. Meteorol. 143, 266-276. 663
Sohn, J.A., Saha, S., Bauhus, J., 2016. Potential of forest thinning to mitigate drought stress: a 664
meta-analysis. For. Ecol. Manage. 380, 261-273. 665
Sonohat, G., Balandier, P., Ruchaud, F., 2004. Predicting solar radiation transmittance in the 666
understory of even-aged coniferous stands in temperate forests. Ann. For. Sci., 61, 629-641. 667
Unterseher, M., Tal, O., 2006. Influence of small scale conditions on the diversity of wood 668
decay fungi in a temperate, mixed deciduous forest canopy. Mycol. Res. 110, 169-178. 669
Vila-Cabrera, A., Coll, L., Martinez-Vilalta, J., Retana, J., 2018. Forest management for 670
adaptation to climate change in the Mediterranean basin: A synthesis of evidence. For. Ecol. 671
Manage. 407, 16-22. 672
Von Arx, G., Dobbertin, M., Rebetez, M., 2012. Spatio-temporal effects of forest canopy on 673
understory microclimate in a long-term experiment in Switzerland. Agric. For. Meteorol. 674
166–167, 144–155. 675
Von Arx, G., Graf Pannatier, E., Thimonier, A., Rebetez, M., 2013. Microclimate in forests 676
with varying leaf area index and soil moisture: potential implications for seedling 677
establishment in a changing climate. J. Ecol. 101, 1201-1213. 678
Williams, S.C., Ward, J.S., 2010. Effects of Japanese barberry (Ranunculales: Berberidaceae) 679
removal and resulting microclimatic changes on Ixodes scapularis (Acari: Ixodidae) 680
abundances in Connecticut, USA. Environ. Entomol. 39,1911-1921. 681
Zahner, R., 1958. Hardwood understory depletes soil water in pine stands. For. Sci. 4, 178-682
184. 683
34 Supplementary Material
685 686 687
Photos of the treatments: A) treatment M and M+S, the shrub layer was removed on the left 688
part, only young planted seedlings with their protectors were retained B) treatment L (right) 689
and L+S (left). C) Measurement of light beneath the shrub layer with sensor SKP 215. D) 690
Meteorological shelter for iButton logger. 691 692 693 694 695 696 697 698 699 700 701 702 703 704 705 706 707 708 709 A) B) C) D)
35 Table S1. Statistics for the different microclimatic variables for the summer period and the 710
whole year. 711
712
Summer Whole year
F-value P-value F-value P-value
Mean T 146.01 <0.001 262.92 <0.001 Mean RH 18.46 <0.001 261.23 <0.001 Mean VPD 163.30 <0.001 476.50 <0.001 Tmax-Tmin 319.64 <0.001 666.54 <0.001 RHmax-RHmin 125.19 <0.001 341.11 <0.001 VPDmax-VPDmin 157.87 <0.001 157.87 <0.001 ΔTmax (o-bc) 94.19 <0.001 297.92 <0.001 ΔRHmax (o-bc) 48.33 <0.001 42.50 <0.001 ΔVPDmax (o-bc) 80.69 <0.001 201.92 <0.001 713 714 715