HAL Id: hal-02076963
https://hal.inria.fr/hal-02076963
Submitted on 22 Mar 2019
HAL is a multi-disciplinary open access
archive for the deposit and dissemination of
sci-entific research documents, whether they are
pub-lished or not. The documents may come from
teaching and research institutions in France or
abroad, or from public or private research centers.
L’archive ouverte pluridisciplinaire HAL, est
destinée au dépôt et à la diffusion de documents
scientifiques de niveau recherche, publiés ou non,
émanant des établissements d’enseignement et de
recherche français ou étrangers, des laboratoires
publics ou privés.
Instrumental Data Management and Scientific Workflow
Execution: the CEA case study
Francieli Zanon Boito, Jean-François Méhaut, Thierry Deutsch, Brice Videau,
Frédéric Desprez
To cite this version:
Francieli Zanon Boito, Jean-François Méhaut, Thierry Deutsch, Brice Videau, Frédéric Desprez.
In-strumental Data Management and Scientific Workflow Execution: the CEA case study. IPDPSW
2019 - International Parallel and Distributed Processing Symposium Workshops, May 2019, Rio de
Janeiro, Brazil. pp.850-857, �10.1109/IPDPSW.2019.00139�. �hal-02076963�
Instrumental Data Management and Scientific
Workflow Execution: the CEA case study
Francieli Zanon Boito
1, Jean-Franc¸ois M´ehaut
1, Thierry Deutsch
2, Brice Videau
2, Fr´ed´eric Desprez
11Univ. Grenoble Alpes, Inria, CNRS, Grenoble INP*, LIG, 38000 Grenoble, France
2Univ. Grenoble Alpes, CEA, MEM, Laboratoire de Simulation Atomistique, 38000 Grenoble, France
Abstract—In this paper, we study a typical scenario in research facilities. Instrumental data is generated by lab equipment such as microscopes, collected by researchers into USB devices, and an-alyzed in their own computers. In this scenario, an instrumental data management framework could store data in a institution-level storage infrastructure and allow to execute tasks to analyze this data in some available processing nodes. This setup has the advantages of promoting reproducible research and the efficient usage of the expensive lab equipment (in addition to increasing researchers productivity). We detail the requirements for such a framework regarding the needs of our case study of the CEA, review existing solutions and recommend the choice of Galaxy. We then analyze the performance limitations of the proposed architecture, and point to the connection between centralized storage and the processing nodes as the critical point. We also conduct a performance evaluation over an experimental platform to observe the limitations encountered in practice. We finish by pointing issues that are not addressed by existing solutions, and are therefore future work perspectives for the research field.
Index Terms—distributed systems, data management, instru-mental data, workflow execution
I. INTRODUCTION
The scientific method includes observation of phenomena and experimentation to obtain information and to test hy-potheses. For research fields such as materials, experiments are conducted using lab equipment for crystallography, mi-croscopy, etc. They can generate large amounts of data, which researchers have to post-process and analyze [1]. A common situation for the usage of such equipment is that users have an allocated time slot (a lab session), during which the output need to be copied to some external device (like an external hard disk drive) by the user. That means the time to copy the data has to be a part of the lab session, an inefficient usage of expensive resources and a possible security problem [2].
Moreover, the scientists will then often proceed to run analysis tasks in their own computers. If a scientist typically runs “hungry” tasks, he or she will have a powerful, expensive workstation that will be underutilized for a good portion of the time (while the scientist is writing e-mails, for instance). Alternatively he or she can use shared resources from the re-search team or the institution, but that means new explicit data
This research was funded by the European Commission (EC) (H2020/RIA) through the EoCoE project — “Energy-oriented Centre of Excellence for computer applications”, project code 676629. It has also received funding from the European Unions Horizon 2020 research and innovation programme under the Marie Skodowska-Curie grant agreement No. 800144.
* Institute of Engineering Univ. Grenoble Alpes
movements. Another disadvantage of this typical approach is that results of these analysis tasks will only be available after the lab session, so they cannot be used during the same session to guide experimental decisions.
Finally, this traditional setup does not promote reproducible research since making information available depends solely on the researcher. Adequately sharing data sets, experimental parameters, and details about post-processing requires disci-pline and a considerable conscious effort. In tune with the importance of reproducible research, funding agencies have recently started to demand for projects they fund to make relevant data publicly available and to guarantee that it will remain available for a number of years.
To alleviate these issues and improve productivity, a frame-work can be used. With this approach, data is uploaded from lab sessions to the framework, and users submit analysis tasks to be executed in processing nodes available at the institution. In this paper we discuss the case study of the CEA (Com-missariat `a l’´energie atomique et aux ´energies alternatives) in Grenoble, France. We review the literature to find an appropriate framework to handle its instrumental data and analysis workflow execution. Motivated by this case study, we propose a generic architecture for such a system and analyze its performance limitations in theory and through an experimental campaign. Although motivated by a specific case study, this work studies a generic architecture. Therefore our contributions concern any research facility that uses or would consider using such a framework. Moreover, we identify aspects that are not currently well addressed and should be subject of future work in the domain.
This paper is organized as follows. Section II summarizes the requirements of our case study and reviews the literature to find an appropriated framework. We propose a generic archi-tecture for the deployment of the framework in Section III. Then we evaluate this architecture theoretically to find its performance limitations in Section IV, and experimentally in Section V. Section VI summarizes our findings and points future work perspectives. Section VII concludes the paper.
II. REQUIREMENTS AND RELATEDWORK
Nguyen et al. [2] discuss the management of instrumental data for materials research at the University of Illinois at Urbana-Champaign. They describe the same situation as we described in Section I. The authors conducted a survey with
51 users of large lab equipment in their institution [3]. The answers provided by these users to their survey pointed that 66% of the users would like to upload files during the lab session, and 26% would prefer to do it later. 96% of them used USB devices to transport data from the lab session to their offices, and almost 80% would be interested in the proposed framework if available (17% said “maybe”). In addition, they collected information from their two most popular lab equipments, and showed the workload (number and size of files) is variable and bursty. Later, when they proposed a data management framework [2], they reported from 15 to 20 minutes on average saved to every one-hour lab session.
Although its usefulness is clear, for such a framework to be successful user adoption is indispensable. In order to attract users, which are from different backgrounds and sometimes not skilled in IT, the interface must be simple and intuitive. Web-based approaches, where the system is accessed from a web browser, are preferred because they do not impose a specific operating system or hardware configuration to be used. At the same time that web-based graphical interfaces are more friendly to the general public, more tech-savvy users may become frustrated by their lack of flexibility. Therefore, in addition to an easy-to-use interface, the framework should also provide some support to programming languages. One effec-tive way of doing so could be to support Jupyter notebooks [4], as they have become widely popular among researchers.
From our case study, we gathered the input from the user should be kept at a minimum. As researchers are busy with their activities, social network-style solutions, like the SEAD Project [5], that include information about projects and publications, could end up not being updated as often as necessary (as it is the case for many institutional web pages). With support from the framework, metadata about experiments can often be extracted from the data due to the file formats used by lab equipments, without relying on the user’s recollection. However, additional information may be required at the time of the upload.
Running tasks through the framework often means users can run tasks that are heavier than what they could run in their own workstations. In addition, the framework could allow for different analysis that consider multiple data sets. For instance, there is an increased interest in using machine learning tech-niques over large data sets in all fields of research [6]. These could be applied over results of multiple experiments without having the user explicitly gathering this data.
One of the most important motivations for the framework is to promote experimental data reuse. If it allows for searches to be conducted at least over metadata fields, it helps avoid-ing that users spend time and resources to conduct exper-iments others already conducted. Furthermore, to promote reproducible research, the framework must keep information about data provenance, with all tasks applied to datasets and intermediate results. The users must have access to ways of sharing this information with colleagues or publicly.
A. Related Work
4CeeD1 is a client-server framework [2]. At the client,
executed in the computers that control lab equipment, an uploader tool receives files and metadata from the users. A curator application allows users to browse, edit, and share data. Searches can be conducted from metadata and tags, but also from structured data. Uploaded files are kept in a document store (MongoDB [7]). Each file upload triggers the execution of a certain workflow, depending on the data type. There are only three possible workflows, compositions of four possible tasks, including extracting information from microscope output formats and predicting if the experiment is successful or not. Each task is executed by a certain type of executor, which receives requests from the system through a queue. Their system is able to increase or decrease the amount of executors being used to adapt to the current demand.
4CeeD is not adequate for the CEA case study due to its limitations regarding analysis tasks. To ensure the usefulness of the system, and to promote reproducible research, it is desirable for users to execute all tasks through the framework to keep provenance information and intermediate results.
Many proposals from the literature focus on data archival and curation, such as the Data Conservancy Instance [8], M´edici [9], and the SEAD Project [5]. They are not suited to our situation because they do not cover aspects related to the execution of processing tasks.
Similarly, Researchers from the ESRF (European Syn-chrotron Radiation Facility2) proposed ISPyB [10]. It targets synchrotron macro-molecular crystallography (MX), which is a type of experiment conducted at the beam lines. Their system tracks samples (including physical shipping to the site) and their placement in the automatic sample changer. Processing tasks are not in the scope of their tool, as users from outside the ESRF will typically conduct those in their own infrastructure. A possible issue for the framework to support all used analysis tasks is porting a large number of tools. Padhy et al. [11] propose Brown Dog, a framework to provide access (through a REST API) to different tools and execute them in a way that is transparent to the users. This is accomplished with a few modifications in the tool (to integrate in their system) and detailed information about input and output formats.
The SEAD Project [5] allow users to upload data to a frame-work and specify relationships (to represent provenance, for instance). However, the effort of reproductibility still depends on the scientists. The authors argue their social network-style framework would encourage users for “publicity” purposes. Nonetheless, as described in the previous section, we would not like to leave this responsibility to users.
Goecks et al. [12] present Galaxy for genomic research. This framework is the one that best meets our requirements, specially regarding reproducible research. Datasets cannot be modified, since tasks generate new versions of them. The history of dataset versions, all applied tasks (including pa-rameters), and text can be exported to pages by users. When
these pages are shared, others can easily inspect all the steps of the analysis and import datasets, tasks, or the whole analysis workflow to their own work space. In Galaxy, new tools are added by providing a command to be invoked, with description of input and output formats. Registered tools can be combined into workflows by connecting boxes with arrows (through a graphical interface). In addition to a web-based interface, the framework can be accessed through its API, with bindings for Python, Java, PHP, and JavaScript. Jupyter notebooks are supported for interactive data manipulation.
Besides providing most of our requirements, Galaxy is open-source and under development. It has been used to sup-port over 5, 000 publications, and a help forum3 is active for usage and administration issues. Developing a new framework would require the development effort at first, but also a con-tinuous effort to keep it from becoming outdated. Nonetheless, not all requirements from our case study are met by Galaxy, notably it does not allow for searches over metadata. Other required improvements are discussed in Section VI.
III. PROPOSED ARCHITECTURE
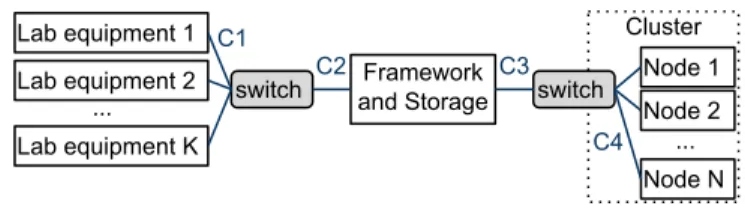
The previous section discussed the choice of the framework for the CEA case study. Fig. 1 depicts the architecture we propose for its deployment, which is not specific to using Galaxy. A centralized shared storage infrastructure is typically already in place in such a research facility, for instance using the NFS distributed file system [13] as in the CEA. Tasks from the framework are to be executed in a few available clusters of tens to a few hundreds of nodes. Being a publicly-funded institution, it is preferable to keep experimental data inside the institution instead of using some external cloud. Four lab equipments would be connected to the system right away, with ≈ 40 users. We model a generalized version of this architecture as:
• K lab equipments L1, ..., LK, each attached to a
com-puter with a storage device4of speed SL
1, ..., SLK MB/s
for write and read;
• identical links C11, ..., C1K of speed β1 MB/s between
them and a switch, and C2 of speed β2 MB/s between
this switch and the storage/framework;
• a single storage server SE that is capable of achieving a performance of S MB/s for write and read;
• N processing nodes with storage devices of speeds
SP1, SP2, ...SPN for write and read;
• identical links C41, ..., C4N of speed β4 MB/s from the
nodes to a second switch, and C3 of speed β3 MB/s
between this switch and the storage/framework.
This architecture considers a single processing cluster and a single storage server for simplicity. In practice, having more clusters for processing tasks can improve transfer speed if the different clusters do not share the C3 link. Similarly, having multiple storage servers — in a distributed storage solution such as GPFS [14] — can improve the speed S and the C2 and
3https://biostar.usegalaxy.org
4For simplicity, storage speed includes speed-up provided by caches.
Framework and Storage Cluster C1 C3 C4 ... Lab equipment 1 Lab equipment 2 Lab equipment K switch Node 1 Node 2 Node N ... switch C2
Fig. 1: Architecture for the framework
C3 links. As long as these speed improvements are considered, the analysis presented in this paper still applies.
The framework imposes a load as follows: the K equip-ments generate data at rates W1, ..., WK; M concurrent tasks
T1, ..., TM read data at rates R1, ..., RM MB/s, and write
results back to the framework at rates P W1, ..., P WM. We
assume, without loss of generality, that each task executes on a single node, thus M ≤ N . We assume negligible overhead by switches and by the framework. When handling small amounts of data, this overhead is not negligible, however in our theoretical analysis we focus on the performance limits of the architecture, when handling large amounts of data. We also assume the nodes, the network, and the storage are completely dedicated to the framework.
IV. THEORETICAL ANALYSIS OF THE ARCHITECTURE
Data is generated by a lab equipment and written to its local storage device, then sent through its C1 link, and through the C2 link that is shared with data from other lab equipment. Hence the actual data generation load is given by:
equipment load = min([PK
i=1min(Wi, SLi, β1)], β2)
Each task reads data through the C3 link (shared with all other processing tasks), through the node’s C4 link, and written to that node’s storage device. Results being written by the tasks travel in the opposite direction. Hence the actual processing tasks load5,6 to the storage server is:
processing load = min([PM
j=1min(xj× Rj, β4)], β3)+
min([PM
j=1min(xj× P Wj, β4)], β3) ,
where to every j, 0 ≤ xj≤ 1 is the highest xjthat
satisfies (xj× Rj) + (xj× P Wj) ≤ SPj
The actual performance of the system is bounded by the lab equipment and processing tasks loads:
equipment performance ≤ equipment load processing performance ≤ processing load
And, finally, performance is limited by the storage infras-tructure’s read and write speed, following this rule:
equipment performance + processing performance ≤ S
5If tasks can access data directly from a shared file system such as NFS,
the xjfactors can be eliminated. 6We assume R
jand P Wjare altered by the same factor (xj) due to sharing
the storage device’s bandwidth. Different combinations of factors could be observed using different I/O block schedulers.
That means lab devices and C1 links will only affect performance when they are slower than the equipment’s data generation rate. That would be the case, for instance, if an electronic microscope were to generate 100 GB/s of data while its computer has an HDD capable of writing at 150 MB/s and a 1 Gb/s Ethernet connection. Similarly, for tasks the C4 links speed is only important if Ri> β4 or P Wi> β4.
None of the equipment present at the CEA generate more than an HDD speed (≈ 150 MB/s) or the existing intercon-nection speed (1 Gb/s). Still, it is important to notice the granularity for the upload is of whole files, and we could imagine a situation where a number of files will be generated and approved by the user before going to the system. That means the generated write load will not be constant over time, but include periods of inactivity and peaks of demand. This is consistent to what was observed in related work and discussed in Section II-A. In a similar way, tasks might read whole files in their initial steps and write results only at the end. A. Amount of data being stored by the framework
Data is produced and stored in the storage server, from where it will eventually be archived to tapes. Before that, it will be accessed a number of times. If data is archived too soon (before users are done with it), it will have to be retrieved from archival, which takes longer. Let us call I bytes per second the rate of data being written.
The amount accumulated in the storage in a day of activity is 86400 × I. If we want to hold data in the server for 60 days, that means we need capacity of 60 × 86400 × I. With I of 1 MB/s, that is 4.94 TB; if I = 25 MB/s, then 123.6 TB.
It is clear the storage server will actually have to access a pool of D disks. If their speeds are P1, ..., PD, the speed S of
the storage server is S =PD
i=1Pi. That can be provided by
a single storage server until the bandwidth limitation of the RAID controller or of the RAM memory. To achieve higher performance, multiple servers need to be used in parallel, with some system that allows for that, such as MongoDB or GPFS. In this case, we could reasonably expect little overhead by metadata management because files are immutable.
B. Limitation by the network links
The heaviest surveyed generation load from the CEA was of 200 GB over 48 hours, hence we pessimistically estimate the load at 1.18 MB/s per lab equipment. A 1 Gb/s C2 link means we the storage can receive the load of up to 108 equipments. On the other hand, tasks will often read whole datasets before processing, which means their reading load is limited by the C4 links and the nodes’ devices speed SPi. Assuming
SPi ≥ β4 and β4 = 1 Gb/s, a 1 Gb/s C3 link means only
one processing task (running in one among tens to hundreds of nodes) can be served at a time. If 50 tasks read data concurrently, their individual performance will be 2.56 MB/s. If the C3 link is upgraded to 10 Gb/s, for instance, 10 concurrent tasks can be served at a time. Nonetheless, up-grading these links has a high cost, as the components are physically in different buildings, and is a temporary fix, as
increases in the number of users cause them to become the problem again. Therefore, the C3 link is the most important performance limitation of the architecture.
V. EXPERIMENTAL PERFORMANCE EVALUATION
The last section presented a theoretical performance analysis of the proposed architecture, which is not related to the use of the Galaxy framework. In this section, we complement that analysis by discussing an experimental evaluation. Such an analysis is essential before proceeding to adapting and deploying the framework. We chose to conduct this analysis using the Grid’5000 testbed [15] to replicate the environment of the CEA. That choice has the advantage of isolating the phenomena we want to study from interference from external events. Moreover, it was not possible to conduct these experiments in the CEA, as it is a production environ-ment. Section V-A discusses the experimental methodology, a characterization of network and hard disk performance in the experimental environment is presented in Section V-B, and then the following sections discuss the experiments: upload in Section V-C, download in Section V-D, and access to data by the tasks in Section V-E.
A. Experimental Methodology
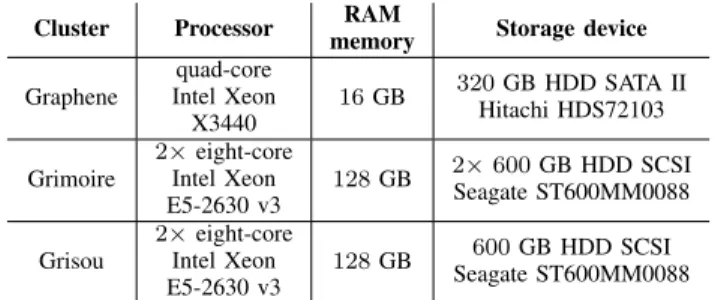
Table I details the configuration of the used Grid’5000 nodes (from the Nancy site). Whole clusters were reserved to minimize network interference.
TABLE I: Configuration of the nodes from the used clusters
Cluster Processor RAM
memory Storage device Graphene quad-core Intel Xeon X3440 16 GB 320 GB HDD SATA II Hitachi HDS72103 Grimoire 2× eight-core Intel Xeon E5-2630 v3 128 GB 2× 600 GB HDD SCSI Seagate ST600MM0088 Grisou 2× eight-core Intel Xeon E5-2630 v3 128 GB 600 GB HDD SCSI Seagate ST600MM0088
Nodes from Grimoire and Grisou are connected by 10 Gbps links, and the clusters are connected at 40 Gbps. Graphene nodes are separated in four switches, with 1 Gbps links between the nodes and to the other clusters.
One node from the Grimoire cluster was used to run the Galaxy 18.05 framework and the NFS server. Galaxy data is stored in the shared folder, exported as NFSv3, and mounted by all processing nodes before the experiments.
Galaxy was configured as recommended for a production instance [16]. The framework uses a PostgreSQL 9.6 database for its internal informations, a separate uWSGI web stack, and a nginx 1.15.3 proxy server (with upload module version 2.2.0). Requests are first served by 8 processes with 2 threads each, and a pool of 8 additional processes perform the required work. The Galaxy server makes job submissions to Condor 8.6.12, and a different Grimoire node was used as the resource manager. Workers are in the Grisou cluster (48 nodes). One of the sets of Graphene nodes (that share a switch, thus up
to 37 nodes) was selected for lab equipment, and the other Graphene sets host framework users.
An analysis tool was written to read the whole contents of an input file in 1 MB blocks and to output a single number. When executed locally, this tool’s performance matches the I/O speed of the storage device. Lab equipment and users access Galaxy through its Bioblend Python API. Since uploading files and running tools are asynchronous, experiments upload two 1 GB files at the same time and then check if the jobs have finished once per second. From each repetition we take the execution time of the slowest node (the makespan). Then aggregated bandwidth is calculated as number of tasks×2GBmakespan .
Each result was repeated N (at least four) times. The Kolmogorov-Smirnov test was applied to all sets of results, and we could not reject the hypothesis of normality. Hence we compare results with averages and error bars that define the interval [mean - standard error, mean + standard error], where error is calculated as √σ
N.
Scripts used for the experiments are available at: https://github.com/francielizanon/galaxy experiments. B. Network and hard disk benchmarks
To have baselines for performance results and to confirm what we can expect from the environment, we first bench-marked the hard disk used by the NFS server. For that, the Iozone benchmark [17] was executed four times to write and then read a 200 GB file. A different file is written at each repetition, and the cache is synced to disk between the write and read experiments. The access is done with 1 MB requests. Table II presents the distribution of the results. Average write bandwidth was measured to be 166 MB/s, and read 152 MB/s. TABLE II: Hard disk speed in MB/s, measured with Iozone.
Min Median Mean Max Write 145.9 161.9 166.1 194.6 Read 137.4 146.3 151.7 177.0
To benchmark the network, the Iperf tool [18] was used for ten seconds between all nodes and the Galaxy and NFS server. The experiment was repeated four times to each pair. Results are presented in Table III. On average a performance of 117.87 MB/s was obtained for the 1 Gbps link to the Graphene cluster, and of 1.18 GB/s for the 10 Gbps links.
TABLE III: Network speed in Mbps between all nodes to the Galaxy server, measured with Iperf.
Min 1st Qu. Median Mean 3rd Qu. Max Graphene 941 943 943 942.9 943 944 Grimoire 9615 9615 9626 9628 9638 9646
Grisou 9585 9636 9636 9636 9646 9646
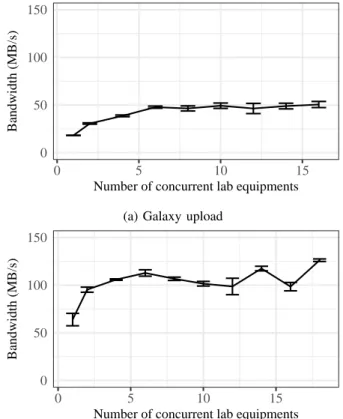
C. Upload performance
Fig. 2a presents the results from this experiment, where lab equipment concurrently upload a dataset of two 1 GB files to the Galaxy server. At first, as the number of concurrent equipment increases, aggregate performance is improved as the
0 50 100 150
0 5 10 15
Number of concurrent lab equipments
Bandwidth (MB/s)
(a) Galaxy upload
0 50 100 150
0 5 10 15
Number of concurrent lab equipments
Bandwidth (MB/s)
(b) NFS write
Fig. 2: Aggregated bandwidth
server is not yet saturated. Starting from six lab equipments, performance becomes stable at approximately 50 MB/s.
The obtained performance is lower than what is expected considering the server hard disk performance, discussed in Section V-B. As discussed in Section IV, we would expect it to be limited to the server’s performance of ≈ 160 MB/s and by the network between the lab equipments and the server. We also investigated the performance obtained when multi-ple clients write to NFS at the same time. We used the same machines as in the previous experiment, but stopped Galaxy. To approximate the upload scenario, each client/lab equipment concurrently copies two 1 GB files to the shared NFS folder. Aggregate bandwidth obtained for this experiment are pre-sented in Fig. 2b. We can see the NFS write performance did not limit the results from Fig. 2a, as it is roughly two times higher (≈ 100 MB/s). That means the difference in performance has to be caused by using Galaxy.
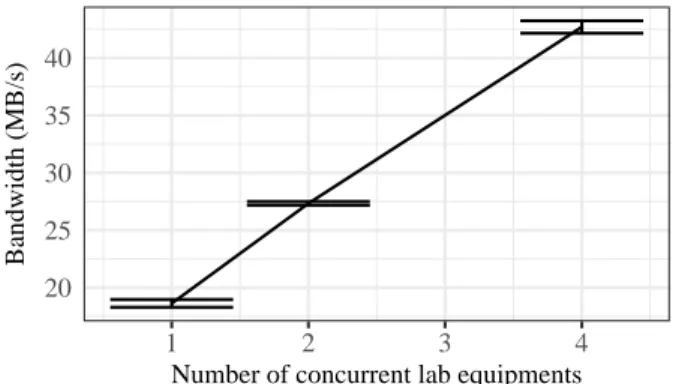
1) Upload test with local workers: When a file is uploaded to Galaxy, it runs a job in one of the Condor workers to extract metadata and fill the dataset data structure. To identify if that activity could be slowing down upload performance, we repeated the upload experiment, but this time stopping Condor and configuring Galaxy to run tools locally instead of sending them to remote workers. The experiment fails when using more than four concurrent lab equipments, as the server becomes overloaded. Results are shown in Fig. 3. Compared to the previous results, using Condor workers, performance
20 25 30 35 40 1 2 3 4
Number of concurrent lab equipments
Bandwidth (MB/s)
Fig. 3: Upload experiment repeated without Condor workers
is slightly improved, but it is still roughly half of what was achieved in the NFS write experiment. Therefore we conclude the jobs executed in the workers during the upload are not what causes the performance to be slower than expected.
2) Upload through NFS: Another suspect of causing the relatively low performance was the proxy used to handle up-loads. In this new experiment nine 1 GB files were previously written to the shared NFS folder, and then we executed a script in the Galaxy node that uses the API to directly add files from the server’s hard disk. Therefore, time is only what is spent by Galaxy for its internal operations (write to the database, extract metadata, etc). Results are presented in Table IV, and show Galaxy takes approximately 90 seconds to its internal operations involved in adding a new dataset. In the upload experiment with six lab equipments, average makespan (time the slowest process took to write two 1 GB files) was of 257.6 seconds. That means a significant portion of the upload time is spent by Galaxy in its own activities, instead of being limited by the network or by the hard disk.
TABLE IV: Add a 1 GB file already in the server’s disk
Min Mean Median Max Time (seconds) 92.7 102.4 94.5 156.9 Bandwidth (MB/s) 6.5 10.3 10.8 11.0
D. Download performance
In this experiment, users (equally distributed among the three sets of Graphene nodes that are not used as lab equip-ment) use the API to download a previously uploaded 1 GB file from Galaxy. Results are shown in Fig. 4a, and show an aggregated bandwidth that is compatible to the limitations imposed by the network and the server’s hard disk.
For comparison, we present results from a similar experi-ment in Fig. 4b, where the processing nodes (Grisou nodes) read 1 GB file each from the NFS server, without going through Galaxy. That is the path of data to be processed by analysis tasks. Grisou nodes are more powerful than Graphene ones, and the network connection to the NFS server is also faster. Still, we can see that the NFS read performance is lower than the download performance, and it degrades as the number of concurrent readers increases. That means Galaxy is able to
0 50 100 150 200 0 10 20 30
Number of concurrent users
Bandwidth (MB/s)
(a) Users download files from Galaxy
0 50 100 150 200 0 10 20
Number of concurrent users
Bandwidth (MB/s)
(b) Users (in Graphene) read files from the NFS
Fig. 4: Aggregated bandwidth
handle concurrent read accesses more efficiently, while the distributed file system imposes further overhead.
E. Processing tasks I/O performance
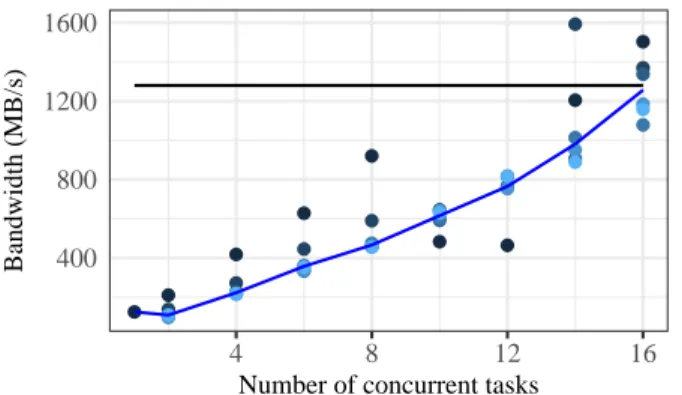
In this experiment external users ask Galaxy to run a task (the code that reads the whole file and outputs a number) with previously created files. Tasks are executed in the processing nodes, each is executed with a different file, and caches are dropped before the experiment. Results are presented in Fig. 5. The line shows the average, and the points are the different repetitions of the experiment. The horizontal black line is the limitation imposed by the network (10 Gb/s).
We can see the aggregated bandwidth is quite large, of hundreds of MB/s, while we expected, as discussed in Sec-tion IV, this experiment to be limited by the NFS server hard disk performance (160 MB/s). The nodes involved in this experiment are the same that executed the NFS read experiment, presented in Fig. 4b.
The reason for these somewhat unexpected results is caching by Galaxy. These experiments were executed right after the upload experiments, discussed in Section V-C, and with the same files. Although we dropped the operating system caches between the experiments, it does not affect the Galaxy and NFS caching in place. In the NFS read experiment (Fig. 4b), that does not happen because files are not uploaded to Galaxy before the experiment, but written to the NFS shared folder by lab equipment nodes.
● ●●●●●● ● ● ● ● ● ● ● ● ● ● ● ● ● ● ● ● ● ● ● ● ● ● ● ● ● ● ● ● ● ● ● ● ● ● ● ● ● ● ● ● ● ● 400 800 1200 1600 4 8 12 16
Number of concurrent tasks
Bandwidth (MB/s)
Fig. 5: Aggregated bandwidth during the processing experi-ment
These results show us the good impact caching could have in the framework performance. In this experiment, tasks are served with a good scalability up to the limitation of the network. However, that happened because files were processed right after being generated, what could not always be the case for the framework. Smart caching decisions could be made when considering the patterns in file usage, as we will discuss in the next section.
VI. DISCUSSION ANDFUTUREWORKPERSPECTIVES
In Section II, we have detailed the requirements from our case study. After reviewing existing frameworks, we have recommended Galaxy as it implements most of the desired functionality and is under active development. Nonetheless, it still requires some adaptation to fully serve our needs.
Despite the fact transparently executing all processing tasks in the framework infrastructure is convenient for users and enforces reproducible research, some exceptions will have to be made. This happens because some tasks have extraordinary hardware requirements, and the research groups often already have machines to run them (and may not be interested in sharing these machines with other groups). Notably, some tasks, like segmentation of images obtained from a FIB (focused ion beam), are semi-supervised and require input from a specialist over their execution. While allowing for data processing outside of the framework, it is important to still capture provenance information, as done by Medici [9].
As Galaxy was intended for genomic research, its interface will require a few adaptations for the intended usage. One of the most important ones is showing previews (thumbnails) of images. The large datasets generated by lab equipment at the CEA are typically images, and some experiments result in thousands of them. In this case, previews allow users to more easily navigate through them. Although it is possible to open a visualization window of a dataset in Galaxy, it is not possible to visualize them while adding notes or selecting tools to run. Furthermore, custom data types need to be created to represent data generated by the existing lab equipment, and the relevant metadata fields.
It is clear adapting and deploying such a framework is not a trivial task, and it is costly in human-hours. Moreover, as discussed by Mayernik et al. [8], for its success at long term the system will require staff to manage it, but also to train users and oversee how they use the framework. It is therefore of key importance to have a long-term commitment from the institution regarding staff, equipment, software updates, etc. Nonetheless, such a commitment is necessary and has a return in researchers productivity.
We have analyzed the theoretical performance limitations of the architecture in Section IV. Data is expected to be used the most soon after its generation, as researchers draw conclusions about experiments and prepare publications. After some time most data will be rarely accessed, so it is appropriate to transfer it to long-term archival. Even when considering a relatively low data generation rate and wanting to keep data in hard disks for 60 days, the volume of accumulated data reaches terabytes. That, combined with the importance of the storage speed for the performance of the framework, points the best architecture for this framework is one where multiple storage servers and hard disks are dedicated to it.
We drew information about data usage and lifetime from talks with researchers. More precise information is not avail-able since the framework has not been deployed yet, and we could not find publicly available information from other systems. We recommend, therefore, the collection of statistics and traces — whenever possible — about the framework usage and performance. This will provide the base for best decisions in the future. Furthermore, some usage patterns could be found (for instance, a type of file that is often generated but never used, or some users that like to analyze their data right away after its upload), and that could be used to guide data placement decisions: data that is more likely to be used in the near future could be prefetched to processing nodes, and on the other hand data that is not being accessed again can be moved to archival to free space.
Prefetching files to the processing nodes’ storage devices could be a way of mitigating the contention expected to happen in the connection between the centralized storage and the processing nodes. That connection is a critical point of the system as all tasks’ performance depend on having their input data from storage, and the number of tasks (and consequently the amount of input data) is only expected to grow as the framework succeeds and more local users adopt it. We plan on exploring this prefetching idea as future work.
In our experimental performance evaluation from Section V, we found that the framework imposes significant overhead during the upload operation, and reaches a peak aggregated bandwidth of 50 MB/s (while the architecture should allow it to be higher than 100 MB/s). If the workload generated by lab equipment were to be lower than this limit, it will not become a problem. Nonetheless, the workload may become heavier by adding more lab equipment or by generating larger datasets. Notably, some experiments may generate data for hours, and only write results at the end, generating therefore a bursty workload with high activity peaks. That means data will not
be available for processing tasks right away. Whether that is a problem or not depends on how long users can wait before analyzing their results. For instance, for a 200 GB dataset generated in 48 hours, upload would take at least 68 minutes, which could be acceptable.
On the other hand, one of the goals of the framework is to allow for results to be obtained during the lab session, in order to guide experimental decisions. In that case, finding ways to continuously upload data while it is being generated by the lab equipment, and consequently to avoid the bursty behavior, would greatly improve the overall perceived performance of the framework. Another possible way of tackling this issue is to allow tasks to be processed in the computer that is located close to the lab equipment, in-situ. A model could be used to decide when to do that considering the difference in the performance of the task executed locally or in the processing nodes, and the time needed to move the data. Investigating that approach is suggested as future work.
VII. CONCLUSION
In a research facility where large expensive equipment are used to conduct experiments, users have allocated time slots (lab sessions) with the equipment, during which a large amount of data may be generated. In this situation, the use of an instrumental data management framework avoids that users spend a portion of the lab session copying results into external drives. By avoiding that the users run analysis tasks in their own computers, the system is able to keep provenance information and thus to promote reproductible research.
In this paper, we studied the CEA case study. We reviewed existing frameworks according to our requirements and rec-ommended the adoption of Galaxy. We have proposed and analyzed an architecture for the deployment of the framework. From this analysis, we concluded the connection between the storage infrastructure and the processing nodes is the critical point for performance. We also conducted an experimental evaluation of the architecture’s performance, and observed that overhead imposed by the framework impairs upload performance. We have pointed further improvement required to the framework for its adoption, and also issues that are not currently addressed and are therefore future work perspectives for the field.
ACKNOWLEDGMENT
The authors would like to thank the researchers from the CEA and the ESRF who kindly provided information about their activities. Special thanks to Jerome Kieffer, Christine Leroy, and Pierre-Henri Jouneau.
This project is funded by the European Union.
REFERENCES
[1] J. Kieffer, S. Petitdemange, and T. Vincent, “Real-time diffraction com-puted tomography data reduction,” Journal of Synchrotron Radiation, vol. 25, no. 2, pp. 612–617, 2018.
[2] P. Nguyen, S. Konstanty, T. Nicholson, T. OBrien, A. Schwartz-Duval, T. Spila, K. Nahrstedt, R. H. Campbell, I. Gupta, M. Chan, K. McHenry, and N. Paquin, “4CeeD: Real-time data acquisition and analysis frame-work for material-related cyber-physical environments,” in Proceedings - 2017 17th IEEE/ACM International Symposium on Cluster, Cloud and Grid Computing, CCGRID 2017. IEEE, 2017, pp. 11–20.
[3] 4CeeD Design Team, “User Study and Survey on Material-related Experiments,” University of Illinois at Urbana-Champaign, Tech. Rep., 2016. [Online]. Available: https://www.ideals.illinois.edu/handle/2142/ 94738
[4] T. Kluyver, B. Ragan-Kelley, F. P´erez, B. Granger, M. Bussonnier, J. Frederic, K. Kelley, J. Hamrick, J. Grout, S. Corlay, P. Ivanov, D. Avila, S. Abdalla, C. Willing, and J. development team [Unknown], “Jupyter notebooks — a publishing format for reproducible computa-tional workflows,” in Positioning and Power in Academic Publishing: Players, Agents and Agendas. IOS Press, 2016, pp. 87–90.
[5] J. Myers, M. Hedstrom, D. Akmon, S. Payette, B. A. Plale, I. Kouper, S. McCaulay, R. McDonald, I. Suriarachchi, A. Varadharaju, P. Kumar, M. Elag, J. Lee, R. Kooper, and L. Marini, “Towards Sustainable Cu-ration and Preservation: The SEAD Project’s Data Services Approach,” in 2015 IEEE 11th International Conference on e-Science. IEEE, aug 2015, pp. 485–494.
[6] L. Dresselhaus-Cooper, M. Howard, M. C. Hock, B. T. Meehan, K. J. Ramos, C. A. Bolme, R. L. Sandberg, and K. A. Nelson, “Machine learning to analyze images of shocked materials for precise and accurate measurements,” Journal of Applied Physics, vol. 122, no. 10, p. 104902, 2017.
[7] K. Chodorow, Scaling MongoDB: Sharding, Cluster Setup, and Admin-istration. ” O’Reilly Media, Inc.”, 2011.
[8] M. S. Mayernik, G. S. Choudhury, T. DiLauro, E. Metsger, B. Pralle, M. Rippin, and R. Duerr, “The data conservancy instance: Infrastructure and organizational services for research data curation,” D-Lib Magazine, vol. 18, no. 9-10, pp. 1–12, 2012.
[9] L. Marini, R. Kooper, J. Futrelle, J. Plutchak, A. Craig, T. McLaren, and J. Myers, “Medici: A scalable multimedia environment for research,” in The Microsoft e-Science Workshop, 2010.
[10] S. Delageni`ere, P. Brenchereau, L. Launer, A. W. Ashton, R. Leal, S. Veyrier, J. Gabadinho, E. J. Gordon, S. D. Jones, K. E. Levik, S. M. Mcsweeney, S. Monaco, M. Nanao, D. Spruce, O. Svensson, M. A. Walsh, and G. A. Leonard, “ISPyB: An information management sys-tem for synchrotron macromolecular crystallography,” Bioinformatics, vol. 27, no. 22, pp. 3186–3192, 2011.
[11] S. Padhy, G. Jansen, J. Alameda, E. Black, L. Diesendruck, M. Dietze, P. Kumar, R. Kooper, J. Lee, R. Liu, R. Marciano, L. Marini, D. Mattson, B. Minsker, C. Navarro, M. Slavenas, W. Sullivan, J. Votava, I. Zhar-nitsky, and K. McHenry, “Brown Dog: Leveraging everything towards autocuration,” in 2015 IEEE International Conference on Big Data (Big Data). IEEE, oct 2015, pp. 493–500.
[12] J. Goecks, A. Nekrutenko, J. Taylor, and T. Galaxy Team, “Galaxy: a comprehensive approach for supporting accessible, reproducible, and transparent computational research in the life sciences,” Genome Biol-ogy, vol. 11, no. 8, p. R86, 2010.
[13] R. Sandberg, “The sun network file system: Design, implementation and experience,” in in Proceedings of the Summer 1986 USENIX Technical Conference and Exhibition. Citeseer, 1986.
[14] F. Schmuck and R. Haskin, “Gpfs: A shared-disk file system for large computing clusters,” in Proceedings of the 1st USENIX Conference on File and Storage Technologies. USENIX Association, 2002, p. 19. [15] R. Bolze, F. Cappello, E. Caron, M. Dayd´e, F. Desprez, E. Jeannot,
Y. J´egou, S. Lanteri, J. Leduc, N. Melab et al., “Grid’5000: A large scale and highly reconfigurable experimental grid testbed,” The International Journal of High Performance Computing Applications, vol. 20, no. 4, pp. 481–494, 2006.
[16] “Galaxy deployment & administration: Production environments. https:// docs.galaxyproject.org/en/master/admin/production.html,” accessed: Au-gust 2018.
[17] “IOzone Filesystem Benchmark. http://www.iozone.org/,” accessed: Au-gust 2018.
[18] “iPerf — The ultimate speed test tool for TCP, UDP and SCTP. https: //iperf.fr/,” accessed: August 2018.