HAL Id: hal-01806134
https://hal.archives-ouvertes.fr/hal-01806134
Submitted on 5 May 2021
HAL is a multi-disciplinary open access
archive for the deposit and dissemination of
sci-entific research documents, whether they are
pub-lished or not. The documents may come from
teaching and research institutions in France or
abroad, or from public or private research centers.
L’archive ouverte pluridisciplinaire HAL, est
destinée au dépôt et à la diffusion de documents
scientifiques de niveau recherche, publiés ou non,
émanant des établissements d’enseignement et de
recherche français ou étrangers, des laboratoires
publics ou privés.
Plant functional type classification for earth system
models: results from the European Space Agency’s Land
Cover Climate Change Initiative
B. Poulter, N. Macbean, A. Hartley, I. Khlystova, O. Arino, R. Betts, S.
Bontemps, M. Boettcher, C. Brockmann, P. Defourny, et al.
To cite this version:
B. Poulter, N. Macbean, A. Hartley, I. Khlystova, O. Arino, et al.. Plant functional type classification
for earth system models: results from the European Space Agency’s Land Cover Climate Change
Initiative. Geoscientific Model Development, European Geosciences Union, 2015, 8 (7), pp.2315
-2328. �10.5194/gmd-8-2315-2015�. �hal-01806134�
www.geosci-model-dev.net/8/2315/2015/ doi:10.5194/gmd-8-2315-2015
© Author(s) 2015. CC Attribution 3.0 License.
Plant functional type classification for earth system models: results
from the European Space Agency’s Land Cover
Climate Change Initiative
B. Poulter1,2, N. MacBean1, A. Hartley3, I. Khlystova4, O. Arino5, R. Betts3, S. Bontemps6, M. Boettcher7, C. Brockmann7, P. Defourny6, S. Hagemann4, M. Herold8, G. Kirches7, C. Lamarche6, D. Lederer6, C. Ottlé1, M. Peters7, and P. Peylin1
1Laboratoire des Sciences du Climat et de l’Environnement, LSCE-IPSL (CEA-CNRS-UVSQ), 91191 Gif-sur-Yvette, France 2Department of Ecology, Montana State University, Bozeman, Montana 59717, USA
3Met Office Hadley Centre, FitzRoy Road, Exeter, EX1 3PB, UK
4Max Planck Institute for Meteorology, Bundesstrasse 53, 20146 Hamburg, Germany 5ESA-ESRIN, 00044, Frascati, Italy
6Université catholique de Louvain, Earth and Life Institute, 1348 Louvain-la-Neuve, Belgium 7Brockmann-Consult GmbH, Max-Planck Str. 2, 21502 Geesthacht, Germany
8Laboratory of Geo-Information Science and Remote Sensing, Wageningen University, Droevendaalsesteeg 3,
Wageningen 6708 PB, the Netherlands
Correspondence to: B. Poulter (benjamin.poulter@montana.edu)
Received: 22 November 2014 – Published in Geosci. Model Dev. Discuss.: 21 January 2015 Revised: 27 June 2015 – Accepted: 30 June 2015 – Published: 31 July 2015
Abstract. Global land cover is a key variable in the earth
system with feedbacks on climate, biodiversity and natural resources. However, global land cover data sets presently fall short of user needs in providing detailed spatial and thematic information that is consistently mapped over time and eas-ily transferable to the requirements of earth system models. In 2009, the European Space Agency launched the Climate Change Initiative (CCI), with land cover (LC_CCI) as 1 of 13 essential climate variables targeted for research develop-ment. The LC_CCI was implemented in three phases: first responding to a survey of user needs; developing a global, moderate-resolution land cover data set for three time peri-ods, or epochs (2000, 2005, and 2010); and the last phase re-sulting in a user tool for converting land cover to plant func-tional type equivalents. Here we present the results of the LC_CCI project with a focus on the mapping approach used to convert the United Nations Land Cover Classification Sys-tem to plant functional types (PFTs). The translation was per-formed as part of consultative process among map producers and users, and resulted in an open-source conversion tool. A comparison with existing PFT maps used by three earth
sys-tem modeling teams shows significant differences between the LC_CCI PFT data set and those currently used in earth system models with likely consequences for modeling terres-trial biogeochemistry and land–atmosphere interactions. The main difference between the new LC_CCI product and PFT data sets used currently by three different dynamic global vegetation modeling teams is a reduction in high-latitude grassland cover, a reduction in tropical tree cover and an ex-pansion in temperate forest cover in Europe. The LC_CCI tool is flexible for users to modify land cover to PFT con-versions and will evolve as phase 2 of the European Space Agency CCI program continues.
1 Introduction
Terrestrial ecosystems are characterized by a wide variety of biomes covering arctic to tropical vegetation and extending over almost 150 million km2, about 30 % of the earth’s sur-face (Olson et al., 2001). Land sursur-face features associated with terrestrial ecosystems vary greatly across the earth due
to climate, soil and disturbance conditions. Some of these features, like leaf area index (LAI), surface roughness and albedo, exert a strong control on the exchange of biogeo-chemical fluxes, including carbon, water and nutrients, as well as energy fluxes between vegetation and the atmosphere (Bonan, 2008). These fluxes have an influence on multiple atmospheric processes that function over various temporal and spatial scales (Sellers et al., 1996). Because of the im-portance of land cover feedbacks on climate, a detailed and accurate description of global vegetation types and their pat-terns is thus a key component in dynamic global vegetation models (DGVMs) and earth system models (ESMs), with rel-evance for both weather and climate prediction. Presently, there are several global data sets of land cover available for modeling purposes, including MODIS-based land cover (Friedl et al., 2010), GLC2000 (Bartholome and Belward, 2005) and GLOBCOVER (Arino et al., 2008). However, the current generation of global land cover data sets provides lit-tle consistency in terms of time period of observations, spa-tial resolution, thematic resolution and accuracy standards. This presents various challenges for earth system modeling applications that require recent and consistent time series of land cover and particular thematic information regarding land cover categories (Giri et al., 2005; Herold et al., 2008; Neumann et al., 2007; Poulter et al., 2011; Wullschleger et al., 2014).
To address these challenges, the European Space Agency established the land cover component of the Climate Change Initiative (LC_CCI) and surveyed the land-surface modeling community to define user requirements for developing a new global land cover data set (Bontemps et al., 2012; Herold et al., 2011; Hollmann et al., 2013). The LC_CCI addressed these data needs by implementing an improved approach for mapping moderate-resolution global land cover consistently through time using surface reflectance from the MERIS and VEGETATION 1 and 2 sensors aboard ENVISAT and SPOT 4 and 5, respectively. The final LC_CCI product resulted in the development of three global land cover data sets, one for each of three epochs (1998–2002, 2003–2007 and 2008– 2012) using a spectral classification approach derived from that of GLOBCOVER (Arino et al., 2008), yet with im-proved algorithms (Radoux et al., 2014). More importantly, its implementation to multi-year and multi-sensor time se-ries ensured temporal consistency across epochs (Bontemps et al., 2012). The LC_CCI land cover maps depict the per-manent features of the land surface by providing informa-tion on land cover classes defined by the United Nainforma-tions Land Cover Classification System (UNLCCS). It also deliv-ers land surface seasonality products in response to the needs of the ESM and DGVM communities for dynamic informa-tion about land-surface processes (Bontemps et al., 2012). Land surface seasonality products provide for each pixel the climatology describing, on a weekly basis, seasonal dynam-ics of snow cover, vegetation “greenness” based on the nor-malized difference vegetation index and burned area. Of
par-ticular relevance to the needs of the ESM modeling com-munity, the LC_CCI developed a framework to convert the categorical land cover classes to the fractional area of plant functional types, available at various spatial scales relevant to the respective ESMs.
Plant functional types, or PFTs, are a key feature of current generation ESMs and represent groupings of plant species that share similar structural, phenological, and physiologi-cal traits, and can be further distinguished by climate zone (Bonan et al., 2002). Typically, 5–15 PFTs are included in an earth system model simulation (Table 1), including natu-ral and managed grasses with either C3 or C4 photosynthetic pathways, broadleaf or needleleaf trees with deciduous, ev-ergreen or “raingreen” phenology, and shrubs (Alton, 2011; Krinner et al., 2005; Sitch et al., 2003). The PFT concept was originally proposed as a non-phylogenetic classification sys-tem partly not only to reduce computational complexity of ESMs but also to maintain a feasible framework for hypoth-esis testing. For example, interpreting the outcome of inter-actions for 5–15 PFTs following a model simulation is much more tractable than interpreting interactions among the thou-sands of plant species found throughout the world. The PFT concept also provides a practical solution to the problem that many of the plant traits required to parameterize a model at a species level are difficult to obtain (Ustin and Gamon, 2010). Second-generation DGVMs are currently addressing some of the limitations posed by the PFT concept as plant trait data become more widely available (Kattge et al., 2011), as model structure becomes more computationally efficient (Fisher et al., 2010), or as modeling concepts move toward adaptive trait rather than “fixed” values (Pavlick et al., 2013; Scheiter and Higgins, 2009).
This paper describes the LC_CCI land cover classifica-tion and presents a conversion scheme that “cross-walks” the categorical UNLCCS land cover classes to their PFT frac-tional equivalent. This work is one of several LC_CCI pub-lications that have previously described the need for consis-tent land cover mapping (Bontemps et al., 2012), the user requirements (Tsendbazar et al., 2014) and the processing of remote sensing data (Radoux et al., 2014). Land cover to PFT conversion is a complex task and until the mapping of plant functional traits at global scale becomes possible (i.e., via “optical types”; Ustin and Gamon, 2010), the cross-walking approach remains a viable alternative for generating vegeta-tion requirements for ESM and DGVM modeling approaches (Bonan et al., 2002; Faroux et al., 2013; Gotangco Castillo et al., 2013; Jung et al., 2006; Lawrence et al., 2011; Lawrence and Chase, 2007; Poulter et al., 2011; Verant et al., 2004; Wullschleger et al., 2014). The LC_CCI conversion scheme described here provides users with a transparent methodol-ogy as well as the flexibility to modify the cross-walking ap-proach to fit the needs of their study region. The conversion scheme has been derived as part of a consultative process among experts involved in deriving the land cover map data and three ESM modeling groups as part of phase 1 of the
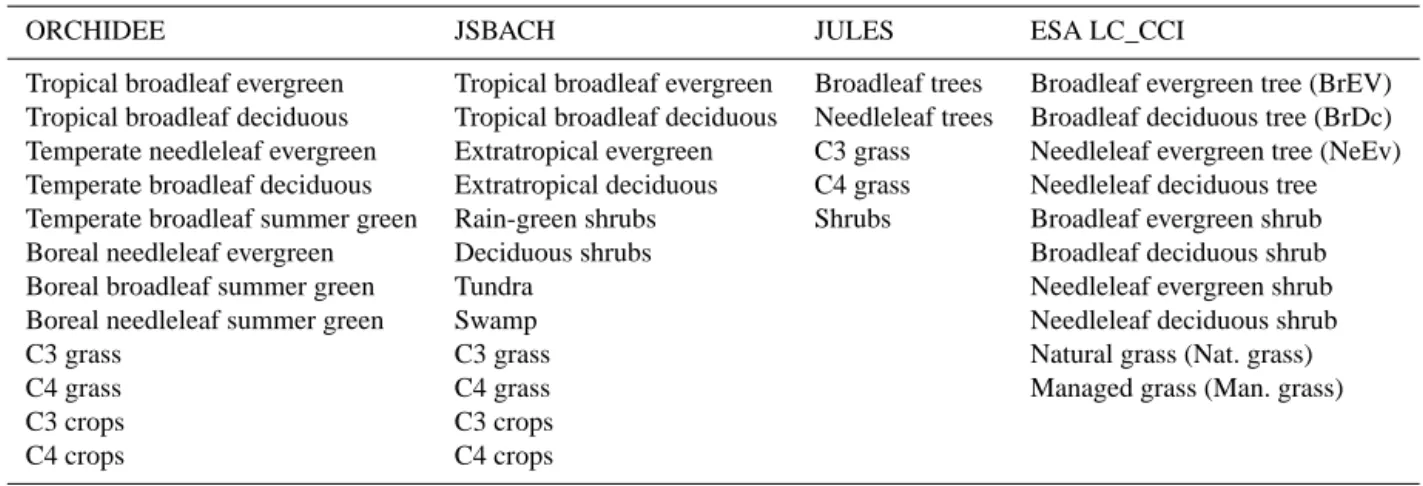
Table 1. Plant functional types used by three earth system models and mapped by the LC_CCI Initiative.
ORCHIDEE JSBACH JULES ESA LC_CCI
Tropical broadleaf evergreen Tropical broadleaf evergreen Broadleaf trees Broadleaf evergreen tree (BrEV)
Tropical broadleaf deciduous Tropical broadleaf deciduous Needleleaf trees Broadleaf deciduous tree (BrDc)
Temperate needleleaf evergreen Extratropical evergreen C3 grass Needleleaf evergreen tree (NeEv)
Temperate broadleaf deciduous Extratropical deciduous C4 grass Needleleaf deciduous tree
Temperate broadleaf summer green Rain-green shrubs Shrubs Broadleaf evergreen shrub
Boreal needleleaf evergreen Deciduous shrubs Broadleaf deciduous shrub
Boreal broadleaf summer green Tundra Needleleaf evergreen shrub
Boreal needleleaf summer green Swamp Needleleaf deciduous shrub
C3 grass C3 grass Natural grass (Nat. grass)
C4 grass C4 grass Managed grass (Man. grass)
C3 crops C3 crops
C4 crops C4 crops
project. With consensus for the thematic translation scheme, a conversion tool has been designed to spatially resample PFT fractions to various model grid formats common to the climate modeling community. The cross-walking table is ex-pected to be periodically updated by the LC_CCI team; i.e., phase 2 of LC_CCI began in 2014, and will be revised to include modifications and improvements related to the clas-sification scheme and mapping procedure.
2 Methods
2.1 LC_CCI land cover mapping scheme
The LC_CCI combined spectral data from 300 m full and 1000 m reduced resolution MERIS surface reflectance (and SPOT-VEGETATION for the pre-MERIS era) to classify land cover into 22 level 1 classes and 14 level 2 sub-classes following the UNLCCS legend (Di Gregorio and Jansen, 2000). The whole archive of full and reduced resolution MERIS data, 2003–2012, was first pre-processed in a se-ries of steps that include radiometric and geometric cor-rections, cloud screening and atmospheric correction with aerosol retrieval before being merged to 7-day compos-ites. An automated classification process, combining super-vised and unsupersuper-vised algorithms, was then applied to the full time series to serve as a baseline to derive land cover maps that were representative of three 5-year periods, re-ferred to as epochs, for 2000 (1998–2002), 2005 (2003– 2007) and 2010 (2008–2012). The classification process was achieved through back- and up-dating methods using the full-resolution SPOT-VEGETATION and MERIS time se-ries. The three global land cover maps described all the ter-restrial areas by 22 land cover classes explicitly defined by a set of classifiers according to the UNLCCS, each classifier referring to vegetation life form, leaf type and leaf longevity, flooding regime, non-vegetated cover types and artificial-ity. Inland open-water bodies and coastlines were mapped using wide-swath mode, image mode at medium-resolution
(150 m) and global monitoring image mode (1 km) acquired by the Advanced Synthetic Aperture Radar (ASAR) sensor aboard ENVISAT satellite for a single period (2005–2010).
In addition to the land cover classification, the land surface seasonality products describe, for 1 km2 rather than 300 m resolution, the average behavior and the inter-annual vari-ability of the seasonal normalized difference vegetation in-dex (NDVI), the burned area, and the snow occurrence, com-puted over the 1998–2012 period. These seasonality prod-ucts were spatially coherent with the land cover classifica-tion and were provided at weekly intervals averaged over this 15-year period and were based on existing indepen-dent products: SPOT-VEGETATION NDVI daily time se-ries, MODIS burned area (MCD64A1), and MODIS snow cover (MOD10A2). All products are provided to users in NetCDF and geotiff file format referenced to plate
car-rée projection using the World Geodetic System (WGS 84)
and are available at http://maps.elie.ucl.ac.be/CCI/viewer/. Detailed descriptions of each component in the process-ing chain can be found on the European Space Agency Land Cover Climate Change Initiative website: http://www. esa-landcover-cci.org.
2.2 Cross-walking land cover to PFTs
The conversion of land cover classes to PFTs is a non-trivial task that is made more complicated by the fact that the number and description of PFTs are not standardized across DGVMs. In the past, land cover (and other) infor-mation has been used to derive PFT maps based on indi-vidual model PFT descriptions. The method used to convert the land cover to PFTs has not always been documented in detail for each model. The aim of the approach taken here was to develop a general framework that could easily be adapted to the specific PFT description of any individual model. In consultation with the three climate modeling teams engaged in the LC_CCI project, Laboratoire des Sciences du Climat et de l’Environnement (LSCE), Met Office Hadley
T able 2. Def ault land co v er to plant functional type cross-w alking table pro vided by the con v ers ion tool with the 22 le v el 1 UNLCCS classes and 14 le v el 2 UNLCCS sub-classes in italics. The units are % co v erage of each PFT per UNLCCS class. LCCS UNLCCS Land Co v er Class Description T ree Shrub Grass Non-v egetated Class BrEv BrDc NeEv NeDe BrEv BrDc NeEv NeDe Nat. Grass Man. Grass Bare soil W ater Sno w/Ice 10 Cropland, rainfed 100 11 Herbaceous co v er 100 12 T ree or shrub co v er 50 50 20 Cropland, irrig ated or post-flooding 100 30 Mosaic cropland (> 50 %) nat. v eg. (tree, shrub, herb .) (< 50 %) 5 5 5 5 5 15 60 40 Mosaic nat. v eg. (tree, shrub, herb .) (> 50 %)/cropland (< 50 %) 5 5 7.5 10 7.5 25 40 50 T ree co v er , broadleaf, ev er green, closed to open (> 15 %) 90 5 5 60 T ree co v er , broadleaf, deciduous, closed to open (> 15 %) 70 15 15 61 T ree co v er , broadleaf, deciduous, closed (> 40 %) 70 15 15 62 T ree co v er , broadleaf, deciduous, open (15–40 %) 30 25 35 10 70 T ree co v er , needleleaf, ev er green, closed to open (> 15 %) 70 5 5 5 15 71 T ree co v er , needleleaf, ev er green, closed (> 40 %) 70 5 5 5 15 72 T ree co v er , needleleaf, ev er green, open (15–40 %) 30 5 5 30 30 80 T ree co v er , needleleaf, deciduous, closed to open (> 15 %) 70 5 5 5 15 81 T ree co v er , needleleaf, deciduous, closed (> 40 %) 70 5 5 5 15 82 T ree co v er , needleleaf, deciduous, open (15–40 %) 30 5 5 30 30 90 T ree co v er , mix ed leaf type (broadleaf and needleleaf) 30 20 10 5 5 5 15 10 100 Mosaic tree and shrub (> 50 %)/herbaceous co v er (< 50 %) 10 20 5 5 5 10 5 40 110 Mosaic herbaceous co v er (> 50 %)/tree and shrub (< 50 %) 5 10 5 5 10 5 60 120 Shrubland 20 20 20 20 20 121 Shrubland ev er green 30 30 20 20 122 Shrubland deciduous 60 20 20 130 Grassland 60 40 140 Lichens and mosses 60 40 150 Sparse v egetation (tree, shrub, herbaceous co v er) (< 15 %) 1 3 1 1 3 1 5 85 152 Sparse shrub (< 15 %) 2 6 2 5 85 153 Sparse herbaceous co v er (< 15 %) 15 85 160 T ree co v er , flooded, fresh or brackish w ater 30 30 20 20 170 T ree co v er , flooded, saline w ater 60 20 20 180 Shrub/herbaceous co v er , flooded, fresh/saline/brackish w ater 5 10 10 5 40 30 190 Urban areas 2.5 2.5 15 75 5 200 Bare areas 100 201 Consolidated bare areas 100 202 Unconsolidated bare areas 100 210 W ater bodies 100 220 Permanent sno w and ice 100
Centre (MOHC) and Max Planck Institute for Meteorology (MPI), 10 PFT groups were defined based on their phenology (needleleaf or broadleaf, evergreen or deciduous), physiog-nomy (tree, shrub, or grass) and grassland management status (natural or managed). Three additional non-PFT classes were added for bare soil, water and snow/ice. The cross-walking methodology is based on the approach of Poulter et al. (2011) and assumes that each UNLCCS category could be split into one or more PFT classes according to the LC class descrip-tion at the per pixel level (Table 2). For example, the “crop-land” UNLCCS land cover class was assigned as 100 % man-aged grass, whereas the UNLCCS “tree cover, needleleaf ev-ergreen, open (15–30 %)” class was assigned to 30 % leaf evergreen, 5 % broadleaf deciduous shrub, 5 % needle-leaf evergreen shrub and 15 % natural grass. Of note, wet tropical forest vegetation, mainly the UNLCCS class “tree cover, broadleaf evergreen, closed to open (> 15 %)”, was assigned to the PFT categories of “broadleaf evergreen” tree (90 %) and deciduous (5 %), evergreen shrub (5 %) following observations that moist tropical forests tend to have indeter-minate phenology rather than distinct periods of onset and offset (Borchert et al., 2002; Fontes et al., 1995; Reich and Borchert, 1984). The derivation of Table 2 was the result of consultative process among the producers of the land cover map and the three modeling groups that reached a consen-sus on the PFT fractions for each LCCS-defined land cover class. The aim of this process was to gain a fuller understand-ing of the methods behind, and implications of, the respective vegetation classifications (LC and PFT). For example, previ-ous LC class descriptions have included “semi-deciduprevi-ous” in the description of broadleaf evergreen trees, as in tropi-cal rainforests in particular, phenologitropi-cal strategies of cer-tain species result in more pronounced seasonal leaf dynam-ics. However, such subtle differences in functionality are not currently incorporated into DGVMs, and tropical rainforests are considered to be 100 % evergreen. Thus, in the cross-walking table derived in this study, the relevant LC class was mapped only as evergreen trees and shrubs (see LC class 50 in Table 2). Other issues that were discussed included how different vegetation types are treated within a grid cell for DGVMs and the lack of representation of over- and under-story canopies, which both had implications for how to deal with mosaic and open-cover classes.
For the most part, the cross-walking approach followed the definitions of the UNLCCS classes, where fixed propor-tions of land cover were split using a one-to-one rule for the respective PFT categories, as described above. In cases where the UNLCCS class was defined by a large range of tree cover and with no upper bound, i.e., “> 15 %” (Table 2), the uncertainties in this conversion can be considered larger than compared with other categories. In these cases, the land cover remote sensing team of experts provided the criteria for the conversion approach, taking into account their improved understanding of the constraints of DGVMs. The impact of these uncertainties on the final PFT fractions, and on the
sim-ulated variables, is beyond the scope of this study. Here we purely aim to properly document a new, generic method for mapping between LC classes and PFT fractions that can be used for all DGVMs. However, the issue of uncertainty in the cross-walking procedure is currently being investigated in phase 2 of the LC_CCI project.
2.3 The LC_CCI conversion tool
The LC_CCI land cover and seasonality products are ini-tially downloaded in full spatial resolution, i.e., 300 m grid cells for land cover, and 1 km grid cells for the seasonal-ity products, at global extent in plate carrée projection. In order to fulfill a range of ESM requirements, the LC_CCI project team developed the LC_CCI user tool to allow users to adjust parameters of the LC products in a way that is suit-able to their model setup, including modifying the spatial resolution and converting the LC_CCI classes to fractional PFT area. The BEAM Earth Observation Toolbox and De-velopment Platform, designed for visualization and analysis of ENVISAT products, was selected to provide the basis of the conversion software. A list of resampling resolution and coordinate system options is provided in Table 3. The co-ordinate re-projection and aggregation of the LC_CCI data uses slightly different resampling algorithms depending on whether the tool is used on the land cover or seasonality prod-ucts. The tool converts the original LC_CCI geotiff file to target files produced in NetCDF-4 format and following CF (Climate and Forecast) conventions, more commonly used in numerical modeling. The open-source BEAM tool (source code at https://github.com/bcdev) can be run independently using either Windows or Unix-based operating systems and the compiled operational tool can be downloaded from http: //maps.elie.ucl.ac.be/CCI/viewer/download.php.
2.4 Re-sampling algorithm for LC_CCI land cover
For the land cover classes, the resampling algorithm pro-duces an aggregated LC_CCI data set that in addition to the fractional area of each PFT, also includes the fractional area of each LC_CCI UNLCCS class, the majority (domi-nant) LC_CCI UNLCCS class and the overall accuracy of the aggregated classification. The majority class n is defined as the LC_CCI class which has the rank n for the sorted list of LC_CCI classes by fractional area in the target cell (see Fig. 1). The number of majority classes computed is a pa-rameter, which can be defined by the user, so that the full number of LCCS classes can be reduced to a user-defined subset, i.e., the top 3. Each original valid land, water, snow or ice pixel contributes to the final target cell according to its area percentage contribution. The accuracy is calculated by the median of the land cover classification probability values weighted by the fractional area.
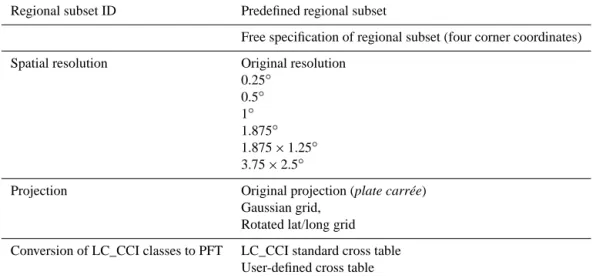
Table 3. Minimum set of projections and spatial resolutions included in the re-projection, aggregation, subset and conversion tool developed
by the LC_CCI project – LC_CCI user tool.
Regional subset ID Predefined regional subset
Free specification of regional subset (four corner coordinates)
Spatial resolution Original resolution
0.25◦ 0.5◦ 1◦ 1.875◦ 1.875 × 1.25◦ 3.75 × 2.5◦
Projection Original projection (plate carrée)
Gaussian grid, Rotated lat/long grid
Conversion of LC_CCI classes to PFT LC_CCI standard cross table
User-defined cross table
& & Area%& Majority)class)& class%a%& ~"8/16& 1& class%b%& ~"5/16"& 2"& class!c"& ~"2/16& 3"& class%d%& ~"1/16"& 4"&
Figure 1. Visualization of the pixel aggregation from the spatial
resolution of original LC_CCI map product into the user-defined spatial resolution of the aggregated LC_CCI map product.
2.5 Re-sampling algorithm for LC_CCI seasonality products
The aggregation of LC_CCI seasonality products is specific for NDVI (i.e., greenness), burned areas and snow cover. In the case of the LC_CCI NDVI condition, the mean NDVI over all valid NDVI observations is included in the aggre-gated product. The burned area and snow cover LC_CCI products also contain three different layers: the proportion of area (in %) covered by burned or snow area, the aver-age frequency of the burned area or snow area detected over the aggregated zone and the sum of all valid observations of
burned or snow area. Similar to aggregation rules for land cover, each original pixel contributes to the target cell ac-cording to its area percentage, but the value of a pixel will only be considered if its value falls within its valid range, i.e., zero to one for NDVI.
2.6 Extension to specific model needs
The LC_CCI tool provides users with a zero-order classifi-cation; that is, the PFT classes are defined as broadly as pos-sible so that users have the advantage to continue to aggre-gate to the requirements of their model (Fig. 2). For example, models that do not include shrub PFTs can merge shrub and tree categories together to create a single woody PFT cate-gory. Modeling groups that require climatic distinctions for PFTs; for example, temperate versus tropical versus boreal types can use their own climate or biome data sets, such as Köppen–Geiger or Trewartha ecological zones (Baker et al., 2010; Kottek et al., 2006; Peel et al., 2007), and define clas-sification rules based on temperature thresholds, for example (Poulter et al., 2011). Most models also require a distinction between the C3 and C4 photosynthetic pathways for differ-ent grass species, where C4 is more common in warm and dry climates (Edwards et al., 2010; Still et al., 2003). The photosynthetic biochemistry of C4 grasses is very different to C3 grasses and their distribution can be mapped either according to climate (Poulter et al., 2011) or to some com-bination of remote sensing, ground-based observations and ecosystem modeling (Still et al., 2003). The LC_CCI man-aged grassland PFT category represents all non-irrigated, ir-rigated and pasture lands, and therefore drawing finer the-matic distinctions between these must come from country or sub-country statistics similar to downscaling work made by Hurtt et al. (2006), Klein Goldewijck and Batjes (1997) and others (Monfreda et al., 2008; Ramankutty and Foley, 1998).
Figure 2. The LC_CCI land cover conversion tool processing chain
requires converting the thematic legend and resampling the grid res-olution to user defined PFT and coordinate system. Independent of the LC_CCI tool, users can append climate classes to the PFT ag-gregation.
2.7 Analysis and comparison to PFT maps
For analysis and demonstration of the tool, we compare the LC_CCI PFTs with the original PFTs used by the land sur-face model (LSM) components of the ESMs from the three modeling centers developing ORCHIDEE at LSCE (Krinner et al., 2005), JULES at MOHC (Clark et al., 2011; Cox et al., 2000; Pacifico et al., 2011), and JSBACH at MPI (Knorr, 2000; Pongratz et al., 2009; Reick et al., 2013). The origi-nal ORCHIDEE PFT map, based on 12 PFTs plus bare soil, has its origins in the Olson land cover data set from the 1980s (Olson et al., 1983) and the International Geosphere Biosphere Program (IGBP) DISCover data set for the pe-riod 1992–1993 (Loveland and Belward, 1997). This was implemented within ORCHIDEE using a look-up table ap-proach to estimate PFT fractions (Verant et al., 2004). The JULES model also uses PFT distributions derived from the IGBP DISCover data set to estimate fractional coverage of five PFTs and four non-vegetated surfaces (water, urban, snow/ice and bare soil). JSBACH uses original data from Wilson and Henderson-Sellers (1985) and continuous tree fractions from DeFries et al. (1999) to represent the distri-bution and abundance of 12 PFTs. The LC_CCI Epoch 2010 was converted to 0.5 degree resolution using the LC_CCI user tool and compared with the individual default model PFT maps to illustrate regional differences and biases be-tween products and to provide a baseline of how the LC_CCI products may improve LSM performance.
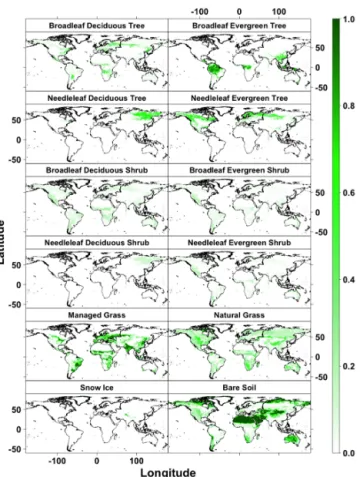
Figure 3. Fractional coverage of plant functional types, at 0.5◦ spa-tial resolution, calculated from original 300 m LC_CCI data set, epoch 2008–2012, using the LC_CCI conversion tool.
3 Results
3.1 Global summary of LC_CCI
The global land areas covered by the aggregated 0.5◦ LC_CCI PFT equivalents (Fig. 3) are dominated by barren and bare soil (39 Mkm2), followed by forests (30 Mkm2), managed grasslands, croplands and pasture (25 Mkm2), nat-ural grasslands (18 Mkm2), and shrublands (14 Mkm2). For comparison, the MODIS collection 5 land cover prod-uct developed by Friedl et al. (2010) covers barren area 18 Mkm2, forest and savanna at 49 Mkm2, a shrubland area of 22 Mkm2, and 12 Mkm2for croplands. With reference to the Food and Agriculture Organization (FAO) statistics, for-est area is reported as 38 Mkm2(FAO and JRC, 2012), crop-land area as approximately 15 Mkm2(Monfreda et al., 2008) and pasture lands of 28 Mkm2 (Ramankutty et al., 2008). While part of the areal differences are explained by the spa-tial resolution between the moderate-resolution MODIS data (500 m) in comparison to the 0.5◦ LC_CCI data, thematic differences introducing uncertainty in aggregating to forest, grassland, classes and factors stemming from different defi-nitions of forest cover thresholds are used to categorize
for-Figure 4. Global PFT coverage comparing the LC_CCI and original
data sets for (a) ORCHIDEE, (b) JULES and (c) JSBACH. Where “Br” is broadleaf, “Ne” is needleleaf, “Ev” is evergreen, “De” is de-ciduous, “ManGr” is managed grassland, “NatGr” is natural grass-land and “barren” includes bare soil or ice. Note JSBACH has no bare soil category.
est land between the UNLCCS approach (10 % cover) and the IGBP (60 %) approach used for MODIS. In addition, the UNLCCS to PFT conversion approach considers assump-tions related to plant community level variability, and so a bare soil fraction is introduced during the conversion (see Ta-ble 3) increasing its global area and partially explaining the difference with MODIS land cover.
3.2 Comparison with original PFT maps
Differences between the LC_CCI PFT data sets and the orig-inal PFT data sets were specific for each ESM (Fig. 4) largely because the original reference data were different per model-ing group. Another challenge was that different PFT classi-fication schemes were used for each model (Table 1), intro-ducing further aggregation uncertainties in the comparison between LC_CCI and the original PFT data.
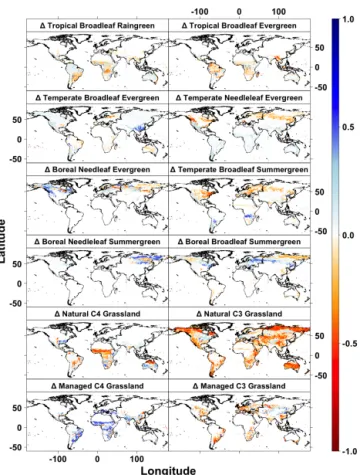
For all modeling teams, grassland PFT distributions showed the largest changes, with significant reductions in northern latitudes for ORCHIDEE and JULES (Fig. 6). For ORCHIDEE, the grassland PFT reductions were associated with an increase in bare soil, together with a shift from C3 grasses to (boreal) forest in the mid-to-high latitudes (Fig. 5). Agricultural PFTs, not included in JULES, were similar for the original ORCHIDEE and LC_CCI inputs at regional scales, but showed increases in tropical regions where de-forestation activities were high, e.g., the Brazilian arc of deforestation region. JSBACH generally had a reduction in cropland area, especially over North America and the North African arid regions.
Figure 5. Difference in fractional coverage between the LC_CCI
(epoch 2008–2012) and original ORCHIDEE PFT data set, based on Olson et al. (1983).
Over arid regions, in comparison to the original PFT map, JULES decreased in C4 grasses over Australia, with an asso-ciated increase in the fractional cover of shrubs and bare soil. In the Sahel, apparent differences in the definition of natural and managed C4 grass account for differences found between ORCHIDEE and JSBACH. The inclusion of the LC_CCI product resulted in a large increase in the C4 grass fraction over the Sahel in ORCHIDEE, whereas no significant change in the C4 grass fraction has been found over these areas for JSBACH. Instead, an increase in C4 crops was found over the Sahel for JSBACH. Since the JSBACH conversion also accounts for pasture, this difference may be well the result of the pasture definition, which is a weighted part of all herba-ceous PFTs. This also partly explains why the JSBACH C4 pasture PFT decreases exactly in the same areas where the C4 crops increase due to the use of the LC_CCI data. In JULES, the C4 types over Sahel shift to bare soil.
In the tropics, reductions in broadleaf tropical tree cover were largely consistent across all three ESMs, although in-creases in broadleaf forest area were found for some parts of the African Congo Basin for JULES (Fig. 6). Needleleaf for-est area increased compared to the reference data set for both JULES and JSBACH for boreal Europe and Australia
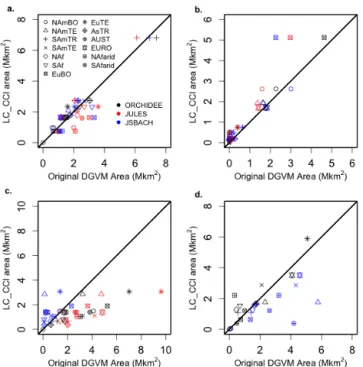
(shrub-Figure 6. Regional correlations between the original ESM PFT
coverage and the LC_CCI, epoch 2008–2012, coverage for
(a) broadleaf trees, (b) needleleaf trees, (c) natural grasslands and (d) managed grasslands. The regions follow the TRANSCOM
ex-periment biome boundary definitions, which partition terrestrial ecosystems into 13 regions of similar vegetation (see Appendix A).
land PFTs). The increase in needleleaf PFTs in boreal Eu-rope was partially associated with a decrease in broadleaves (Fig. 6a and b) for all three models, but also a decrease in natural grassland cover.
4 Discussion
4.1 Advantages of the LC_CCI for ESM modeling
The LC_CCI approach provides the ESM modeling commu-nity with a flexible tool for using up-to-date land cover in-formation consistently provided over time. Following the re-quests of the user survey, the land cover data set is available across multiple spatial domains, conforms to standard file formats used in numerical models, and includes information on classification confidence levels for the land cover classes and resulting PFT fractions. The standardized conversion tool provides users with a consistent documented approach for aggregating land cover classes and thus overcomes limi-tations associated with consensus approaches (e.g., Tuanmu and Jetz 2014). Of particular importance is that the multi-temporal LC_CCI mapping approach facilitated more accu-rate mapping leading to improved remote sensing observa-tions of deforested areas in the tropics, the tree line–tundra boundary in the high latitudes, and better distinctions be-tween managed and non-managed grasslands in Africa.
Ad-ditionally, the ASAR-based water bodies and coastline delin-eation helped to standardize the physical boundaries between terrestrial and water systems for all models. Using this stan-dardized PFT mapping approach for ESMs can be expected to reduce model ensemble uncertainty as attempted by recent inter-model comparison efforts (Huntzinger et al., 2013).
4.2 Opportunities for phase 2
During phase 1 of the LC_CCI project (2011–2014) several limitations of the conversion scheme and tool were recog-nized and have been targeted for improvement in phase 2, where improvements to the land cover thematic classes and to the conversion scheme will be made. For example, in the high latitudes, a reduction in grassland fractional cover was observed with the LC_CCI product for all models, and on further investigation, it was recognized that a better repre-sentation of lichens and moss vegetation (Class 140, Table 3) would be an improvement for the sparse vegetation category (Class 150), especially in the high latitudes. Conversion of high-latitude land cover classes to PFT equivalents has been a challenge in several recent regional studies (Ottlé et al., 2013; Wullschleger et al., 2014) where discriminating spectrally between shrubs and trees, or grass and non-vascular plant species, remains difficult. Accurate mapping of high-latitude vegetation can be particularly important for modeling wild-fires (Yue et al., 2014), where the spread of tundra fire is sensitive to fuel loading. In the tropics, the seasonal cycle of forest canopies continues to be a contentious issue (Morton et al., 2014; Myneni et al., 2007; Poulter and Cramer, 2009; Ryan et al., 2014) with the binary distinction between ever-green and deciduous phenology proving to be overly simplis-tic where semi-deciduous traits are perhaps more appropriate (Borchert et al., 2002), and thus the development of tropical phenology traits that correspond to recent observations is a high priority (Bi et al., 2015). More specifically, phase 2 will (i) target improved thematic accuracy with a specific focus on transition areas (e.g., grassland-sparse vegetation-bare soil, tree–shrub–grassland) and the distinction between C3 and C4 grasses, (ii) create a historical land cover time series to cover the 1990s using 1 km Advanced Very High Resolution Ra-diometer (AVHRR) NDVI surface reflectances, (iii) include more detailed change detection, with more classes, i.e., IPCC land categories (forests, agriculture, grassland, settlement, wetland, other land) as targets, and (iv) deliver an albedo and/or LAI seasonality product.
Physiological traits such as nitrogen fixation and differ-ent photosynthetic pathways, C3, C4 or crassulacean acid metabolism (CAM) are presently not detectable from sur-face reflectance values, and so broad climate-based tions must be made to split into these groups. These assump-tions can lead to large uncertainties that can impact a chain of ecosystem processes and land surface properties. While the LC_CCI data set provides updated information on in-land water bodies, the seasonality of water bodies and
wet-lands is yet to be represented and only considered in radar-based surveys (Schroeder et al., 2015). Finally, the existing 22 UNLCCS land cover classes currently do not include pas-tures, whereas the importance of grazing on biogeochemi-cal cycling is becoming increasingly recognized (Foley et al., 2005). Instead, pastures are currently mapped as croplands or grasslands according to their degree of management. Better thematic discrimination between these three classes would clearly improve the carbon cycle modeling as agriculture, in the broadest sense, is a significant contributor to land degra-dation and anthropogenic global greenhouse gas emissions (Haberl et al., 2007). Earth observation products are gen-erally limited to mapping land surface structural properties rather than functional properties, and model–data fusion ap-proaches can help reconcile problems that might arise from this limitation, especially in the case of grassland systems which may be managed or unmanaged, or may have differ-ent photosynthetic pathways. Nevertheless, remote sensing of land “management” categories remains a challenging task since existing classification approaches have yet to demon-strate an ability to capture the whole range of rangelands and crop diversity at global scale.
4.3 Earth system modeling challenges
Updating PFT data sets used in ESMs will clearly lead to improvements in the realism of the patterns of biogeogra-phy and have important feedbacks on simulating ecosystem processes and interactions with the atmosphere. Available PFT data sets used in ESMs remain outdated, using land cover information from the 1980s mainly because of a lack of tools available for cross-walking land cover to PFTs. The LC_CCI scheme and tool fills a critical data need for improv-ing the representation of carbon, water and energy cycles
be-ing developed by the modelbe-ing community; however, exten-sive model benchmarking and calibration activities may now be necessary before the new PFT data sets result in model improvement. For example, model processes may be cali-brated to some extent to produce performance metrics under outdated land cover information, and thus a range of bench-marks should be considered when transitioning to new PFT information.
5 Summary
The LC_CCI has made significant progress in responding to the ESM community data needs (Tsendbazar et al., 2014). These include
– new land cover classifications for three Epochs using
consistent algorithms and based on the UNLCCS sys-tem;
– a user-friendly tool for mapping the UNLCCS classes
into user-defined PFT classes and at most grid resolu-tions used by the ESM community;
– seasonality products describing average weekly
condi-tions for burned area, NDVI and snow cover;
– confidence information for each of the UNLCCS classes
and a median estimate for the converted PFT legend. The UNLCCS-PFT conversion tool and the land cover prod-ucts will continue to be improved during phase 2 of the LC_CCI with updates made periodically and described at http://www.esa-landcover-cci.org.
Appendix A
!
boreal North America temperate North America
tropical South America
temperate South America Australia
arid southern Africa southern Africa northern Africa North Africa semi-arid
Europe boreal Eurasia temperate Eurasia
tropical Asia
Figure A1. TRANSCOM experiment biome boundaries from Gurney et al. (2002). The codes from Fig. 6 are boreal North America
(NAmBO), temperate North America (NAmTE), tropical South America (SAmTR), temperate South America (SAmTE), northern Africa (NAf), southern Africa (SAf), boreal Eurasia (EuBO), temperate Eurasia (EuTE), tropical Asia (AsTR), Australia (AUST), Europe (EURO), arid North Africa (NAfarid), arid southern Africa (SAfarid).
Acknowledgements. The LC_CCI project was funded by the Euro-pean Space Agency Climate Change Initiative phase 1. The authors appreciate the support and comments from Frank Martin Seifert, Vasileos Kalogirou and Fabrizio Ramoino.
Edited by: A. Archibald
References
Alton, P. B.: How useful are plant functional types in global simula-tions of the carbon, water, and energy cycles?, J. Geophys. Res., 116, G01030, doi:10.1029/2010JG001430, 2011.
Arino, O., Bicheron, P., Achard, F., Latham, J., Witt, R., and Weber, J. L.: GLOBCOVER The most detailed portrait of Earth, ESA Bull.-Eur. Space, 136, 24–31, 2008.
Baker, B., Diaz, H., Hargrove, W., and Hoffman, F. M.: Use of the Köppen–Trewartha climate classification to evaluate climatic refugia in statistically derived ecoregions for the People’s Repub-lic of China, Climatic Change, 98, 113–131, 2010.
Bartholome, E. and Belward, A. S.: GLC2000: a new approach to global land cover mapping from Earth observation data, Int. J. Remote Sens., 26, 1959–1977, 2005.
Bi, J., Knyazikhin, Y., Choi, S., Park, T., Barichivich, J., Ciais, P., Fu, R., Ganguly, S., Hall, F., Hilker, T., Huete, A., Jones, M., Kimball, J., Lyapustin, A. I., Mõttus, M., Nemani, R. R., Piao, S., Poulter, B., Saleska, S. R., Saatchi, S. S., Xu, L., Zhou, L., and Myneni, R. B.: Sunlight mediated seasonality in canopy structure and photosynthetic activity of Amazonian rainforests, Environ. Res. Lett., 10, 064014, doi:10.1088/1748-9326/10/6/064014, 2015.
Bonan, G. B.: Forests and climate change: Forcings, feedbacks, and the climate benefits of forests, Science, 320, 1444–1449, 2008. Bonan, G. B., Levis, S., Kergoat, L., and Oleson, K. W.:
Land-scapes as patches of plant functional types: An integrating con-cept for climate and ecosystem models, Global Biogeochem. Cy., 16, 5.21–25.23, 2002.
Bontemps, S., Herold, M., Kooistra, L., van Groenestijn, A., Hart-ley, A., Arino, O., Moreau, I., and Defourny, P.: Revisiting land cover observation to address the needs of the climate model-ing community, Biogeosciences, 9, 2145–2157, doi:10.5194/bg-9-2145-2012, 2012.
Borchert, R., Rivera, G., and Hagnauer, W.: Modification of vege-tative phenology in a tropical semideciduous forest by abnormal drought and rain, Biotropica, 34, 381–393, 2002.
Clark, J. S., Bell, D. M., and Hersh, M.: Climate change vulnera-bility of forest biodiversity: climate and competition tracking of demographic rates, Global Change Biol., 17, 1834–1849, 2011. Cox, P. M., Betts, R. A., Jones, C. D., Spall, S. A., and Totterdell,
I. J.: Acceleration of global warming due to carbon-cycle feed-backs in a coupled climate model, Nature, 408, 184–187, 2000. DeFries, R., Townshend, J. R. G., and Hansen, M. C.: Continuous
fields of vegetation characteristics at the global scale at 1-km res-olution, J. Geophys. Res., 104, 911–916, 1999.
Di Gregorio, A. and Jansen, L.: Land Cover Classification System (LCCS): Classification Concepts And User Manual, Rome, Italy, 2000.
Edwards, E. J., Osborne, C. P., Stromberg, C. A. E., Smith, S. A., and Consortium, C. G.: The Origins of C4 Grasslands:
Integrat-ing Evolutionary and Ecosystem Science, Science, 328, 587– 591, 2010.
FAO and JRC: Global forest land-use change 1990–2005, Food and Agriculture Organization of the United Nations and European Commission Joint Research Centre, Rome, FAO, 2012. Faroux, S., Kaptué Tchuenté, A. T., Roujean, J.-L., Masson, V.,
Martin, E., and Le Moigne, P.: ECOCLIMAP-II/Europe: a twofold database of ecosystems and surface parameters at 1 km resolution based on satellite information for use in land surface, meteorological and climate models, Geosci. Model Dev., 6, 563– 582, doi:10.5194/gmd-6-563-2013, 2013.
Fisher, R. A., McDowell, N., Purves, D., Moorcroft, P., Sitch, S., Cox, P. M., Huntingford, C., Meir, P., and Woodward, F. I.: As-sessing uncertainties in a second-generation dynamic vegetation model caused by ecological scale limitations, New Phytol., 187, 666–681, 2010.
Foley, J. A., Defries, R., Asner, G. P., Barford, C., Bonon, G., Car-penter, S. R., Chapin, F. S., Coe, M. T., Daily, G. C., Gibbs, H. K., Helkowski, J. H., Holloway, T., Howard, E. A., Kucharik, C. J., Monfreda, C., Patz, J. A., Prentice, I. C., Ramankutty, N., and Snyder, P. K.: Global consequences of land use, Science, 309, 570–574, 2005.
Fontes, J., Gastellu-Etchegorry, J. P., Amram, O., and Fluzat, G.: A Global Phenological Model of the African Continent, Ambio, 24, 297–303, 1995.
Friedl, M. A., Sulla-Menashe, D., Tan, B., Schneider, A., Ra-mankutty, N., Sibley, A., and Huang, X.: MODIS Collection 5 Global Land Cover: Algorithm refinements and characterization of new datasets, Remote Sens. Environ., 114, 168–182, 2010. Giri, C., Zhu, Z., and Reed, B.: A comparative analysis of the Global
Land Cover 2000 and MODIS land cover data sets, Remote Sens. Environ., 94, 123–132, 2005.
Gotangco Castillo, C. K., Levis, S., and Thornton, P.: Evaluation of the New CNDV Option of the Community Land Model: Ef-fects of Dynamic Vegetation and Interactive Nitrogen on CLM4
Means and Variability∗, J. Climate, 25, 3702–3714, 2013.
Gurney, K. R., Law, R. M., Denning, A. S., Rayner, P., Baker, D., Bousquet, P., Bruhwiler, L., Chen, Y. H., Ciais, P., Fan, S. M., Fung, I. Y., Gloor, M., Heimann, M., Higuchi, N., John, J., Maki, T., Maksyutov, S., Masarie, K., Peylin, P., Prather, M., Pak, B. C., Randerson, J. T., Sarmiento, J., Taguchi, S., Takahashi, T., and
Yuen, C. W.: Towards robust regional estimates of CO2sources
and sinks using atmospheric transport models, Nature, 415, 626– 630, 2002.
Haberl, H., Erb, K. H., Krausmann, F., Gaube, V., Bondeau, A., Plutzar, C., Gingrich, S., Lucht, W., and Fischer-Kowalski, M.: Quantifying and mapping the human appropriation of net pri-mary production in earth’s terrestrial ecosystems, P. Natl. Acad. Sci., 104, 12942–12947, 2007.
Herold, M., Mayaux, P., Woodcock, C. E., Baccini, A., and Schmul-lius, C.: Some challenges in global land cover mapping: An as-sessment of agreement and accuracy in existing 1 km datasets, Remote Sens. Environ., 112, 2538–2556, 2008.
Herold, M., van Groenestijn, A., Kooistra, L., Kalogirou, V., and Arino, O.: User Requirements documents: Land Cover CCI, Université catholique de Louvain (UCL)-Geomatics, Louvain-la-Neuve, Belgium., 2011.
Hollmann, R., Merchant, C., Saunders, R., Downy, C., Buchwitz, M., Cazenave, A., Chuvieco, E., Defourny, P., de Leeuw, G.,
Forsberg, R., Holzer-Popp, T., Paul, F., Sandven, S., Sathyen-dranath, S., van Roozendael, M., and Wagner, W.: The ESA cli-mate change initiative: Satellite data records for essential clicli-mate variables, B. Am. Meteorol. Soc., 94, 1541–1552, 2013. Huntzinger, D. N., Schwalm, C., Michalak, A. M., Schaefer, K.,
King, A. W., Wei, Y., Jacobson, A., Liu, S., Cook, R. B., Post, W. M., Berthier, G., Hayes, D., Huang, M., Ito, A., Lei, H., Lu, C., Mao, J., Peng, C. H., Peng, S., Poulter, B., Riccuito, D., Shi, X., Tian, H., Wang, W., Zeng, N., Zhao, F., and Zhu, Q.: The North American Carbon Program Multi-Scale Synthesis and Terrestrial Model Intercomparison Project – Part 1: Overview and experimental design, Geosci. Model Dev., 6, 2121–2133, doi:10.5194/gmd-6-2121-2013, 2013.
Hurtt, G. C., Frolking, S., Fearon, M. G., Moore, B., Shevliakova, E., Malyshev, S., Pacala, S., and Houghton, R. A.: The underpin-nings of use history: three centuries of global gridded land-use transitions, wood-harvest activity, and resulting secondary lands, Glob. Change Biol., 12, 1208–1229, 2006.
Jung, M., Henkel, K., Herold, M., and Churkina, G.: Exploiting syn-ergies of global land cover products for carbon cycle modeling, Remote Sens. Environ., 101, 534–553, 2006.
Kattge, J., Diaz, S., Lavorel, S., Prentice, I. C., Leadley, P., Bönisch, G., Garnier, E., Westoby, M., Reich, P. B., Wright, I. J., Cornelis-sen, J. H. C., Violle, C., Harrison, S. P., Van Bodegom, P. M., Re-ichstein, M., Enquist, B. J., Soudzilovskaia, N. A., Ackerly, D. D., Anand, M., Atkin, O., Bahn, M., Baker, T. R., Baldocchi, D., Bekker, R., Blanco, C. C., Blonder, B., Bond, W. J., Bradstock, R., Bunker, D. E., Casanoves, F., Cavender-Bares, J., Chambers, J. Q., Chapin III, F. S., Chave, J., Coomes, D., Cornwell, W. K., Craine, J. M., Dobrin, B. H., Duarte, L., Durka, W., Elser, J., Esser, G., Estiarte, M., Fagan, W. F., Fang, J., Fernández-Méndez, F., Fidelis, A., Finegan, B., Flores, O., Ford, H., Frank, D., Freschet, G. T., Fyllas, N. M., Gallagher, R. V., Green, W. A., Gutierrez, A. G., Hickler, T., Higgins, S. I., Hodgson, J. G., Jalili, A., Jansen, S., Joly, C. A., Kerkhoff, A. J., Kirkup, D., Ki-tajima, K., Kleyer, M., Klotz, S., Knops, J. M. H., Kramer, K., Kühn, I., Kurokawa, H., Laughlin, D., Lee, T. D., Leishman, M., Lens, F., Lenz, T., Lewis, S. L., Lloyd, J., Llusià, J., Louault, F., Ma, S., Mahecha, M. D., Manning, P., Massad, T., Medlyn, B. E., Messier, J., Moles, A. T., Müller, S. C., Nadrowski, K., Naeem, S., Niinemets, Ü., Nöllert, S., Nüske, A., Ogaya, R., Oleksyn, J., Onipchenko, V. G., Onoda, Y., Ordoñez, J., Overbeck, G., Ozinga, W. A., Patiño, S., Paula, S., Pausas, J. G., Peñuelas, J., Phillips, O. L., Pillar, V., Poorter, H., Poorter, L., Poschlod, P., Prinzing, A., Proulx, R., Rammig, A., Reinsch, S., Reu, B., Sack, L., Salgado-Negret, B., Sardans, J., Shiodera, S., Shipley, B., Siefert, A., Sosinski, E., Soussana, J. F., Swaine, E., Swen-son, N., ThompSwen-son, K., Thornton, P., Waldram, M., Weiher, E., White, M., White, S., Wright, S. J., Yguel, B., Zaehle, S., Zanne, A. E., and Wirth, C.: TRY – a global database of plant traits, Global Change Biol., 17, 2905–2935, 2011.
Klein Goldewijk, K. and Batjes, J. J.: A hundred year (1890–1990) database for integrated environmental assessments (HYDE, ver-sion 1.1), Bilthoven, the Netherlands, 1997.
Knorr, W.: Annual and interannual CO2exchanges of the terrestrial
biosphere: process-based simulations and uncertainties, Global Ecol. Biogeogr., 9, 225–252, 2000.
Kottek, M., Grieser, J., Beck, C., Rudolf, B., and Rubel, F.: World Map of the Köppen-Geiger climate classification updated, Mete-orol. Z., 15, 259–263, 2006.
Krinner, G., Viovy, N., de Noblet-Ducoudré, N., Ogeé, J., Polcher, J., Friedlingstein, P., Ciais, P., Sitch, S., and Prentice, I. C.: A dynamic global vegetation model for studies of the cou-pled atmosphere-biosphere system, Global Biogeochem. Cy., 19, GB1015, doi:10.1029/2003GB002199, 2005.
Lawrence, D. M., Oleson, K. W., Flanner, M. G., Thornton, P. E., Swenson, S. C., Lawrence, P. J., Zeng, X., Yang, Z. L., Levis, S., Sakaguchi, K., Bonan, G. B., and Slater, A. G.: Parameterization Improvements and Functional and Struc-tural Advances in Version 4 of the Community Land Model, Journal of Advances in Modeling Earth Systems, 3, M03001, doi:10.1029/2011MS000045, 2011.
Lawrence, P. J. and Chase, T. N.: Representing a new MODIS con-sistent land surface in the Community Land Model (CLM 3.0): Part 1 Generating MODIS Consistent Land Surface Parameters, J. Geophys. Res., 112, G01023, doi:10.1029/2006JG000168, 2007.
Loveland, T. R. and Belward, A. S.: The IGBP-DIS global 1 km land cover data set, DISCover: First results, Int. J. Remote Sens., 18, 3289–3295, 1997.
Monfreda, C., Ramankutty, N., and Foley, J. A.: Farming the planet: 2. Geographic distribution of crop areas, yields, physiological types, and net primary production in the year 2000, Global Bio-geochem. Cy., 22, GB1022, doi:10.1029/2007GB002947, 2008. Morton, D. C., Nagol, J., Carabajal, C. C., Rosette, J., Palace, M., Cook, B. D., Vermote, E. F., Harding, D. J., and North, P. R. J.: Amazon forests maintain consistent canopy structure and green-ness during the dry season, Nature, 506, 221–224, 2014. Myneni, R. B., Yang, W., Nemani, R. R., Huete, A. R.,
Dickin-son, R. E., Knyazikhin, Y., Didan, K., Fu, R., Negron Juarez, R. I., Saatchi, S. S., Hashimoto, H., Shabanov, N. V., Tan, B., Ratana, P., Privette, J. L., Morisette, J. T., Vermote, E. F., Roy, D. P., Wolfe, R. E., Fiedl, M. A., Running, S. W., Votava, P., El-Saleous, N., Devadiga, S., Su, Y., and Salomonson, V. V.: Large seasonal swings in leaf area of Amazon rainforests, P. Natl. Acad. Sci. USA, 104, 4820–4823, 2007.
Neumann, K., Herold, M., Hartley, A., and Schmullius, C.: Compar-ative assessment of CORINE2000 and GLC2000: Spatial analy-sis of land cover data for Europe, Journal of Applied Earth Ob-servation and Geoinformation, 9, 425–437, 2007.
Olson, D. M., Dinerstein, E., Wikramanaye, E. D., Burgess, N. D., Powell, G. V. N., Underwood, E. C., D’Amico, J. A., Itoua, I., Strand, H. E., Morrison, J. C., Loucks, C. J., Allnutt, T. F., Rick-etts, T. H., Kura, Y., Lamoreux, J. F., Wettengel, W. W., Hedao, P., and Kassem, K. R.: Terrestrial ecoregions of the world: A new map of life on Earth, Bioscience, 51, 933–938, 2001.
Olson, J., Watts, J. A., and Allison, L. J.: Carbon in Live Vegetation of Major World Ecosystems, ORNL-5862, Oak Ridge National Laboratory, Oak Ridge, Tennessee, 164 pp., 1983.
Ottlé, C., Lescure, J., Maignan, F., Poulter, B., Wang, T., and Del-bart, N.: Use of various remote sensing land cover products for plant functional type mapping over Siberia, Earth Syst. Sci. Data, 5, 331–348, doi:10.5194/essd-5-331-2013, 2013.
Pacifico, F., Harrison, S. P., Jones, C. D., Arneth, A., Sitch, S., Wee-don, G. P., Barkley, M. P., Palmer, P. I., Serça, D., Potosnak, M., Fu, T.-M., Goldstein, A., Bai, J., and Schurgers, G.: Evaluation
of a photosynthesis-based biogenic isoprene emission scheme in JULES and simulation of isoprene emissions under present-day climate conditions, Atmos. Chem. Phys., 11, 4371–4389, doi:10.5194/acp-11-4371-2011, 2011.
Pavlick, R., Drewry, D. T., Bohn, K., Reu, B., and Kleidon, A.: The Jena Diversity-Dynamic Global Vegetation Model (JeDi-DGVM): a diverse approach to representing terrestrial biogeog-raphy and biogeochemistry based on plant functional trade-offs, Biogeosciences, 10, 4137–4177, doi:10.5194/bg-10-4137-2013, 2013.
Peel, M. C., Finlayson, B. L., and McMahon, T. A.: Updated world map of the Köppen-Geiger climate classification, Hydrol. Earth Syst. Sci., 11, 1633-1644, doi:10.5194/hess-11-1633-2007, 2007.
Pongratz, J., Reick, C. H., Raddutz, T., and Claussen, M.: Ef-fects of anthropogenic land cover change on the carbon cycle of the last millennium, Global Biogeochem. Cy., 23, GB4001, doi:10.1029/2009GB003488, 2009.
Poulter, B. and Cramer, W.: Satellite remote sensing of tropical for-est canopies and their seasonal dynamics, Int. J. Remote Sens., 30, 6575–6590, 2009.
Poulter, B., Ciais, P., Hodson, E., Lischke, H., Maignan, F., Plum-mer, S., and Zimmermann, N. E.: Plant functional type map-ping for earth system models, Geosci. Model Dev., 4, 993–1010, doi:10.5194/gmd-4-993-2011, 2011.
Radoux, J., Lemarche, C., Van Bogaert, E., Bontemps, S., Brock-mann, C., and Defourny, P.: Automated Training Sample Extrac-tion for Global Land Cover Mapping, Remote Sensing, 6, 3965– 3987, 2014.
Ramankutty, N. and Foley, J. A.: Characterizing patterns of global land use: An analysis of global croplands data, Global Bio-geochem. Cy., 12, 667–685, 1998.
Ramankutty, N., Evan, A. T., Monfreda, C., and Foley, J. A.: Farm-ing the planet: 1. Geographic distribution of global agricultural lands in the year 2000, Global Biogeochem. Cy., 22, GB1003, doi:10.1029/2007GB002952, 2008.
Reich, P. B. and Borchert, R.: Water stress and tree phenology in a tropical dry forest in the lowlands of Costa Rica, J. Ecol., 72, 61–74, 1984.
Reick, C. H., Raddatz, T., Brovkin, V., and Gayler, V.: Represen-tation of natural and anthropogenic land cover change in MPI-ESM, Journal of Advances in Modeling Earth Systems, 5, 1–24, 2013.
Ryan, C. M., Williams, M., Hill, T. C., Grace, J., and Woodhouse, I. H.: Assessing the phenology of southern tropical Africa: A com-parison of hemispherical photography, scatterometry, and opti-cal/NIR remote sensing, IEEE T. Geosci. Remote, 52, 519–528, 2014.
Scheiter, S. and Higgins, S. I.: Impacts of climate change on the vegetation of Africa: an adaptive dynamic vegetation modelling approach, Global Change Biol., 15, 2224–2246, 2009.
Schroeder, R., McDonald, K., Chan, S., Chapman, B., Podest, E., Bohn, T., Jones, L., Kimball, J., Zimmermann, R., and Küppers, M.: Development and evaluation of a multi-year global inundated area dataset derived from combined active/passive microwave re-mote sensing, in preparation, 2015.
Sellers, P., Randall, D. A., Collatz, G. J., Berry, J. A., Field, C. B., Dazlich, D., Zhang, C., Collelo, G. D., and Bounoua, L.: A revised land surface parameterization (SiB2) for atmospheric GCMs. Part I: Model formulation, J. Climate, 9, 676–705, 1996. Sitch, S., Smith, B., Prentice, I. C., Arneth, A., Bondeau, A., Cramer, W., Kaplan, J. O., Levis, S., Lucht, W., Sykes, M. T., Thonicke, K., and Venevsky, S.: Evaluation of ecosystem dy-namics, plant geography and terrestrial carbon cycling in the LPJ dynamic global vegetation model, Global Change Biol., 9, 161– 185, 2003.
Still, C. J., Berry, J. A., Collatz, G. J., and DeFries, R.: Global dis-tribution of C3 and C4 vegetation: Carbon cycle implications, Global Biogeochem. Cy., 17, 6.1–6.14, 2003.
Tsendbazar, N. E., de Bruin, S., and Herold, M.: Assessing global land cover reference datasets for different user communities, IS-PRS Journal of Photogrammetry and Remote Sensing, 103, 93– 114, 2014.
Tuanmu, M.-N. and Jetz, W.: A global 1-km consensus land-cover product for biodiversity and ecosystem modelling, Global Ecol. Biogeogr., 9, 1031–1045, 2014.
Ustin, S. L. and Gamon, J. A.: Remote sensing of plant functional types, New Phytol., 186, 795–816, 2010.
Verant, S., Laval, K., Polcher, J., and De Castro, M.: Sensitivity of the continental hydrological cycle to the spatial resolution over the Iberian Peninsula, J. Hydrometeorol., 5, 267–285, 2004. Wilson, M. F. and Henderson-Sellers, A.: A global archive of land
cover and soils data for use in general circulation climate models, J. Climatol., 5, 119–143, 1985.
Wullschleger, S. D., Epstein, H. E., Box, E. O., Euskirchen, E. S., Goswami, S., Iverson, C. M., Kattge, J., Norby, R. J., van Bode-gom, P. M., and Xu, X.: Plant functional types in Earth system models: past experiences and future directions for application of dynamic vegetation models in high-latitude ecosystems, Ann. Bot., 114, 1–16, 2014.
Yue, C., Ciais, P., Cadule, P., Thonicke, K., Archibald, S., Poul-ter, B., Hao, W. M., Hantson, S., Mouillot, F., Friedlingstein, P., Maignan, F., and Viovy, N.: Modelling the role of fires in the terrestrial carbon balance by incorporating SPITFIRE into the global vegetation model ORCHIDEE – Part 1: simulating histor-ical global burned area and fire regimes, Geosci. Model Dev., 7, 2747–2767, doi:10.5194/gmd-7-2747-2014, 2014.