HAL Id: halshs-00749639
https://halshs.archives-ouvertes.fr/halshs-00749639v3
Submitted on 2 Sep 2016
HAL is a multi-disciplinary open access archive for the deposit and dissemination of sci-entific research documents, whether they are pub-lished or not. The documents may come from teaching and research institutions in France or abroad, or from public or private research centers.
L’archive ouverte pluridisciplinaire HAL, est destinée au dépôt et à la diffusion de documents scientifiques de niveau recherche, publiés ou non, émanant des établissements d’enseignement et de recherche français ou étrangers, des laboratoires publics ou privés.
The polarization of global container flows by interoceanic
canals: geographic coverage and network vulnerability
César Ducruet
To cite this version:
César Ducruet. The polarization of global container flows by interoceanic canals: geographic cov-erage and network vulnerability. Maritime Policy and Management, Taylor & Francis (Rout-ledge), 2016, Maritime economics in a Post-Expansion Panama Canal Era, 43 (2), pp.242-260. �10.1080/03088839.2015.1022612�. �halshs-00749639v3�
1
The polarization of global container flows by interoceanic
canals: geographic coverage and network vulnerability
1Pre-final version of the article published in Maritime Policy and Management, 43(2): 242-260.
César DUCRUET2
French National Centre for Scientific Research (CNRS) UMR 8504 Géographie-cités
13 rue du Four, F-75006 Paris, France Tel. +0033(0)140464000 Fax. +0033(0)140464009
Abstract
It is widely acknowledged that the two major interoceanic canals of Suez and Panama play a central role in global shipping flows. However, this role has rarely been measured with precision both in terms of the geographic coverage and network topological properties of canal-dependent flows. Based on vessel movement data for containerships, this research clarifies the weight and share of canal-dependent flows globally and at the level of world regions, routes, and ports. It also estimates and maps the effects of removing canal-dependent flows from the network by means of graph-theoretical methods. While main results converge in showing a decreasing importance of canal shipping in the context of growing south-south trade exchanges, certain areas remain more dependent than others, such as Asia, Europe, and North America. The research also underlines factors of port vulnerability across the globe in relation with the two canals.
Keywords: cascading failures, complex networks, graph theory, maritime transport, Panama,
Suez,
1 An earlier version of this research was presented at the international conference on "Interoceanic Canals and
World Seaborne Trade: Past, Present, and Future" organized by the Royal Academy for Overseas Sciences, Brussels, June 7-8, 2012.
2
1. Introduction
The purpose of the Suez and Panama canals is to avoid a deviation from the main trading routes connecting the economic centers of the world: Europe, Asia, and North America. The Suez and Panama canals together account for approximately 13% of the world's seaborne trade, thus giving them high strategic importance. The share of Suez (8%) is slightly higher than Panama's (5%) (Notteboom and Rodrigue, 2011). Thus, those two canals are critical infrastructures that raise questions of transport security (Salter, 2007), especially since many studies have investigated the economic potential of alternative routes in light of the
congestion, cost, time, and piracy problems around the Suez and Panama canals (Verny and Grigentin, 2009; Fu et al., 2010; Liu and Kronbak, 2010; Notteboom, 2012).
However, a few studies have evaluated the implications of such vulnerability for canals, ports, and shipping networks. For instance, Berle et al. (2011) and Angeloudis et al. (2007) engage in a rich discussion of the failures of the maritime transportation system but without providing empirical evidence about the precise role of canals. In the research on network vulnerability and critical infrastructures, there are several studies of the worldwide energy supply including maritime elements (Rodrigue, 2004; Zavitsas and Bell, 2011), the Internet (Grubesic et al., 2008), the airline transport network (Derudder et al., 2007), and road networks (Jenelius et al., 2008). Early attempts to measure the centrality of interoceanic canals in the global maritime network were performed by Kaluza et al. (2010) and then by Ducruet and Notteboom (2012a) in their analysis of worldwide maritime container flows, thus hinting at the vulnerability of the network. Other works on maritime networks have avoided discussions of vulnerability, with the exception of Guerrero et al. (2008) who described supply chain disruption and vessel rerouting, and the Ducruet et al. (2010) who evaluated hub dependence as a measure of vulnerability for ports. Instead, other works on liner shipping networks focus on the topological structure of flows (Deng et al., 2009; Hu and Zhu, 2009). Other studies have examined the changing pattern of port calls in contexts such as North Korea's global maritime linkages (Ducruet, 2008), from which Figure 1 was adapted to offer evidence about the function of interoceanic canals. For North Korea, the level of traffic through such canals symbolizes the extent of its long-distance economic interactions (e.g. the Black Sea), which rapidly shrunk after the fall of the USSR in the early 1990s, and have never recovered because of the growing dependence upon neighboring transit hubs and trade
partners on Northeast Asia. Interoceanic canals are thus accurate markers of global trade and shipping activity.
3
[Insert Figure 1 about here]
This research presents original empirical evidence about the effects of interoceanic canals on the distribution of global maritime flows. It draws its inspiration from a range of methods and applications in network analysis. Its purpose is to measure and map the vulnerability of the global maritime network in relation to interoceanic canals at several geographic levels, from individual nodes to global sea routes. The case of container flows is explored with the
assistance of a global database of vessel movements in 1996 and 2006. After introducing the data and methodology, the first section describes the geographic coverage of the canals' influence on global vessel circulation and estimates their traffic weight in total container flows. The second section elaborates upon the topological importance of the canals and its evolution with regard to optimal network configurations and flow structures. A discussion of the local and global implications of the results follows in the last section which concludes the work and identifies additional pathways for future research.
2. Data and methodology
Vessel movements are reported by Lloyd's List on a daily basis. Extracting all movements of fully cellular container vessels in 1996 and 2006 allowed the construction of a port-to-port matrix that includes both Suez and Panama canals in addition to ports connected by those vessel calls. The resulting network is weighted by the sum of vessel capacities in TEUs (Twenty-Foot Equivalent Units) passing through links and nodes during a single year of movements, while it is kept undirected for the sake of simplicity. The analysis distinguishes two dimensions of the network: the adjacency matrix of chains and the adjacency matrix of complete graphs (see Appendix 1 for an illustration of network analytical methods). In the matrix of chains, ports are considered connected when a vessels makes a direct call between them in the course of its route. In that configuration, the matrix consists only of calls between adjacent ports. In the matrix of complete graphs, all ports connected by the same vessel are considered connected. It thus corresponds to the matrix of chains plus all calls between non-adjacent ports. Those two dimensions exhibit rather distinct topological properties in terms of network density and size (Ducruet and Notteboom, 2012a).
One first method has been to identify the trajectory of vessels passing through each and/or both canals defined by their full voyage within each year of observation. The analysis of freight circulations through trajectories rather than segments provides more accurate results as it catches the overall patterns of moving objects (Guo et al., 2010). This approach allows for
4
consideration of the geographic coverage of canal-dependent shipping and its weight in relation to world shipping. The share of canal-dependent traffic can be calculated at every port, range, and continent. The method can be applied not only to total traffic but also to intra- and interregional traffic.
Two drawbacks of the data and methodology merit mention, however. First, in some cases vessel movement data does not disclose the true origin and destination of containers. Because many containers are transshipped at intermediate hub ports, it is impossible to track each of them being embarked from one vessel to the other. Vessel movement data is thus not the same as trade data. Yet, all flows not passing through intermediate hub ports still have many
overlapping trading routes, while transit flows more faithfully reflect logistics systems and carrier decisions in designing their networks. Second, the same vessel and its capacity in TEUs are counted as many times as the number of its calls during the period considered. Depending on the case, this might overestimate the traffic intensity of some links at the expense of others, such as in the case of multiple calls within certain port ranges. The true number of containers handled at each port cannot be inferred from the data, as some port calls may only relate with bunkering, but this is impossible to verify. Nevertheless, and based on the same database, which accounts for 92% and 98% of the world fleet of such vessels in 1996 and 2006 respectively, the linear correlation with observed container port throughput figures obtained from Containerisation International is very high in both years (0.88). Port hierarchies measured via vessel movements thus closely overlap with those measured in more classic ways.
We use two complementary approaches to assess the vulnerability of the network. On the one hand, average eccentricity and average transitivity are calculated for the entire network before and after removing canals and canal-related circulations. Such measures indicate the extent to which canals influence the farness and connectedness of the network. We distinguished links having more than 50% of their traffic being canal-related from links carrying canal-related traffic. This allows comparison of the differences in link removal since some inter-port links (e.g. Le Havre - New York) carry both canal-related and other types of traffic. Eccentricity is a common measure of geodesic distance in graph theory and can be labeled Koenig number, Shimbel distance, and closeness centrality in the literature (Ducruet and Rodrigue, 2012). Each node corresponds to the number of links needed to reach the most distant node in the network. Averaging all local measures provides one single measure at network level ranging from 0 (nodes are distant from each other) to 1 (nodes are close to each other). Average eccentricity has been used in network vulnerability studies to measure the global impact of
5
node or link removal (Shimbel, 1953; Gleyze, 2005). Transitivity is a measure of
connectedness proposed by social network analysis (Wasserman and Faust, 1994) and labeled clustering coefficient in the literature on complex networks. It corresponds to the probability that the adjacent neighbors of a given node are also connected: the number of triangles (or triplets) is divided by the number of possible triangles (or triplets), thus ranging from 0 (no triangles) to 1 (all triangles). Low values often correspond to nodes having dominant
functions while their immediate neighbors are poorly connected (cf. hub-and-spoke pattern) while high values depict tightly connected and more homogenous patterns. With reference to studies of cascading failures in networks, we also compare the effects of canal removal on the centrality of individual ports (Albert et al., 2004; Gorman et al., 2004; Wang and Rong, 2009).
At the same time, the optimal or maximum capacity route is extracted from the original network using the minimum spanning tree algorithm proposed by Kruskal (1956). The latter method belongs to a family of studies on the search for the optimal or shortest path on the level of the entire network (see also Roy, 1959; Warshall, 1962; Floyd, 1962; Johnson, 1977) and/or for a given node or link in the network (Bellman, 1958; Dijkstra, 1959; Ford and Fulkerson, 1962). The Kruskal algorithm is chosen for its simplicity and because it has remained a generally accepted reference in graph theory. We apply the algorithm to the inverse of traffic weight (TEUs) by link in order to extract the maximal weight spanning tree, (i.e. the optimal route connecting all ports and carrying the maximum traffic volume). Based on this simplification of the network, we measure for each node its Strähler stream order (i.e. level of ramification) to reveal the branching property of ports and canals in the optimal route, as well as its degree centrality (i.e. number of adjacent neighbors). The Strähler index is well adapted to tree-like networks and has been used extensively in the case of river networks (see Haggett and Chorley, 1969; Taaffe and Gauthier, 1973).
3. Geographic coverage of canal-dependent flows
Globally, the share of canal-dependent flows in total container flows was calculated on the basis of direct and indirect vessel calls between ports (Table 1). Results first confirm the high share of canal-dependent flows at both years (i.e. over 40%) which is much higher than available estimates for all commodity traffic. However, this combined share has noticeably dropped between 1996 and 2006 from 44.2% to 40.7%. This reduction stems from several factors such as the emergence of alternative routes (e.g. Cape of Good Hope) in response to vessel size limitations and passage costs. The combined share of the two canals is slightly
6
lower than the sum of their individual importance since some vessels have used both canals during their line-bundling and round-the-world services (Ducruet and Notteboom, 2012b). This confirms that true round-the-world services account for a very small percentage of global container flows (i.e. 6.8% in 1996 and 3.4% in 2006) since most liner services occur through pendulum routes between two main poles (Frémont, 2007). Yet, the combined share of the two canals in total interregional traffic has remained stable at around 64%. The drop is thus explained mostly by a reduction of canal's weight in intraregional flows. The main
explanation pertains to the reinforced concentration of flows within certain regions around intermediate hub ports ensuring either (or both) interlining and hub-feeder functions (Rodrigue and Notteboom, 2010). This means that vessels using the canals have tended to limit the number of calls within regions, notably large vessels selecting a few dominant hub ports along the route. Another factor is the growth of transshipment across the Panamanian peninsula due to the physical limitations of the canal. Suez's share is higher than Panama's in all aspects, since the Europe-Asia route accounts for the majority of world container flows (27.7 million TEUs in 2007), followed by the Asia-USA route (20.3 million TEUs) and the Europe-USA route (7.2 million TEUs) (Containerisation International). The drop is relatively equal at the two canals except for interregional traffic where the Panama Canal share has decreased more than the Suez Canal's. This is consistent with the higher technical limitations of the Panama Canal in terms of vessel size, but it is not offset by an increase in its
intraregional function.
[Insert Table 1 about here]
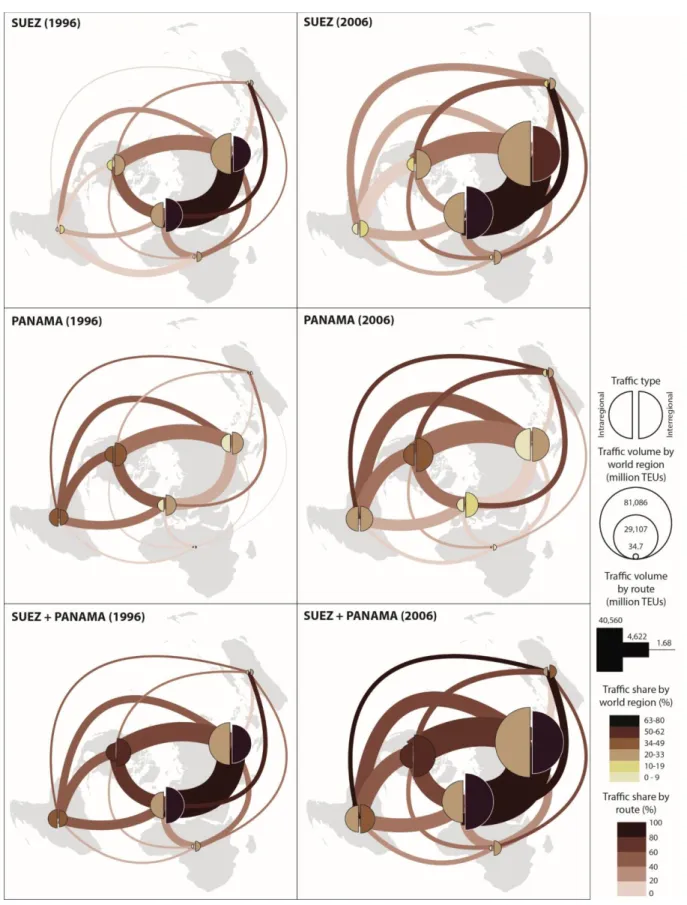
Another approach is to measure the weight of canal-dependent flows by geographic entity at the world region and port levels. Among world regions (figure 2), the largest economic poles of the world are the most dependent upon the canals, but this dependence depends upon the level of flows (intra or interregional) and to the canal itself. In both years, North America is the most canal-dependent region and this has increased from 55% to 58% during the period for all flows. One reason has been the growth of all water services from Asia to the US East Coast, at the expense of landbridge services and favoring ports such as Savannah (see also Appendix 2). Indeed, the share of Panama canal on the Northeast Asia-US East Coast route has grown steadily from 11.3% in 1999 to 43% in 2007 (Rodrigue, 2010). It is followed by Europe but its canal-dependence dropped slightly from 51% to 49%. Asia and Latin America exhibit similar levels of dependence and their share has also dropped from 42% to 36%.
7
While Africa's dependence remains stable at the lowest level (20%), Oceania has witnessed the highest increase, from 17% in 1996 to 29% in 2006. A complementary picture is obtained when distinguishing interregional from intraregional flows. In fact, Europe and Asia are the most canal-dependent regions since about 75% of their external traffic relies on the canals, and this share has remained stable between 1996 and 2006. Their drop in canal-dependence thus better reflects the decrease of intraregional canal-related flows because of the growth of transshipment at intermediate hub ports, such as in the Mediterranean and South East Asian ranges. In comparison, North America's canal-dependence is lower externally and higher internally (inter-coastal flows), but both shares have increased significantly, amounting to 59% of interregional flows and 54% of intraregional flows in 2006. The growing dependence upon canals (here Panama) might be explained by congestion at West Coast ports, making land bridge connections less beneficial to shippers than canal shipping (Hall, 2004). Latin America has a lower canal-dependence than North America but both interregional (-3%) and intraregional (-8%) canal-dependence have decreased, which indicates a diversification of its connections.
The distribution of canal-dependent flows among major shipping routes underlines, predictably, the central role of Suez Canal for Europe-Asia traffic (95%), the rest being shipped via the Cape route. It is the largest and most canal-dependent traffic segment. The Europe-Oceania route also passes through Suez, although one-third of the traffic uses the Panama Canal instead.
[Insert Figure 2 about here]
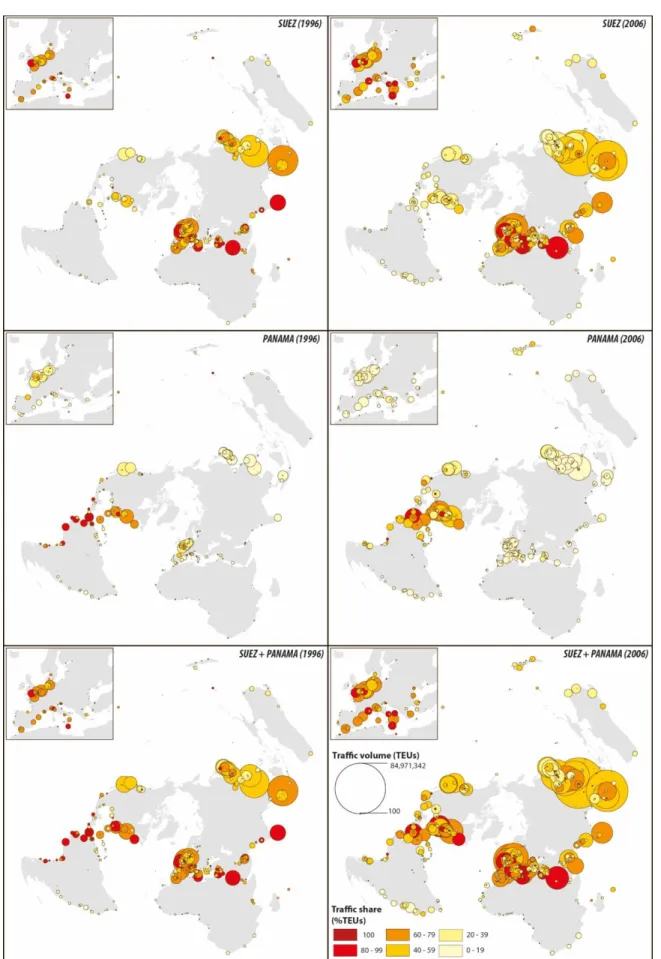
The analysis at port level allows for a clearer observation of trafficmpacts (Figure 3). The combined traffic of the two canals is distributed along the circumterrestrial route linking the three main economic poles. A noticeable number of ports appears highly vulnerable in the pattern of flows since a dominant share of their traffic is transported through the canals. The distribution of vulnerability rests upon a subtle combination of distance and scale: on the one hand proximity to the canals fosters traffic, and on the other, larger hubs and gateways, often despite distance to the canals, generate high volumes and shares of canal-related traffic. In general, Asian ports appear to be less dependent on canals than their European and North American counterparts, probably as a result of their higher levels of intra-regional traffic. Indeed, transpacific trades have more options to enter the North American continent than does the Europe-Asia trade, which has to alternative to using the Suez Canal. In addition, new
8
Pacific gateways have been planned to connect long-distance rail corridors to bypass the Panama Canal, such as Lazaro Cardenas (Mexico) and Prince Ruppert (Canada). The
vulnerability is thus much localized in certain areas: the U.S. Northeastern seaboard (Panama traffic) and a number of West European ports (Suez traffic) such as Southampton and Gioia Tauro at both years. The Panama Canal that is often seen as a key node for Asia-North America trades has in fact relatively little importance for Asian ports. The share of Suez traffic at Asian ports has notably decreased for Singapore and for several Northeast Asian ports. Thus, there is a combination of liner service reconfiguration and trade reorientation in the changing geographic coverage of canal traffic. Appendix 2 lists the top 30 ports based on canal-dependent traffic.
[Insert Figure 3 about here]
4. Topological impacts of interoceanic canals
4.1 Canal removal and cascading failures
Average eccentricity and transitivity were calculated at both years on the network level before and after removing partly and fully each or both canal's circulations, while comparing effects for the two dimensions, chains and complete graphs (Table 2). In the matrix of chains, results from 1996 confirm the crucial role of canals in bringing world ports closer, as eccentricity decreases after removals compared with the original value (0.765). The combined effect of the two canals is not clearly visible since it is equal to Suez deletion impacts (for largest flows) and inferior to the Suez deletion impacts (for all flows). The largest difference in eccentricity is observed for the Suez Canal (0.674); removing the Panama Canal's links and flows does not have much influence upon the network's structure. This confirms previous results where the geographic coverage of Panama Canal's flows remained much narrower than that of the Suez Canal. In 2006, the original eccentricity is significantly lower than in 1996 (0.644), which in itself indicates a dramatic increase in the size and geographic coverage of the liner shipping network (Ducruet and Notteboom, 2012a), thus increasing the distance between ports. One notable difference with 1996 is that removing canal-related circulations, either individually or in combination, increases the eccentricity thus bringing the ports closer to each other. This counterintuitive result can be explained in light of crucial trends occurring along the period. In 1996, remote regions remain poorly connected so that the role of the canals is central and there are few bypasses. The progression of South-South flows between Latin America, Africa,
9
and Asia-Pacific as well as the relatively stagnant share of the canals in total flows (from 50 to 56%) have resulted in a less sparse network. Removing canal-related circulations thus reveals the strength of those new transversal linkages among world economies. This is why the Suez Canal has the highest impact on making ports closer: Asia and Europe are closer outside the Suez canal when considering the expanding links between Asia, Africa, and Latin America, the two latter being still well connected with Europe. The role of canals in an era of growing South-South trade appears more as a bottleneck than a facilitator of exchanges. In the matrix of complete graphs, the impact of canal removal is similar to the latter
dimension. Transitivity increases as more canal-dependent circulations are removed, while the impact is more pronounced for Suez Canal and combined canals. As with chains, the effects are larger in 2006 than in 1996 because of the increasing centralization of the network around hub ports. Eccentricity always increases along with canal removal, because complete graphs allow for the existence of many alternative paths outside the canal nodes. Thus, removing canal-dependent circulations brings ports closer to each other than dismantling the network's structure would. In terms of transitivity, the same trend is observed in 1996 and 2006: the increasing polarization of the network after the removal of canal-related circulations.
[Insert Table 2 about here]
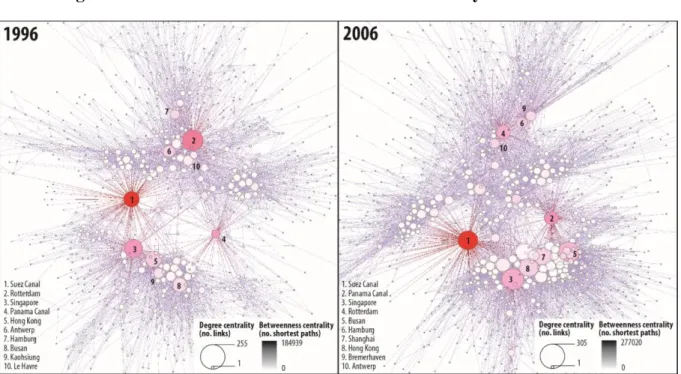
Before looking at the effects of removal on ports, it is necessary to evaluate the extent to which the two canals centrally located in terms of network topology compare with other nodes (Figure 4). In the global network, the two canals clearly appear at both years as two central nodes in the global system, as connectors between a Euromediterranean-Atlantic group and an Asia-Pacific group, alongside very limited flows between the two. Each group at both years is polarized by few large ports, based on betweenness centrality scores. Rotterdam and Singapore are the most central ports of the group to which they belong, followed by Antwerp, Hamburg, Hong Kong, and Busan, in that order. In 2006, Bremerhaven and Shanghai emerge as complementary hubs, while there is a noticeable shrinkage in the centrality of European gateways in 2006. In addition, more links seem to connect the two main components while circumventing the canals. Nevertheless and although it has fewer links than major seaports, the Suez Canal is by far most central node of the global network in both years.
10
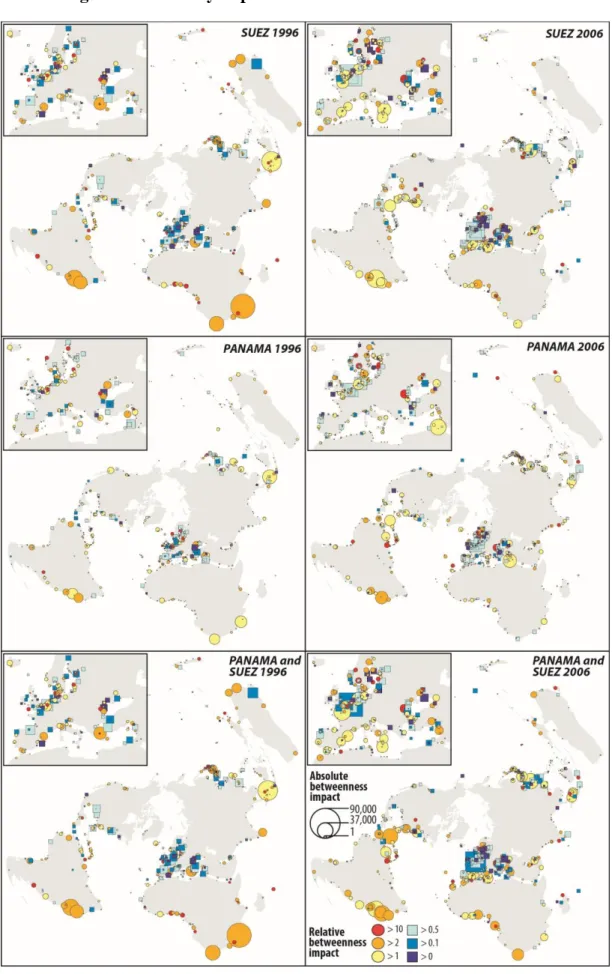
Because betweenness centrality more accurately expresses the global situation of port nodes in relation to other nodes, the analysis of removal impacts was applied to this measure for the matrix of chains. For each year, each canal with its related links was individually and jointly removed. Betweenness centrality scores were compared before and after removal in both absolute (difference between new and former centrality) and relative (ratio between new and former centrality) ways and mapped in order to verify the geographic coverage of such
impacts (Figures 5a and 5b). With few exceptions, European ports had larger negative impacts than other ports, regardless of the canal and year under consideration. Europe thus appears much vulnerable in the network, in light of its longstanding centralization of world trade flows. As Europe's largest gateway, Rotterdam has the strongest negative impact on each map, except for 1996, when the Panama Canal was removed. Positive impacts of canal removal are more pronounced in the southern hemisphere such as around Brazil, South Africa, and the Malacca Straits with Singapore. The removal of both canals does not drastically modify the distribution of impacts from individual removals. Results, however, vary greatly within each region and may vary according to the canal and change over time. One major difference between 1996 and 2006 is the location of the highest absolute gain, which has shifted from South Africa (e.g. Durban, Cape Town) to Brazil (e.g. Santos, Rio de Janeiro). Another noticeable difference is that several major North American ports which felt negative impacts in 1996 had positive impacts in 2006 (e.g. New York, Houston, and
Kingston, Jamaica). Such changes are certainly interdependent, given the growing trade and shipping integration between North and South America (Guy, 2003).
Another factor is the growth and geographic diversification of Asia's trade networks and the "China effect" to the extent that many flows have rapidly expanded towards southern Atlantic ports, circumventing Suez and even South Africa, based on increased frequency and capacity of vessel trips between China and Brazil, for instance. This also confirms that Latin America's East Coast ports barely use the Panama Canal (Figure 3) Over the same period, Africa has almost entirely shifted its principal maritime links towards Asia (Ducruet and Notteboom, 2012a), which explains the centrality gains of Shanghai and several West African ports in 2006. Positive effects are also observed at certain ports having important transshipment functions locally, because of their dominance in neighboring secondary ports, such as
Colombo and Piraeus in 1996 (but not in 2006), Marsaxlokk and Gioia Tauro in 2006 (but not in 1996). However and despite its strong transshipment activity towards Japan and North China, Busan was negatively affected by removals, especially Suez, although in 2006, the
11
impact was positive for Panama and both canals. Lastly, another important difference between 1996 and 2006 is the reversed mutual effects between the canals themselves, as Panama benefitted from Suez removal in 1996 but not in 2006, and vice versa.
[Insert Figures 5a and 5b about here]
4.2 Optimal routes and ramifications
After extracting the optimal route from the original matrix, we map the centrality and ramification level of ports and canals using a Gem-Frick visualization algorithm (Figure 6). The design of the optimal route confirms the presence of two large subsystems or sub-trees, each polarized by Rotterdam and Singapore, which have the largest number of adjacent neighbours (degree) and a high level of ramification (Strähler). In 1996, the Suez Canal has the highest ramification level as it stands, with Djibouti, Reunion, and Aden at the source of the global tree. The centre of gravity of the global maritime system was thus clearly around the Suez Canal but it shifted to other locations in 2006. Singapore in addition to several Latin American ports (e.g. Vitoria, Santos, Paranagua, Port of Spain, Kingston), took over Suez Canal at the source of the optimal route. This corroborates previous results since Asian traffic has penetrated the Atlantic through direct calls bypassing the Suez Canal (i.e. around the Cape of Good Hope). Many African ports have shifted under Asian influence due to the rapid development of Asian Foreign Direct Investment (FDI) in Africa (Chaponnière, 2010). Emerging economies such as Brazil have generated increasing volumes of flows linking not only Asia but also traditional partners such as Europe and the U.S. (see also Guy, 2003), thus becoming a new gravity centre for global shipping. Notably, the interlining function of Algeciras that appeared in 1996 for connecting East-West and North-South flows was considerably reduced in 2006 since Durban in South Africa appears as a new relay hub between West Africa and Asia. Taken together, we observe a significant shrinkage of
Rotterdam's influence in the network as an effect of these factors. The sub-network, including New York, Houston, Casablanca, and a number of Atlantic European ports was connected to Hong Kong via the Brazilian port of Itajai in 2006. Although the method has removed many links that connect ports in more complex ways, the resulting pattern is by no means revelatory of profound changes in network configurations.
12
The same method applied to the matrix of complete graphs provides complementary results although many indirect and long-distance links between ports such as Rotterdam-Tokyo would not have existed without canals. Due to the many alternatives in this dimension of the network, canals appear to have had a minor role in both years on the optimal route. Interesting configurations and evolutions are, nevertheless, observable. In 1996, European ports are clearly dominant in both centrality and ramification, as are Asian ports that appear more peripheral. In 2006, it is the opposite: Asian ports dominate the optimal route while European (and other) ports are relegated to the semi-periphery.
Conclusion
The application of several network analytical methods to the global matrix of inter-port vessel movements offers many insights into the changing role of canals and ports in liner shipping flows. As such, it informs us about the ways on which shipping networks both reflect and shape the world economy and its components (Ullman, 1949; Vigarié, 1968). As a
complement to studies of network vulnerability, this research provides evidence of the distribution of canal-related flows and their wider significance for ports and shipping. After providing a novel estimation of the importance of canal traffic in global container flows, the research revealed the uneven geographic coverage of the canal's influence at different levels of analysis. While canal traffic concentrates at the vicinity of those major infrastructures, it reveals the higher vulnerability of the "old Atlantic world" compared with emerging countries such as in the Asia-Pacific and South Atlantic regions. Canals' role in global shipping has thus declined during the period under study (1996-2006) as an effect of growing South-South trades and Asia's expansion across the Cape of Good Hope. Former structures, such as
Rotterdam's prominence as the main hub of Europe-Atlantic networks, are thus losing ground, since Latin American ports have assumed a new role in network interlining. Yet, there is a permanency of a bipolarization of the world organized by Singapore and Rotterdam, which remain the main pivotal nodes, but Rotterdam and Europe as a whole appear much more vulnerable than any other port.
Further research shall test the continuity of such trends by applying these methods to other commodity types (e.g. bulk, general cargo) and to more recent data, as a means taking into account, too, the likely impacts of the 2008 global financial crisis and of the development of slow steaming, on network configurations, in addition to the future effects of the expansion of the Panama Canal. Based on these results, such expansion might have three combined effects: balancing the overarching polarization of global container flows by the Suez Canal,
13
reinforcing the already high canal-dependence of North American ports, and providing more alternatives to European ports to connect Asia. What it might not change, however, is the rapid and ongoing integration among emerging economic powers, such as China, Brazil, but also in Africa, through South-South shipping networks. Current and future patterns will also benefit from their comparison with the geo-historical evolution of worldwide maritime flows based on same sources (see Ducruet, 2013) but also local data about the origin and destination of vessels passing through the canals since their opening. The way traffic is counted by port, link, and region may also be done less uniformly, for instance by adapting vessel traffic figures to actual container port throughputs in order to reduce the influence of transhipment. Modelling and simulation methods could, in addition, predict the likely effects of opening new shipping routes and of canal disruption or expansion.
[Insert Appendices 1 and 2 about here]
Acknowledgements
The author would like to thank Mrs. Liliane Lizzi at Géographie-Cités for her support on cartography. The research leading to these results has received funding from the European Research Council under the European Union's Seventh Framework Programme (FP/2007-2013) / ERC Grant Agreement n. [313847] "World Seastems".
References
Albert, Reka, Istvan Albert, and Gary L. Nakarado. 2004. "Structural vulnerability of the North American power grid." Physical Review E 69 (2): 1–4.
Angeloudis Panagiotis, Khalid Bichou, and Michael G.H. Bell. 2007. "Security and reliability of the liner container-shipping network: analysis of robustness using a complex network framework." In Risk Management in Port Operations, Logistics and Supply Chain Security, edited by Khalid Bichou, Michael G.H. Bell, and Andrew Evans, 95–106. London: Informa. Bellman, Richard. 1958. "On a routing problem." Quarterly of Applied Mathematics 16 (1): 87–90.
Berle, Øyvind, James B. Rice Jr., and Bjørn Egil Asbjornslett. 2011. "Failure modes in the maritime transportation system: A functional approach to throughput vulnerability." Maritime
14
Chaponnière, Jean-Raphaël. 2010. "Le basculement de l'Afrique vers l'Asie : enjeux pour les ports africains." Afrique Contemporaine 234 (2): 25–40.
Deng, Wei-Bing, Guo Long, Li Wei, and Cai Xu. 2009. "Worldwide marine transportation network: Efficiency and container throughput." Chinese Physics Letters 26 (11): 118901. Derudder, Ben, Lomme Devriendt, and Frank Witlox. 2007. "Flying where you don't want to go: An empirical analysis of hubs in the global airline network." Tijdschrift voor Economische
en Sociale Geografie 98 (3): 307–324.
Dijkstra, Edsger W. 1959. "A note on two problems in connexion with graphs." Numerische
Mathematik 1: 269–271.
Ducruet, César. 2008. "Hub dependence in constrained economies: The case of North Korea."
Maritime Policy and Management 35 (4): 377–394.
Ducruet, César, Sung-Woo Lee, and Adolf K.Y. Ng. 2010. "Centrality and vulnerability in liner shipping networks: Revisiting the Northeast Asian port hierarchy." Maritime Policy and
Management 37 (1): 17–36.
Ducruet, César, and Theo E. Notteboom. 2012a. "The worldwide maritime network of container shipping: Spatial structure and regional dynamics." Global Networks 12 (3): 395–
423.
Ducruet, César, and Theo E. Notteboom. 2012b. "Developing liner service networks in container shipping." In Maritime Logistics: A Complete Guide to Effective Shipping and Port
Management, edited by Dong-Wook Song and Photis Panayides, 77–100. Kogan Page. Ducruet, César, and Jean-Paul Rodrigue. 2012. "Graph theory: Measures and indices." The Geography of Transport Systems. Accessed October 2012.
http://people.hofstra.edu/geotrans/eng/methods/ch1m3en.html
Floyd, Robert W. 1962. "Algorithm 97: Shortest path." Communications of the ACM 5 (6): 345.
Ford, Lester R., and Delbert R. Fulkerson. 1962. Flows in Networks. Princeton University Press.
Fu Xiaowen, Adolf K.Y. Ng, and Yui-Yip Lau. 2010. "The impacts of maritime piracy on global economic development: The case of Somalia." Maritime Policy and Management 37 (7): 677–697.
Gleyze, Jean-François. 2005. La vulnérabilité structurelle des réseaux de transport dans un
15
Gorman, Sean, Laurie Schintler, Raj Kulkarni, and Roger Stough. 2004. "The revenge of distance : Vulnerability analysis of critical information infrastructure." Journal of
Contingencies and Crisis Management 12 (2): 48–63.
Grubesic, Tony H., Timothy C. Matisziw, Alan T. Murray, and Diane Snediker. 2008. "Comparative approaches for assessing network vulnerability." International Regional
Science Review 31 (1): 88–112.
Guerrero, Hector, David Murray, and Richard Flood. 2008. "A model for supply chain and vessel traffic restoration in the event of a catastrophic port closure." Journal of Transportation
Security 1 (2): 71–80.
Guo, Diansheng, Shufan Liu, and Hai Jin. 2010. "A graph-based approach to vehicle trajectory analysis." Journal of Location Based Services 4 (3-4): 183–199.
Guy, Emmanuel. 2003. "Shipping line networks and the integration of South America trades."
Maritime Policy and Management 30 (3): 231–242.
Haggett, Peter, Richard J. Chorley. 1969. Network Analysis in Geography. London: Edward Arnold.
Hall, Peter V. 2004. "’We’d have to sink the ships’: Impact Studies and the 2002 West Coast Port Lockout." Economic Development Quarterly 18 (4): 354–367.
Hu, Yihong, and Daoli Zhu. 2009. "Empirical analysis of the worldwide maritime transportation network." Physica A 388 (101): 2061–2071.
Jenelius, Eric, Tom Petersen, and Lars-Göran Mattsson. 2006. "Importance and exposure in road network vulnerability analysis." Transportation Research Part A 40 (7): 537–560. Johnson, Donald B. 1977. "Efficient algorithms for shortest paths in sparse networks."
Journal of the ACM 24 (1): 1–13.
Kaluza, Pablo, Andre Kölzsch, Michael T. Gastner, and Bernd Blasius. 2010. "The complex network of global cargo ship movements." Journal of the Royal Society Interface 7 (48): 1093–1103.
Kruskal, Joseph B. 1956. "On the shortest spanning subtree of a graph and the traveling salesman problem." Proceedings of the American Mathematical Society 7 (1): 48–50. Liu, Miaojia, and Jacob Kronbak. 2010. "The potential economic viability of using the Northern Sea Route (NSR) as an alternative route between Asia and Europe." Journal of
16
Notteboom, Theo E., and Jean-Paul Rodrigue. 2011. "Challenges to and challengers of the Suez Canal." Port Technology International 51. Accessed November 2013.
http://www.porttechnology.org/images/uploads/technical_papers/PT51-11.pdf
Notteboom, Theo E. 2012. "Towards a new intermediate hub region in container shipping? Relay and interlining via the Cape route vs. the Suez route." Journal of Transport Geography 22: 164–178.
Rodrigue, Jean-Paul. 2004. "Straits, passages and chokepoints. A maritime geostrategy of petroleum distribution." Cahiers de Géographie du Québec 38 (135): 357–374.
Rodrigue, Jean-Paul. 2010. "The Panama Canal expansion and its impact on global shipping patterns." Gateways and Corridors: Routes to the Next Economy, Vancouver, November 17-20.
Rodrigue, Jean-Paul, and Theo E. Notteboom. 2010. "Foreland-based regionalization: Integrating intermediate hubs with port hinterlands." Research in Transport Economics 27: 19–29.
Roy, Bernard. 1959. "Transitivité et connexité." C. R. Acad. Sci. Paris 249: 216–218. Salter, Mark B. 2008. "Political science perspectives on transportation security." Journal of
Transportation Security 1 (1): 29–35.
Shimbel, Alfonso. 1953. "Structural parameters of communication networks." Bulletin of
Mathematical Biophysics 15 (4): 501–507.
Taaffe, Edward J., and Howard L. Gauthier. 1973. Geography of Transportation. Englewood Cliffs NJ: Prentice-Hall.
Ullman, Edward L. 1949. "Mapping the world’s ocean trade: A research proposal." The
Professional Geographer 1 (2): 19–22.
Verny, Jérôme, and Christophe Grigentin. 2009. "Container shipping on the northern sea route." International Journal of Production Economics 122 (1): 107–117.
Vigarié, André. 1968. Géographie de la Circulation. Paris: Genin.
Wang, Jian-Wei, and Li-Li Rong. 2009. "Cascade-based attack vulnerability on the US power grid." Safety Science 47 (10): 1332–1336.
Warshall, Stephen. 1962. "A theorem on Boolean matrices." Journal of the ACM 9 (1): 11–12. Wasserman, Stanley, and Katherine Faust. 1994. Social Network Analysis: Methods and
Applications. Cambridge University Press.
Zavitsas, Konstantinos, and Michael G.H. Bell. 2010. "A simulation model and a vulnerability assessment of the worldwide energy supply." In: Security and Environmental Sustainability of
17
Multimodal Transport, edited by Michael H. Bell, Solmaz H. Hosseinloo, and Urszula
Kanturska, 227–246. NATO Science for Peace and Security Series C: Environmental Security.
18
Table 1: Importance of canal-dependent flows in global container flows (% TEUs)
Panama Canal Suez Canal Panama & Suez 1996 2006 1996 2006 1996 2006 Total traffic 17.0 13.3 34.0 30.8 44.2 40.7 Intraregional traffic 10.7 8.0 24.6 21.8 31.8 27.8 Interregional traffic 26.8 23.1 48.8 47.6 63.7 64.4 Source: own calculation based on Lloyd's List
Table 2: Topological effects of removing interoceanic canals in 1996 and 2006
Matrix of chains Matrix of complete graphs Eccentricity Transitivity Eccentricity Transitivity 1996 2006 1996 2006 1996 2006 1996 2006 Original network 0.765 0.644 0.527 0.517 0.623 0.628 0.747 0.737 Without links > 50% canal-related traffic Panama 0.762 0.666 0.489 0.492 0.728 0.629 0.723 0.714 Suez 0.698 0.742 0.444 0.476 0.730 0.635 0.683 0.684 Both 0.698 0.739 0.417 0.436 0.734 0.723 0.465 0.453 Without all canal-related links Panama 0.749 0.707 0.451 0.394 0.733 0.762 0.638 0.598 Suez 0.674 0.731 0.399 0.413 0.726 0.762 0.571 0.550 Both 0.688 0.720 0.349 0.267 0.767 0.803 0.375 0.345 Source: own calculation based on Lloyd's List data and TULIP software
19
Figure 1. North Korea’s traffic via interoceanic canals, 1985–2006.
20
Figure 2. Canal-dependent traffic by route and region in 1996 and 2006
21
Figure 3. Canal-dependent traffic at world ports in 1996 and 2006
22
Figure 4. Global network structure and node centrality in 1996 and 2006
23
Figure 5. Centrality impacts of canal removal in 1996 and 2006
24
Appendix 1: Methodology for network construction and analysis
25
Appendix 2: Canal-dependent traffics at largest ports of the world in 1996 and 2006
1996 2006
Port P+S PAN SUEZ Port P+S PAN SUEZ Singapore 57.9 6.8 57.4 Hong Kong 56.3 15.1 45.6 Hong Kong 52.5 11.9 47.4 Suez Canal 100.0 7.0 100.0 Suez Canal 100.0 9.9 100.0 Panama Canal 100.0 100.0 19.3 Panama Canal 100.0 100.0 31.0 Singapore 49.0 4.2 47.8 Kaohsiung 53.6 17.4 45.3 Shenzhen 72.0 21.2 56.3 Rotterdam 67.9 17.7 60.7 Busan 47.5 20.8 32.1 Los Angeles 54.3 41.9 31.5 Shanghai 53.5 18.8 40.8 Hamburg 75.7 17.6 71.8 Kaohsiung 49.8 14.5 37.7 Busan 53.7 20.1 45.4 Rotterdam 74.1 11.4 66.8 Le Havre 74.2 26.2 67.3 Ningbo 64.3 15.7 55.0 Colombo 87.1 18.9 87.1 Hamburg 76.4 6.9 73.6 Kobe 37.8 14.3 25.5 Port Klang 50.7 7.8 50.1 Tokyo 47.1 17.5 38.8 New York 76.8 58.9 28.8 Jeddah 98.3 4.3 98.3 Savannah 92.9 86.1 27.3 Felixstowe 65.9 20.6 56.6 Jeddah 89.8 5.7 89.5 New York 76.3 63.3 38.0 Manzanillo(PAN) 94.0 94.0 14.6 Yokohama 33.4 14.7 20.7 Tokyo 45.7 24.8 23.7 Nagoya 38.3 13.2 30.2 Colombo 67.1 9.3 66.6 Antwerp 63.3 25.8 54.9 Qingdao 57.6 15.1 46.0 Osaka 49.5 24.0 39.3 Xiamen 57.9 7.8 54.3 San Francisco 44.2 29.9 26.1 Oakland 51.9 28.6 26.8 Southampton 96.6 2.3 96.5 Yokohama 37.0 22.9 16.6 Port Klang 45.6 5.3 45.6 Felixstowe 68.4 6.8 65.7 Bremerhaven 57.1 32.1 40.6 Kobe 43.0 23.0 22.0 Manzanillo(PAN) 95.4 95.4 13.5 Jebel Ali 52.2 4.6 51.6 Keelung 26.9 10.3 21.9 Los Angeles 54.2 28.5 32.0 Savannah 92.8 89.3 28.3 Tanjung Pelepas 77.0 8.0 74.6 Charleston 64.4 46.7 35.3 Long Beach 53.2 27.1 30.8 Cristobal 95.1 95.1 61.9 Charleston 64.0 50.7 24.7 Shimizu 61.6 12.2 61.3 Bremerhaven 61.0 18.6 46.6 Barcelona 65.0 18.8 49.0 Nagoya 37.6 17.1 22.5 Buenaventura 90.4 88.4 3.1 Antwerp 59.2 14.1 47.4
Source: own elaboration based on Lloyd's List data