HAL Id: hal-02496156
https://hal.archives-ouvertes.fr/hal-02496156
Preprint submitted on 3 Mar 2020
HAL is a multi-disciplinary open access
archive for the deposit and dissemination of
sci-entific research documents, whether they are
pub-lished or not. The documents may come from
teaching and research institutions in France or
abroad, or from public or private research centers.
L’archive ouverte pluridisciplinaire HAL, est
destinée au dépôt et à la diffusion de documents
scientifiques de niveau recherche, publiés ou non,
émanant des établissements d’enseignement et de
recherche français ou étrangers, des laboratoires
publics ou privés.
Fine-grain atlases of functional modes for fMRI analysis
Kamalaker Dadi, Gaël Varoquaux, Antonia Machlouzarides-Shalit, Krzysztof
Jacek Gorgolewski, Demian Wassermann, Bertrand Thirion, Arthur Mensch
To cite this version:
Kamalaker Dadi, Gaël Varoquaux, Antonia Machlouzarides-Shalit, Krzysztof Jacek Gorgolewski,
Demian Wassermann, et al.. Fine-grain atlases of functional modes for fMRI analysis. 2020.
�hal-02496156�
Fine-grain atlases of functional modes for fMRI analysis
Kamalaker Dadia, Ga¨el Varoquauxa, Antonia Machlouzarides-Shalita, Krzysztof J. Gorgolewskic, Demian
Wassermanna, Bertrand Thiriona, Arthur Menscha,b
aInria, CEA, Universit´e Paris-Saclay, Palaiseau, 91120, France bENS, DMA, 45 rue d’Ulm, 75005 Paris
cDepartment of Psychology, Stanford University, California, USA
Abstract
Population imaging markedly increased the size of functional-imaging datasets, shedding new light on the neural basis of inter-individual differences. Analyzing these large data entails new scalability challenges, computational and statistical. For this reason, brain images are typically summarized in a few signals, for instance reducing voxel-level measures with brain atlases or functional modes. A good choice of the corresponding brain networks is important, as most data analyses start from these reduced signals. We contribute finely-resolved atlases of functional modes, comprising from 64 to 1024 networks. These dictionaries of functional modes (DiFuMo) are trained on millions of fMRI functional brain volumes of total size 2.4TB, spanned over 27 studies and many research groups. We demonstrate the benefits of extracting reduced signals on our fine-grain atlases for many classic functional data analysis pipelines: stimuli decoding from 12,334 brain responses, standard GLM analysis of fMRI across sessions and individuals, extraction of resting-state functional-connectomes biomarkers for 2,500 individuals, data compression and meta-analysis over more than 15,000 statistical maps. In each of these analysis scenarii, we compare the performance of our functional atlases with that of other popular
references, and to a simple voxel-level analysis. Results highlight the importance of using high-dimensional “soft”
functional atlases, to represent and analyse brain activity while capturing its functional gradients. Analyses on high-dimensional modes achieve similar statistical performance as at the voxel level, but with much reduced computational cost and higher interpretability. In addition to making them available, we provide meaningful names for these modes, based on their anatomical location. It will facilitate reporting of results.
Keywords: Brain imaging atlases; Functional networks; Functional parcellations; Multi-resolution;
1. Introduction
Population imaging has been bringing in terabytes of high-resolution functional brain images, uncovering the
neural basis of individual differences (Elliott et al.,2008).
While these great volumes of data enable fitting richer
sta-tistical models, they also entail massive data storage (
Pol-drack et al., 2013; Gorgolewski et al., 2017) and challeng-ing high-dimensional data analysis. A popular approach to facilitate data handling is to work with image-derived phenotypes (IDPs), i.e. low-dimensional signals that sum-marize the information in the images while keeping
mean-ingful representations of the brain (Miller et al., 2016).
While brain atlases originated in characterizing the
brain’s microstructure (Brodmann,1909), today they are
widely used to study functional connectomes (Sporns
et al.,2005;Varoquaux and Craddock,2013) and for data
reduction in functional imaging (Thirion et al.,2006;
Crad-dock et al., 2012). For these applications, the choice of brain regions conditions the signal captured in the data analysis. To define regions well suited to brain-imaging endeavors, there is great progress in building atlases from
the neuroimaging data itself (Eickhoff et al., 2018). Yet,
most functional atlases describe the brain as parcellations,
locally-uniform functional units, and thus do not represent
well functional gradients (Huntenburg et al., 2018).
For functional imaging, brain structures delineated by an atlas should capture the main features of the functional
signal, e.g. the functional networks (Smith et al.,2011). In
a nutshell, there are two approaches to define well-suited structures. These can strive to select homogenous neural
populations, typically via clustering approaches (Goutte
et al., 1999; Bellec et al., 2010; Craddock et al., 2012;
Thirion et al.,2014;Schaefer et al.,2017). They can also be defined via continuous modes that map intrinsic brain
functional networks (Damoiseaux et al.,2006;Varoquaux
et al.,2011;Harrison et al.,2015). These functional modes have been shown to capture well functional connectivity, with techniques such as Independent Component Analysis (Kiviniemi et al.,2009;Pervaiz et al.,2019) or sparse
dic-tionary learning (Mensch et al.,2016b;Dadi et al.,2019).
High-resolution atlases can give a fine-grained divi-sion of the brain and capture more functionally-specific
regions and rich descriptions of brain activity (Schaefer
et al., 2017). Yet, there is to date no highly-resolved set of “soft” functional modes available, presumably because increasing the dimensionality raises significant
computa-tional and statistical challenges (Mensch et al.,2016a; Per-vaiz et al.,2019). In this paper, we address this need with high-order dictionaries of functional modes (DiFuMo) ex-tracted at a large scale both in terms of data size (3 million volumes of total data size 2.4TB) and resolution (up to 1024 modes). For this, we leverage the wealth of
openly-available functional images (Poldrack et al.,2013) and
ef-ficient dictionary-learning algorithms to fit on large data. This is unlike ICA which is hard to use for a high number
of modes (Pervaiz et al.,2019).
Contributions. We provide Dictionaries of Functional
Modes1 “DiFuMo” that can serve as atlases to extract
functional signals, e.g. provide IDPs, with different di-mensionalities (64, 128, 256, 512, and 1024). These modes are optimized to represent BOLD data well, over a wide range of experimental conditions. They are more finely-resolved than existing brain decompositions with contin-uous networks. By providing validated fine functional at-lases, our goal is to streamline fMRI analysis with reduced representations, to facilitate large-cohort and inter-studies work. Through thorough benchmarking over classic data analysis tasks, we show that these modes gives IDPs that ground better analysis of functional images. Finally, we provide a meaningful label to each mode, summarizing its anatomical location, to facilitate reporting of results.
2. Methods: data-driven fine-grain functional
modes
We describe in this section the models and methods un-derlying our definition of brain structures to extract IDPs. 2.1. Context: Image Derived Phenotypes
While analysis of brain images has been pioneered at
the voxel level (Friston et al.,1995), image-derived
pheno-types (IDP) are increasingly used in the context of pop-ulation imaging. Trading voxel-level signals for IDPs has several motivations. First and foremost, it greatly facili-tates the analysis on large cohorts: the data are smaller, easier to share, requiring less disk storage, computer mem-ory, and computing power to analyze. It can also come with statistical benefits. For instance, in standard analysis of task responses, e.g. in mass-univariate brain mapping, the statistical power of hypothesis test at the voxel level
is limited by multiple comparisons (Friston et al., 1995),
while working at the level of IDPs mitigates this
prob-lem (Thirion et al.,2006). For predictive modeling, e.g. in
multi-variate decoding (Mour˜ao-Miranda et al.,2005), the
high-dimensionality of the signals is a challenge to learning models that generalize well—a phenomenon known as the
curse of dimensionality in machine learning (Hastie et al.,
2009). Finally, for functional connectomes, working at
voxel-level is computationally and statistically intractable
1https://parietal-inria.github.io/DiFuMo
as it entails modeling billions of connections. The stan-dard approach is therefore to average signals on regions or
networks (Varoquaux and Craddock,2013).
Functional neuroimaging is currently largely dependent
on neuroanatomy for mapping function to structure (
De-strieux et al., 2010; Devlin and Poldrack, 2007). Some anatomical structures support well a direct mapping to
specific functions (Brett et al., 2002; Rademacher et al.,
1993), e.g. the primary visual areas. Yet other functional
units are not simply defined from anatomical features, for instance in high-level regions such as the default mode,
which is defined from functional data (Leech et al.,2011;
Greicius et al., 2003).
2.2. Methods for data-driven functional atlases
Compared to anatomical atlases, defining regions from the functional signal can lead to a better explanation of
behavioral outcomes (Dadi et al., 2019), as they capture
the functional structure of the brain. Clustering of fMRI timeseries has been heavily used to define brain
parcella-tions (Goutte et al., 1999), or for data reduction in
pre-dictive models (Michel et al.,2012). Reference functional
brain parcellations have been defined with various
cluster-ing algorithms on restcluster-ing-state fMRI (Bellec et al.,2010;
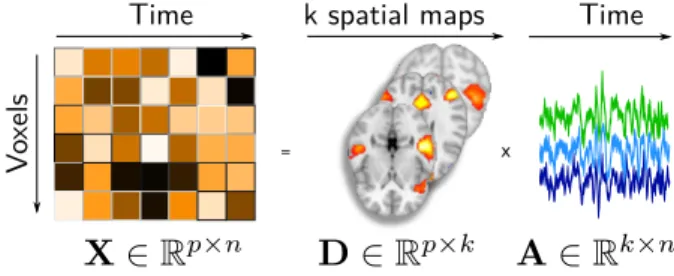
Yeo et al., 2011; Craddock et al., 2012). Another class of approaches seeks modes of brain activity, decomposing the signal as a product of spatial maps and
correspond-ing time-series (Figure 1). The most popular model in
neuroimaging is independent component analysis (ICA,
Hyv¨arinen and Oja, 2000), which optimizes spatial inde-pendence between extracted maps. It has been extensively
used to define resting-state networks (Kiviniemi et al.,
2003; Beckmann et al., 2005; Calhoun et al., 2001) and implicitly outlines soft parcellations of the brain at high
order (Kiviniemi et al., 2009; Varoquaux et al., 2010b).
ICA-defined networks are used to extract the official IDPs of UK BioBank, the largest brain-imaging cohort to date;
these have been shown to relate to behavior (Miller et al.,
2016).
We rely on another decomposition model, dictionary
learning (Olshausen and Field, 1997), that enforces
spar-sity and non-negativity instead of independence on the
Vo
xels
Time
=
k spatial maps Time
x
Figure 1: Linear decomposition model of fMRI time-series for estimating brain networks: The fMRI time series X are fac-torized into a product of two matrices, D wich contain spatial modes and A temporal loadings of each mode. p number of features, n -number of volumes in fMRI image, k - -number of dictionaries.
spatial maps. While less popular than ICA in neuroimag-ing, sparsity brings the benefit of segmenting well
func-tional regions on a zeroed-out background (Lee et al.,2010;
Varoquaux et al.,2011). For our purposes, an important aspect of sparse models is that they have computationally-scalable formulations even with high model order and
on large datasets (Mensch et al., 2016a, 2018).
Func-tional modes defined from sparse dictionary learning have
been used to predict Autism Spectrum Disorder (Abraham
et al.,2017), or mental processes (Mensch et al.,2017). Rest and task fMRI. Most functional brain atlases have
been extracted from rest fMRI (Bellec et al.,2010;Power
et al.,2011;Craddock et al.,2012;Yeo et al.,2011;Miller et al.,2016;Schaefer et al.,2017). Brain networks can also
be extracted from task fMRI data (Calhoun et al., 2008;
Lee et al., 2010), and segment a similar intrinsic
large-scale structure (Smith et al.,2009). In our work, we build
functional modes from datasets with different experimen-tal conditions, including task and rest. Our goal is to be as general as possible and capture information from differ-ent protocols. Indeed, defining networks on task fMRI can help representing these brain images and predicting the
corresponding psychological conditions (Duff et al.,2012).
2.3. DiFuMo extraction: model and data
We consider BOLD time-series from fMRI volumes, re-sampled and registered to the MNI template. After
tempo-ral concatenation, those form a large matrix X ∈ Rp×n,
where p is the number of voxels of the images (around
2 · 105), and n is the number of brain images, of the
or-der of 106 in the following. To extract DiFuMos, each
brain volume is modeled as the linear combination of k spa-tial functional networks, assembled in a dictionary matrix
D ∈ Rp×k. We thus assume that X approximately
fac-torizes as DA, where the matrix A ∈ Rk×nholds in every
column the loadings αinecessary to reconstruct the brain
image xi from the networks D. The dictionary D is to
be learned from data. For this, we rely on Stochastic
On-line Matrix Factorization2 (Mensch et al., 2018, SOMF),
that is computationally tractable for matrices large in both directions, as with high-resolution large-scale fMRI data.
SOMF solves the constrained `2 reconstruction problem
min D∈Rp×k,A∈Rk×n D>0,∀ j∈[k], kdjk161 kX − DAk2 F + λkAk 2 F,
where λ is a regularization parameter that controls the
sparsity of the dictionary D, via the `1and positivity
con-straints. Encouraging sparsity in spatial maps is key to obtaining well-localized maps that outline few brain re-gions. The parameter λ is chosen so that the union of all maps approximately covers the whole brain.
2Available at:https://arthurmensch.github.io/modl/
Input fMRI data. We build the input data matrix X with BOLD time-series from 25 different task-based fMRI studies and 2 resting state studies, adding up to 2 192 functional MRI recording sessions. We gather data from
OpenNeuro (Gorgolewski et al.,2017) –Table A4lists the
corresponding studies while Table A5 gives their
data-acquisition parameters.
We use fMRIprep (Esteban et al., 2019) for minimal
preprocessing: brain extraction giving as a reference to
correct for head-motion (Jenkinson et al., 2002), and
co-registration to anatomy (Greve and Fischl,2009). All the
fMRI images are transformed to MNI template space. We
then use MRIQC (Esteban et al.,2017) for quality control.
Multi-dimensional DiFuMo atlases. We estimate dictio-naries of dimensionality k ∈ {64, 128, 256, 512, 1024}. This is useful as the optimal dimensionality for extracting IDPs often depends on the downstream data analysis task. The obtained functional modes segment well-localized regions,
as illustrated inFigure 2.
2.4. Extracting signal on functional modes
The functional modes take continuous values (we re-fer to them as soft ) and can have some overlap –though in practice this overlap is small. As a consequence, sig-nal extraction calls for more than averaging on regions. The natural formulation is that the extracted signals (the
IDPs) should best approximate the brain image x ∈ Rp
as a linear combination α ∈ Rk of the set of modes in the
dictionary D ∈ Rp×k. This is solved by linear regression:
α = argmin
α∈Rk
kx − Dαk2
2, i.e. α = D
†x, (1)
where D† = (DTD)−1DT ∈ Rk×p is the pseudo-inverse
of D. For atlases composed of non-overlapping regions,
such as classic brain parcellations—e.g. BASC (Bellec
et al.,2010) or normalized cuts (Craddock et al.,2012)— linear regression simply amounts to averaging the images values in every cluster of D. For overlapping modes as the
ones of DiFuMo or the ICA maps used in UKBB (Miller
et al., 2016), the linear regression formulation caters for the overlap and softness of the regions.
2.5. Region names: relation to anatomical structures Relating IDPs to known brain structures facilitates
in-terpretation and discussion of results. Though the
Di-FuMo atlases are defined from functional signal, we choose to reference their regions by their anatomical location, as it is a common and well-accepted terminology in neuro-science. For each resolution, we match the modes with re-gions in references of brain structure: the Harvard-Oxford
atlas (Desikan et al., 2006), Destrieux atlas (Destrieux
et al., 2010), the MIST atlas (Urchs et al., 2019), Johns
Hopkins University (JHU) atlas (Hua et al.,2008), and the
Dierdrichsen cerebellum atlas (Diedrichsen et al., 2009).
We name each mode from the anatomical structure that 3
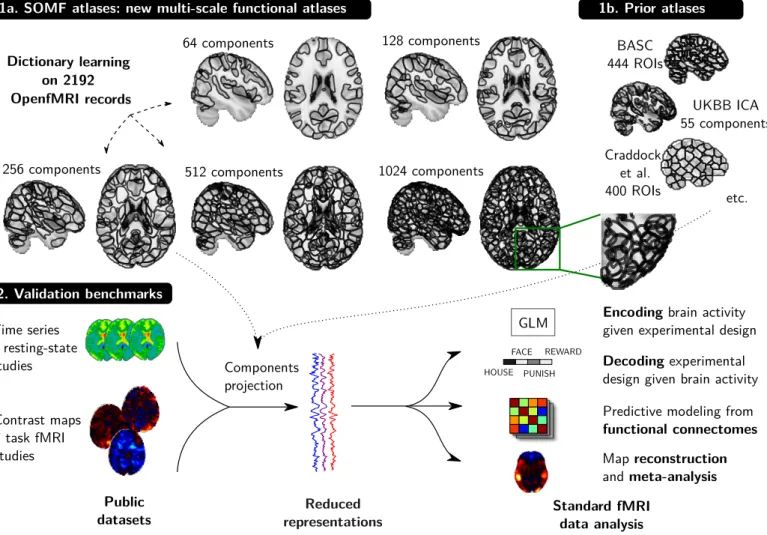
Public
datasets representationsReduced Standard fMRIdata analysis
Predictive modeling from
functional connectomes Encoding brain activity
given experimental design GLM HOUSE FACE PUNISH REWARD Decoding experimental
design given brain activity Components projection Time series 7 resting-state studies Contrast maps 7 task fMRI studies 2. Validation benchmarks Map reconstruction and meta-analysis Dictionary learning on 2192 OpenfMRI records
1a. SOMF atlases: new multi-scale functional atlases
BASC 444 ROIs UKBB ICA 55 components Craddock et al. 400 ROIs 1b. Prior atlases 128 components
256 components 512 components 1024 components
64 components
etc.
Figure 2: Schema of DiFuMo atlases and their usage in typical fMRI analyses. DiFuMo atlases are extracted from a massive concatenation of BOLD time-series across fMRI studies, using a sparsity inducing matrix factorization algorithm. We compute the DiFuMo atlases at different resolutions, up to 1024 components. We assess our atlases in 4 benchmarks that measure suitability to classic fMRI analyses. Those are performed on reduced and non-reduced data, with different atlas sizes and a comparison between atlases. The easiest way to view and download DiFuMo atlases is via the online interactive visualizations: parietal-inria.github.io/DiFuMo.
it most overlaps with. When the overlap was weak, a
trained neuroanatomist (AMS) looked up the structure in
standard classic anatomy references (Henri,1999;
Schmah-mann et al., 1999; Rademacher et al., 1992; Ono et al.,
1990; Catani and de Schotten, 2012). AppendixF gives more details on the naming of the brain areas.
3. Brain-image analysis on functional modes We use the reduced representations (IDPs) introduced above for various functional-imaging analytic tasks:
stan-dard mass-univariate analysis of brain responses (§3.2);
de-coding of mental processes from brain activity (§3.3);
pre-diction of phenotypes from functional connectomes (§3.4);
finally, we measure the quality of signal reconstruction af-ter the dimension reduction, with an illustration on
meta-analyses (§3.5).
3.1. Benchmarking several functional atlases
To gauge the usefulness of the extracted IDPs, we com-pare each analysis pipeline across several functional
at-lases: DiFuMo and reference atlases are used to compute functional IDPs. We use the same signal-extraction
func-tion (1), but vary the spatial components D. As a baseline,
we also perform the voxel-level analyses, though it entail significantly larger computational costs.
We consider other functional atlases that are
multi-resolutions, accessible to download, and volumetric (
Ta-ble 1): ICA maps with k ∈ {21, 55} components,
extracted on large-scale rs-fMRI from UKBB (Miller
et al., 2016); bootstrap analysis of stable clusters (BASC) built with hierarchical clustering on rs-fMRI, with
var-ious number of clusters (Bellec et al., 2010);
spatially-constrained clustering on rs-fMRI, with k ∈ {200, 400}
clusters (Craddock et al., 2012); k = 333 cortical
ar-eas derived from rs-fMRI using a local gradient
ap-proach (Gordon et al., 2014); k ∈ {90, 499} functional
regions covering cortical and subcortical gray matter
with ICA and Ward clustering (Shirer et al. (2012),
Altmann et al. (2015)); and brain parcellations derived with gradient-weighted Markov Random Field, with
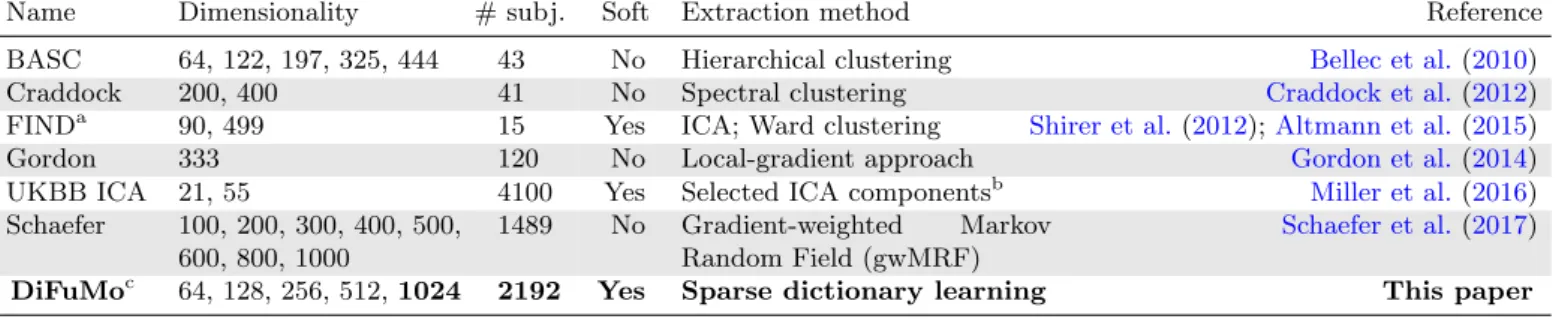
Name Dimensionality # subj. Soft Extraction method Reference
BASC 64, 122, 197, 325, 444 43 No Hierarchical clustering Bellec et al.(2010)
Craddock 200, 400 41 No Spectral clustering Craddock et al.(2012)
FINDa 90, 499 15 Yes ICA; Ward clustering Shirer et al. (2012);Altmann et al.(2015)
Gordon 333 120 No Local-gradient approach Gordon et al.(2014)
UKBB ICA 21, 55 4100 Yes Selected ICA componentsb Miller et al.(2016)
Schaefer 100, 200, 300, 400, 500,
600, 800, 1000
1489 No Gradient-weighted Markov
Random Field (gwMRF)
Schaefer et al.(2017)
DiFuMoc 64, 128, 256, 512, 1024 2192 Yes Sparse dictionary learning This paper
ahttps://findlab.stanford.edu/functional_ROIs.html bhttps://www.fmrib.ox.ac.uk/ukbiobank/ chttps://parietal-inria.github.io/DiFuMo
Table 1: Functional atlases that we benchmark; they define IDPs for brain-images. analysis
3.2. Mapping brain response: standard task-fMRI analysis Standard analysis in task fMRI relates psychological manipulations to brain activity separately for each voxel or region. It models the BOLD signal as a linear com-bination of experimental conditions—the General Linear
Model (GLM, Friston et al., 1995). The BOLD signal
forms a matrix Y ∈ Rn×p, where p is the number of voxels.
With data reduction, we use as input the reduced signal Yred = Yvoxel(D†)> ∈ Rn×k (Equation 1). The GLM
models Y or Yredas Y = Xβ + ε where X ∈ Rn×q is the
design matrix formed by q temporal regressors of interest
or nuisance and ε is noise (Friston et al., 1998). In our
experiments, we use the Nistats library3.
With reduced input Yred, we obtain one signal per
re-gion, as β ∈ Rq×k. The full β-maps can then be
recon-structed by setting βrec = βD> ∈ Rq×p. We transform
the reconstructed β-maps into z-maps z ∈ Rq×pusing base
contrasts, before thresholding them with Benjamini and
Hochberg(1995) FDR correction for multiple comparisons. We then compare the z-maps obtained using voxels as in-put, and z-maps using reduced input and reconstructed
β-maps, using theDice(1945) similarity coefficient. We also
perform an intra-subject analysis detailed inAppendixD.
Data. We consider the Rapid-Serial-Visual-Presentation (RSVP) language task of Individual Brain Charting (IBC) (seePinho et al.,2018, for experimental protocol and pre-processing). We model six experimental conditions: com-plex meaningful sentences, simple meaningful sentences, jabberwocky, list of words, lists of pseudowords, conso-nant strings. β-maps are estimated for each subject using a fixed-effect model over 3 out of the 6 subject’s sessions. We randomly select 3 sessions 10 times to estimate the variance of the Dice index across sessions. As a baseline, we evaluate the mean and variance of the Dice index across z-maps when varying the sessions used in voxel-level GLM. 3.3. Decoding experimental stimuli from brain responses
Decoding predicts psychological conditions from
task-related z-maps (Haynes and Rees, 2006). The validity of
a decoding model is evaluated on left-out data (following
3
https://nistats.github.io/
Varoquaux et al., 2017), e.g. left-out subjects for
inter-subject decoding (Poldrack et al., 2009). We use linear
decoding models: ridge regression for continuous target
and Support Vector Machine (SVC, Hastie et al., 2009)
for classification. For each study, we separate sessions (for intra-subject decoding) or subjects (for inter-subject de-coding) into randomly-chosen train and test folds (20 folds with 30% test size), and measure the test accuracy. We compare the performance of predictive models using the voxel-level z-maps or using the data reduced with func-tional atlases.
Data. We use 6 open-access task fMRI studies. We per-form inter-subject decoding in the emotional and
sensi-tivity to pain experiences fromChang et al. (2015), and
in three studies from HCP900 (Van Essen et al., 2012):
working memory, gambling (Delgado et al.,2000), and
relational processing (Smith et al.,2007). We perform
intra-subject decoding using the several sessions of left and right button press responses in IBC (ARCHI proto-col,Pinel et al.,2007). The unthresholded z-maps used in the decoding pipeline are either obtained from Neurovault (Gorgolewski et al., 2015), or computed with the GLM
following§3.2. Details are reported inAppendixB.1.
3.4. Predicting phenotype from functional connectomes Resting-state fMRI can be used to predict phenotypic
traits (Richiardi et al.,2010). For this, each subject is
rep-resented by a functional connectivity matrix that captures the correlation between brain signals at various locations. Our functional-connectome prediction pipeline comprises three steps: 1) we extract a reduced representation of the BOLD signal, projecting voxel-level data onto a functional
atlas as in§3.2; 2) we compute a functional connectome
from the reduced BOLD signals; 3) we use it as input to a linear model. We compute a connectome from activations
with theLedoit and Wolf (2004) covariance estimator as
Varoquaux and Craddock(2013);Brier et al.(2015). We then derive single-subject features from covariance
matri-ces using their tangent space parametrization (Varoquaux
et al.,2010a;Barachant et al.,2013;Pervaiz et al.,2019).
Those are used to fit an `2-penalized logistic regression for
classification and a ridge regression for continuous targets. 5
We assess predictive performance with 20 folds, random splits of subjects in train and test sets, with 25% test size. Data. We use 7 openly-accessible datasets with diverse
phenotypic targets, as summarized inTable A3. We
pre-dict diagnostic status for Alzheimer’s disease on ADNI (Mueller et al., 2005), PTSD on ADNIDOD; Autism
Spetrum Disorder on ABIDE (Di Martino et al., 2014)
and schizophrenia on COBRE (Calhoun et al., 2012);
drug consumption on ACPI; IQ measures on HCP (Van Essen et al.,2013); and age (with a regression model)
in normal aging with CamCAN (Taylor et al.,2017).
3.5. Quality of image reconstruction
The signals extracted on a brain atlas can be seen as a compression, or simplification, of the original signal. In-deed, a full image can be reconstructed from these signals. We quantify the signal loss incurred by this reduction. For this, we project a brain map x onto an atlas (solving Eq.
(1)), and compute the best reconstruction of x from the
loadings α, namely ˆx = Dα ∈ Rp. We compare original
and reconstructed images through the R2 coefficient,
R2(x, ˆx) = 1 −kx − ˆxk 2 2 kx − ¯xk2 2 , (2)
where ¯x ∈ R is the spatial mean of map x. The R2
coeffi-cient is averaged across all images. Higher R2coefficients
means that the reduced signals (IDPs) explain more
vari-ance of the original images, where R2= 1 corresponds to
no signal loss. The larger the number of signals used, the easier it is to explain variance; it is therefore interesting to compare this measure across atlases with similar number of components.
Data. We use NeuroVault (Gorgolewski et al.,2015), the
largest public database of statistical maps. To avoid circu-larity, we exclude maps derived from the studies used to ex-tract the DiFuMo atlases, along with maps that fail semi-automated quality inspection (filtering out thresholded or non-statistical maps), resulting in 15,542 maps.
Meta-analysis of contrasts maps. Ideally, the extracted IDPs should allow to compute meta-analytical summaries of brain activity maps. In this setting, a single map, corre-sponding to a certain cognitive concept, is computed from many z-maps across different studies, associated to con-ditions that involve this cognitive concept. We compare the summaries obtained at voxel-level, i.e. averaging the maps {x}, with the ones obtained using reconstructed
im-ages, i.e. averaging the maps { ˜x} used in Eq. (2). We use
maps from our curated subset of NeuroVault annotated with terms motor, language and face recognition.
4. Results: comparing atlases for analyses
We report benchmarking results on the analytic tasks listed in the previous section.
32 64 128 256 512 1024
Dimension
0.0
0.2
0.4
0.6
0.8
Mean Dice index relative to
voxel-level maps
UKBB ICA
DiFuMo
BASC
Craddock
FIND
Gordon
Schaefer
Voxel-level
Across-fold consistency
at voxel-level
General Linear Model on task fMRI
x=14
L
R
z=0
-4.5
-2.2
0
2.2
4.5
GLM at the voxel level,
p ~ 200,000 voxels
GLM on DiFuMo reduction,
p = 1024 voxels
Group-level z-map: complex sentence
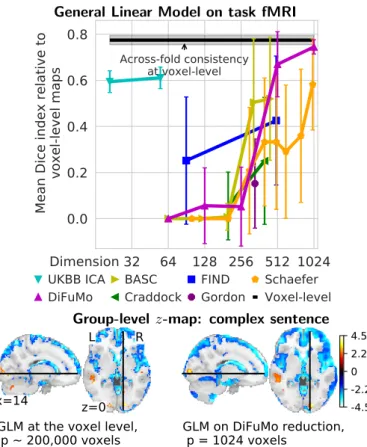
Figure 3: Overlap between GLM maps obtained with func-tional atlases and voxel-level analysis. Top: The overlap is measured with the Dice similarity coefficient. The black line gives a baseline the mean overlap between voxel-level contrast maps over several random selections of sessions per subject. The figure gives Dice similarity scores between the GLM maps computed with sig-nals extracted on functional atlases and at the voxel-level, after re-construction of full z-maps and voxel-level thresholding with FDR control. The best similarity is achieved for highest dimensional-ity, though 1024-dimensional DiFuMo atlas largely dominates 1000-dimensional Schaefer parcellation. Each point is the mean and the error bar denotes the standard deviation over contrast maps. Bot-tom: The activity maps encoded on 1024-dimensional space capture the same information and much smoother to voxel-level.
4.1. Brain mapping: standard task-fMRI analysis
Figure 3reports the results of standard analysis of task fMRI (GLM), comparing analysis at the voxel-level with analyses on signals extracted from functional atlases. Best correspondence is obtained at highest dimensionality, as the regions are finer. Notably, analysis with DiFuMo of dimensionality 1024 is markedly closer to voxel-level analy-sis than using the largest alternative, the 1000-dimensional Schaefer parcellation. In addition, the Dice index relative to the voxel-level gold standard is comparable to the Dice index between runs of voxel-level GLM estimated across folds. We note that using soft functional modes from only 55 ICA components shows excellent results, comparable to those obtained using the 1000 components Schaefer atlas. This stresses the benefit of continuous functional modes for the analysis of task responses. Overall, stan-dard task-fMRI analysis on signals derived from 512 or 1024-dimensional DiFuMo gives results close to the
voxel-32 64 128 256 512 1024
Dimension
-10%
-8%
-6%
-4%
-2%
0%
+2%
+4%
Accuracy gain relative
to median atlas performance
UKBB ICA
DiFuMo
BASC
Craddock
FIND
Gordon
Schaefer
Voxel-level
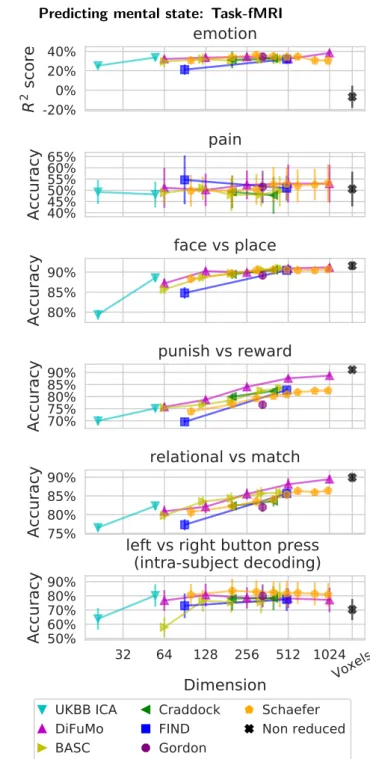
Decoding mental processes from statistical maps
Figure 4: Impact of the choice of atlas on decoding perfor-mance. Each point gives the relative prediction score, over 6 differ-ent task-fMRI experimdiffer-ents. The thick lines give the median relative score per atlas. The baseline (black) is the relative score. High-order resolutions increase prediction accuracy. Using high-High-order Di-FuMo (k = 1024) and Schaefer parcellations (k = 1000) gives the best performance and, on average, outperforms voxel-level predic-tion. AppendixB.2reports absolute prediction scores for each task separately.
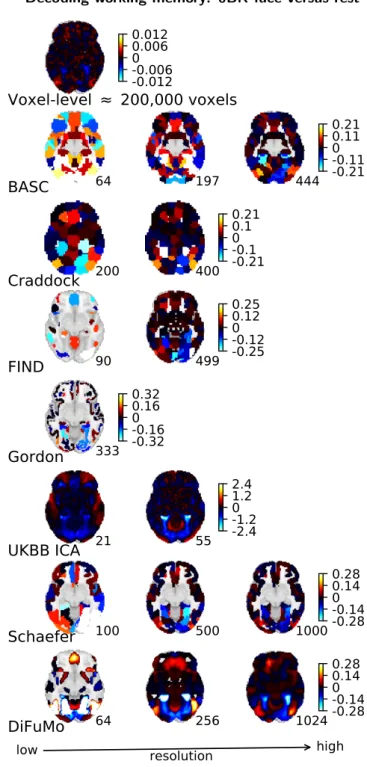
Voxel-level DiFuMo=1024 Schaefer=1000
L R z=-10 Voxel-level L R z=-10 DiFuMo=1024 L R z=-10 Schaefer=1000
Figure 5: Decoding maps of the working memory task, face versus rest, showed for Voxel-level analysis, DiFuMo, and Schaefer. The maps are highly interpretable with high-dimensional soft modes (DiFuMo 1024) compared to voxel-level analysis. Brain areas impor-tant in the visual working memory task –fusiform gyrus and lateral occipital cortex– are clearly visible. Figure A4gives a full view of decoding weights across atlases and resolutions.
level gold standard (Figure 3 shows that the maps are
also qualitatively similar). Figure A6shows similar trends
while comparing intra-subject explained-variance maps, both qualitatively and quantitatively. Dimension reduc-tion have the addireduc-tional benefit of alleviating the burden of correcting for multiple comparisons.
4.2. Decoding mental state from brain responses
Figure 4shows the impact on decoding performance of reducing signals with various functional atlases. It reports the performance relative to the median across methods for each of the 6 tasks. These results clearly show the impor-tance of high-dimensional functional modes for decoding. Indeed, the higher the atlas resolution, the better the pre-dictions. Using DiFuMo k = 1024 or Schaefer k = 1000
32 64 128 256 512 1024
Dimension
-10%
-5%
0%
+5%
+10%
Accuracy gain relative
to median atlas performance
UKBB ICA
DiFuMo
BASC
Craddock
FIND
Gordon
Schaefer
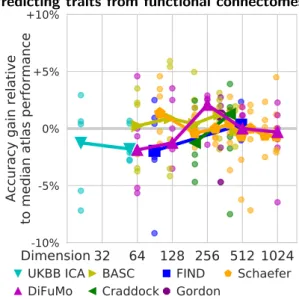
Predicting traits from functional connectomes
Figure 6: Impact of the choice of atlas for predictions based on functional connectomes. Each data point gives the prediction accuracy relative to the median for one of the 7 phenotypic prediction targets, i.e. each point a dataset. The thick line shows the median over the datasets. While the results are noisy, the optimal dimension-ality seems to lie around 300 nodes, and the best-performing atlas is DiFuMo k = 256, followed by Craddock k = 400 and BASC k = 444.
Figure A5report absolute results for each prediction problem.
gives the best performance. In addition, as these func-tional atlases segment sufficiently-fine regions, prediction from the corresponding signals tends to outperform voxel-level prediction. Indeed, applying multivariate models to a larger number of signals with a limited amount of data is more prone to overfitting—data reduction acts here as a welcome regularization. Qualitatively, brain maps con-taining decoding weights can be reconstructed. With high-dimensional atlases, they are interpretable and capture
in-formation similar to voxel-level analysis (Figure 5).
4.3. Predicting traits from functional connectomes
Figure 6 shows the impact of the choice of functional atlas when predicting phenotypes from functional connec-tomes. It reports the relative prediction accuracy for 7 different prediction problems (each composed of a dataset and a target phenotype); the lines give the median across the prediction problems. Here, we do not report a voxel-level baseline, as it requires to compute covariance matri-ces of dimensions around 100, 000 × 100, 000 and is there-fore computationally and statistically intractable. Unlike with the previous results, high-resolution atlases do not provide the best performance, likely because the complex-ity of the statistical models increases with the square of the number of nodes. The best prediction overall is achieved using DiFuMo k = 256, followed by Craddock k = 400 and BASC k = 444 atlases. Different outcomes have dif-ferent optimal dimensionality, consistently across atlases (Figure A5): k ∼ 150 for age prediction; k ∼ 300 for Autism Spectrum Disorder, PTSD, or IQ prediction; and k ∼ 50 for Alzheimer’s Disease and drug use prediction. 7
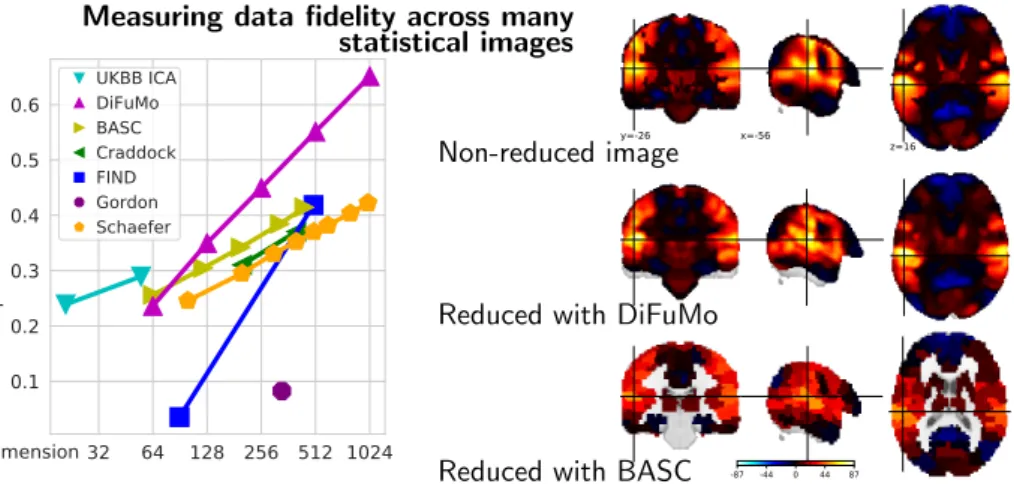
Figure 7: Image reconstruction qual-ity. Left: Quantitative comparison on 15542 statistical images. The R2 loss
be-tween the true and recovered images af-ter compression with brain atlases of mul-tiple resolutions. In general, higher-order atlases capture more signal. Right: Meta-analysis summaries for the motor task. High R2 score (left) correspond to better
capturing fine structures of images, as vis-ible on the qualitative images. DiFuMo atlases better capture the gradients and smooth aspects of the original images than
hard parcellations, as BASC. Dimension32 64 128 256 512 1024
0.1 0.2 0.3 0.4 0.5 0.6 Co m pr es sio n R 2 sc or e UKBB ICA DiFuMo BASC Craddock FIND Gordon Schaefer
Measuring data fidelity across many statistical images
y=-26 x=-56 z=16
Non-reduced image
Reduced with DiFuMo
-87 -44 0 44 87
Reduced with BASC
4.4. Fraction of the original signal captured
Figure 7(left) displays the R2 scores summarizing the
loss of information when data are reduced on an atlas and reconstructed back to full images. Unsurprising, reduc-ing the images with lower-order dimensions (atlases with fewer regions) yields a high loss of information across all methods. DiFuMo k = 1024 captures 70% of the original voxel-level signal. Qualitatively, the benefits of functional modes can be seen by comparing the meta-analytic maps
related to motor tasks (Figure 7right)—Figure A7shows
additional meta-analysis on other topics. The DiFuMo
have clear visual benefits over brain discrete parcellations, such as BASC, as they better capture gradients.
5. Discussion
This paper introduces brain-wide soft functional modes, named DiFuMos and made of a few hundreds to a thousand of brain sub-divisions. They are derived from BOLD time-series across many studies to capture well functional images with a small number of signals. In the context of population imaging, these signals are known as
image-derived phenotypes (IDP, Miller et al., 2016) and
are crucial to easily scale statistical analysis, building a sci-ence of inter-individual differsci-ences by relating brain signals
to behavioral traits (Dubois and Adolphs, 2016).
Reduc-ing the dimensionality of the signals not only come with a 1000× gain in storage, but also with 100× computational
speed-up for the analysis (Table A1). Even small-scale
studies may need functional nodes, e.g. for computing
functional connectomes (Zalesky et al., 2010; Varoquaux
and Craddock,2013). There already exist many functional brain atlases; yet DiFuMos have the unique advantage of being both soft and highly resolved. These features are important to capture gradients of functional information. Grounding better image-derived phenotypes. Signals ex-tracted from a functional atlas should enable good sta-tistical analysis of brain function. We considered quan-titative measures for typical neuroimaging analytic sce-narii and compared the fitness of extracting signal on Di-FuMo with using existing functional brain atlases. The
biggest gains in analysis come from increasing the dimen-sionality of brain sub-divisions, aside for functional con-nectome studies where an optimal is found around 200
nodes. Choosing the number of nodes then becomes a
tradeoff between complexity of the representation and an-alytic performance. Importantly, the gains in anan-alytic per-formance continue way beyond the dimensionality
typi-cally used for IDPs (e.g. 55 components fromMiller et al.,
2016). These results extend prior literature emphasizing
the importance of high-dimensional parcellations for fMRI (Abou Elseoud et al., 2011; Thirion et al., 2014; Arslan et al.,2017;Sala-Llonch et al.,2019). To foster good anal-ysis, the second most important aspect of a parcellation appears that it be soft, i.e. continuously-valued. For a given dimensionality, soft modes tend to outperform hard parcellations, whether they are derived with ICA or dic-tionary learning.
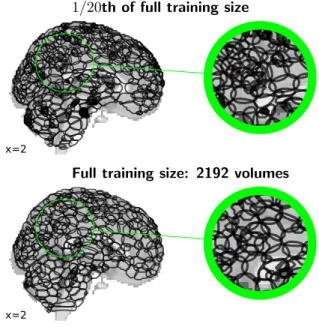
Modes well-adapted to the EPI signal. The functional modes are optimized to fit well a large number of EPI images: 2,192 sessions across 27 studies. As a result, they form a division of the brain well adapted to the signal. For instance, they define regions larger in the white
mat-ter and in the CSF than in the grey matmat-ter (Figure A1).
A large dataset is needed to capture such implicit regular-ities of the signal with high-dimensional spatial decompo-sitions. Indeed, running the same model on less data
ex-tracts modes with less spatial regularity (Figure A2). The
combination of high dimensionality and large dataset leads to significant computational demands. The extraction of DiFuMos was possible thanks to fast algorithms for huge
matrix factorization (Mensch et al., 2018), and gathering
data representative of a wide variety of scanning protocols
via openfMRI (Poldrack et al.,2013).
We did not limit the DiFuMo modes to gray matter, as measures outside gray matter can be useful in subsequent
analysis, for instance to remove the global signal (Murphy
and Fox,2017). In addition, distributed modes extracted from full-brain EPI can separate out noise –such as move-ment artifacts– and help rejecting it in a later analysis (Perlbarg et al., 2007; Griffanti et al.,2014; Pruim et al.,
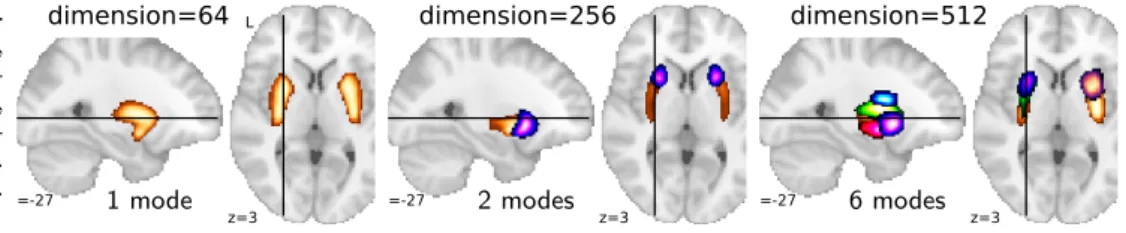
Figure 8: Modes around the puta-men, for DiFuMo dimensionality 64, 256, and 512. As dimensionality in-creases: sub-divisions are more refined, modes are split into right and left hemi-sphere and anterio-posterior direction. Each color represents a single mode.
Figure A8details more this breakdown.
L R z=3 x=-27
dimension=64
1 mode L R z=3 x=-27dimension=256
2 modes L R z=3 x=-27dimension=512
6 modesinterfaces. Depending on the application, practitioners can choose to restrict signal extraction to a grey-matter mask. The functional modes are sharp and anatomically relevant. To extract structures defined by brain anatomy or mi-crostructure, atlasing efforts have used anatomical or
mul-timodal imaging (Mori et al., 2005; Desikan et al., 2006;
Eickhoff et al., 2007; Glasser et al., 2016). The DiFuMo
atlases capture a different signal: brain activity. Yet,
thanks to the sparsity and non-negativity constraint, they are made of localized modes which often have a natural anatomical interpretation. Consequently, we have labeled the modes with a unique name based on the most relevant
anatomical structure, following Urchs et al. (2019) who
also give anatomical labels to functional regions. Indeed, using a common vocabulary of brain structures is impor-tant for communication across the neuroimaging
commu-nity. As visible on Figure 8, the modes are well anchored
on anatomical structures such as the putamen. They are however not constrained to contain only one connected region. Smaller dimension DiFuMos indeed capture dis-tributed networks, often comprising bilateral regions. As the dimensionality increases, the networks progressively separate in smaller networks which eventually form single regions. For instance, the left and right putamen appear in the same mode at dimension 64, and are first sub-divided along the anterio-posterior direction, and later the left and
right putamen are separated (Figure 8). Dimension choice
is data driven: it should best explain the functional signal.
6. Conclusion
We provide multidimensional atlases of functional modes that can be used to extract functional signals:
parietal-inria.github.io/DiFuMo. They give excellent
per-formance for a wide variety of analytic tasks:
GLM-based analysis, mental-process decoding or functional-connectivity analysis. Their availability reduces compu-tational burdens: practitioners can readily perform anal-yses on a reduced signal, without a costly ROI-definition step. In addition, working on common functional modes across studies facilitates comparison and interpretations of results. To help communication, we have labeled ev-ery functional mode to reflect the neuroanatomical struc-tures that it contains. To date, these are the only high-dimensional soft functional modes available. As they have been extracted from a variety of data (more than 2,000 ses-sions across 27 studies, 2.4TB in size) and improve many
analytic tasks, the rich descriptions of neural activity that they capture is well suited for a broad set of fMRI studies.
7. Acknowledgments
This project has received funding from the Euro-pean Union’s Horizon 2020 Research and Innovation Pro-gramme under Grant Agreement No. 785907 (HBP SGA2) and No 826421 (VirtualBrainCloud). The work of Arthur Mensch has been supported by the European Research Council (ERC Grant Noria). This work acknowledges the support of ANR NeuroRef and ERC-StG NeuroLang.
We also thank Pierre Bellec and Vincent Frouin for their helpful discussions on the experimental work, the neuroimaging community for giving access to fMRI datasets, and open-source contributors on the packages we build upon (including nilearn, fMRIprep, and MRIQC ).
Data collection and sharing for this project was funded by the Alzheimer’s Disease Neuroimaging Initia-tive (ADNI) (National Institutes of Health Grant U01 AG024904) and DOD ADNI (Department of Defense
award number W81XWH-12-2-0012). ADNI is funded
by the National Institute on Aging, the National In-stitute of Biomedical Imaging and Bioengineering, and through generous contributions from the following: Ab-bVie, Alzheimer’s Association; Alzheimer’s Drug Discov-ery Foundation; Araclon Biotech; BioClinica, Inc.; Biogen; Bristol-Myers Squibb Company; CereSpir, Inc.; Cogstate; Eisai Inc.; Elan Pharmaceuticals, Inc.; Eli Lilly and Com-pany; EuroImmun; F. Hoffmann-La Roche Ltd and its af-filiated company Genentech, Inc.; Fujirebio; GE Health-care; IXICO Ltd.; Janssen Alzheimer Immunotherapy Re-search and Development, LLC.; Johnson and Johnson Pharmaceutical Research and Development LLC.; Lumos-ity; Lundbeck; Merck and Co., Inc.; Meso Scale Diagnos-tics, LLC.; NeuroRx Research; Neurotrack Technologies; Novartis Pharmaceuticals Corporation; Pfizer Inc.; Pira-mal Imaging; Servier; Takeda Pharmaceutical Company; and Transition Therapeutics. The Canadian Institutes of Health Research is providing funds to support ADNI clin-ical sites in Canada. Private sector contributions are fa-cilitated by the Foundation for the National Institutes of Health (www.fnih.org). The grantee organization is the Northern California Institute for Research and Education, and the study is coordinated by the Alzheimer’s Therapeu-tic Research Institute at the University of Southern Cali-fornia. ADNI data are disseminated by the Laboratory for Neuro Imaging at the University of Southern California. 9
Abou Elseoud, A., Littow, H., Remes, J., Starck, T., Nikkinen, J., Nissil¨a, J., Tervonen, O., Timonen, M., Kiviniemi, V., 2011. Group-ica model order highlights patterns of functional brain con-nectivity. Frontiers in Systems Neuroscience 5, 37.
Abraham, A., Milham, M.P., Di Martino, A., Craddock, R.C., Sama-ras, D., Thirion, B., Varoquaux, G., 2017. Deriving reproducible biomarkers from multi-site resting-state data: An autism-based example. NeuroImage 147, 736–745.
Abraham, A., Pedregosa, F., Eickenberg, M., Gervais, P., Mueller, A., Kossaifi, J., Gramfort, A., Thirion, B., Varoquaux, G., 2014. Machine learning for neuroimaging with scikit-learn. Frontiers in neuroinformatics 8.
Altmann, A., Ng, B., Landau, S.M., Jagust, W.J., Greicius, M.D., 2015. Regional brain hypometabolism is unrelated to regional amyloid plaque burden. Brain 138, 3734–3746.
Alvarez, R., Poldrack, R., 2011. Cross-language repetition priming. Stanford Digital Repository .
Aron, A.R., Behrens, T.E., Smith, S., Frank, M.J., Poldrack, R.A., 2007. Triangulating a cognitive control network using diffusion-weighted magnetic resonance imaging (mri) and functional mri. Journal of Neuroscience 27, 3743–3752.
Aron, A.R., Gluck, M.A., Poldrack, R.A., 2006. Long-term test-retest reliability of functional mri in a classification learning task. NeuroImage 29, 1000 – 1006.
Arslan, S., Ktena, S.I., Makropoulos, A., Robinson, E.C., Rueckert, D., Parisot, S., 2017. Human brain mapping: A systematic com-parison of parcellation methods for the human cerebral cortex. NeuroImage .
Barachant, A., Bonnet, S., Congedo, M., Jutten, C., 2013. Classifi-cation of covariance matrices using a riemannian-based kernel for bci applications. Neurocomputing 112, 172 – 178.
Beckmann, C., DeLuca, M., Devlin, J., Smith, S., 2005. Investiga-tions into resting-state connectivity using independent component analysis. Philos Trans R Soc Lond B 360, 1001.
Behzadi, Y., Restom, K., Liau, J., Liu, T., 2007. A component based noise correction method (compcor) for BOLD and perfusion based fMRI. Neuroimage 37, 90.
Bellec, P., Rosa-Neto, P., Lyttelton, O., Benali, H., Evans, A., 2010. Multi-level bootstrap analysis of stable clusters in resting-state fMRI. NeuroImage 51, 1126.
Benjamini, Y., Hochberg, Y., 1995. Controlling the false discovery rate: A practical and powerful approach to multiple testing. J R STAT SOC B (Methodological) 57, 289.
Brett, M., Johnsrude, I.S., Owen, A.M., 2002. The problem of func-tional localization in the human brain. Nat Rev Neurosci 3, 243. Brier, M.R., Mitra, A., McCarthy, J.E., Ances, B.M., Snyder, A.Z., 2015. Partial covariance based functional connectivity computa-tion using ledoit–wolf covariance regularizacomputa-tion. NeuroImage 121, 29.
Brodmann, K., 1909. Vergleichende Lokalisationslehre der Grosshirn-rinde in ihren Prinzipien dargestellt auf Grund des Zellenbaues. Barth.
Calhoun, V., Sui, J., Kiehl, K., Turner, J., Allen, E., Pearlson, G., 2012. Exploring the psychosis functional connectome: Aberrant intrinsic networks in schizophrenia and bipolar disorder. Frontiers in Psychiatry .
Calhoun, V.D., Adali, T., Pearlson, G.D., Pekar, J.J., 2001. A method for making group inferences from fMRI data using in-dependent component analysis. Hum Brain Mapp 14, 140. Calhoun, V.D., Kiehl, K.A., Pearlson, G.D., 2008. Modulation of
temporally coherent brain networks estimated using ICA at rest and during cognitive tasks. Hum Brain Map 29, 828.
Catani, M., de Schotten, M.T., 2012. Atlas of Human Brain Con-nections. Oxford University Press.
Cera, N., Tartaro, A., Sensi, S.L., 2014. Modafinil alters intrinsic functional connectivity of the right posterior insula: A pharmaco-logical resting state fmri study. PLOS ONE 9, 1–12.
Chang, L.J., Gianaros, P.J., Manuck, S.B., Krishnan, A., Wager, T.D., 2015. A sensitive and specific neural signature for picture-induced negative affect. PLOS Biology 13, 1–28.
Craddock, R.C., James, G.A., Holtzheimer, P.E., Hu, X.P., Mayberg, H.S., 2012. A whole brain fMRI atlas generated via spatially constrained spectral clustering. Hum brain map 33, 1914. Dadi, K., Rahim, M., Abraham, A., Chyzhyk, D., Milham, M.,
Thirion, B., Varoquaux, G., 2019. Benchmarking functional connectome-based predictive models for resting-state fMRI. Neu-roImage 192, 115 – 134.
Damoiseaux, J.S., Rombouts, S.A.R.B., Barkhof, F., Scheltens, P., Stam, C.J., Smith, S.M., Beckmann, C.F., 2006. Consistent resting-state networks across healthy subjects. Proc Natl Acad Sci 103, 13848.
Delgado, M.R., Nystrom, L.E., Fissell, C., Noll, D.C., Fiez, J.A., 2000. Tracking the hemodynamic responses to reward and punish-ment in the striatum. Journal of Neurophysiology 84, 3072–3077. Desikan, R., S., S´egonne, F., Fischl, B., Quinn, B., T., Dickerson, B., C., Blacker, D., Buckner, R., L., Dale, A., M., Maguire, R., P., Hyman, B., T., Albert, M., S., Killiany, R., J., 2006. An auto-mated labeling system for subdividing the human cerebral cortex on MRI scans into gyral based regions of interest. Neuroimage 31, 968.
Destrieux, C., Fischl, B., Dale, A., Halgren, E., 2010. Automatic par-cellation of human cortical gyri and sulci using standard anatom-ical nomenclature. NeuroImage 53, 1 – 15.
Devlin, J.T., Poldrack, R.A., 2007. In praise of tedious anatomy. NeuroImage 37, 1033 – 1041.
Di Martino, A., Yan, C.G., Li, Q., Denio, E., Castellanos, F.X., Alaerts, K., Anderson, J.S., Assaf, M., Bookheimer, S.Y., Dapretto, M., et al., 2014. The autism brain imaging data ex-change: towards a large-scale evaluation of the intrinsic brain ar-chitecture in autism. Molecular psychiatry 19, 659–667.
Dice, L.R., 1945. Measures of the amount of ecologic association between species. Ecology 26, 297–302.
Diedrichsen, J., Balsters, J.H., Flavell, J., Cussans, E., Ramnani, N., 2009. A probabilistic mr atlas of the human cerebellum. Neu-roImage 46, 39 – 46.
Dubois, J., Adolphs, R., 2016. Building a science of individual dif-ferences from fmri. Trends in cognitive sciences 20, 425–443. Duff, E.P., Trachtenberg, A.J., Mackay, C.E., Howard, M.A., Wilson,
F., Smith, S.M., Woolrich, M.W., 2012. Task-driven ica feature generation for accurate and interpretable prediction using fmri. NeuroImage 60, 189 – 203.
Duncan, K.J., Pattamadilok, C., Knierim, I., Devlin, J.T., 2009. Consistency and variability in functional localisers. Neuroimage 46, 1018.
Eickhoff, S.B., Paus, T., Caspers, S., Grosbras, M.H., Evans, A.C., Zilles, K., Amunts, K., 2007. Assignment of functional activations to probabilistic cytoarchitectonic areas revisited. Neuroimage 36, 511.
Eickhoff, S.B., Yeo, B.T.T., Genon, S., 2018. Imaging-based parcel-lations of the human brain. Nat Rev Neurosci 19, 672.
Elliott, P., Peakman, T.C., et al., 2008. The UK biobank sample handling and storage protocol for the collection, processing and archiving of human blood and urine. Int J Epidemiology 37, 234. Esteban, O., Birman, D., Schaer, M., Koyejo, O.O., Poldrack, R.A., Gorgolewski, K.J., 2017. MRIQC: Advancing the automatic pre-diction of image quality in MRI from unseen sites. PLOS ONE 12, 1.
Esteban, O., Markiewicz, C.J., Blair, R.W., Moodie, C.A., Isik, A.I., Erramuzpe, A., Kent, J.D., Goncalves, M., DuPre, E., Snyder, M., et al., 2019. fMRIPrep: a robust preprocessing pipeline for functional MRI. Nature methods 16, 111.
Foerde, K., Knowlton, B.J., Poldrack, R.A., 2006. Modulation of competing memory systems by distraction. Proc Natl Acad Sci 103, 11778.
Friston, K., Fletcher, P., Josephs, O., Holmes, A., Rugg, M., Turner, R., 1998. Event-related fmri: Characterizing differential re-sponses. NeuroImage 7, 30 – 40.
Friston, K.J., Holmes, A.P., Worsley, K.J., Poline, J.B., Frith, C., Frackowiak, R., 1995. Statistical parametric maps in functional imaging: A general linear approach. Hum Brain Mapp , 189. Gabitov, E., Manor, D., Karni, A., 2015. Patterns of modulation in
the activity and connectivity of motor cortex during the repeated generation of movement sequences. J Cog Neurosci 27, 736. Glasser, M.F., Coalson, T.S., Robinson, E.C., Hacker, C.D.,
Har-well, J., Yacoub, E., Ugurbil, K., Andersson, J., Beckmann, C.F., Jenkinson, M., Smith, S.M., Essen, D.C.V., 2016. A multi-modal parcellation of human cerebral cortex. Nature 536, 171–178. Glasser, M.F., Sotiropoulos, S.N., Wilson, J.A., Coalson, T.S.,
Fis-chl, B., Andersson, J.L., Xu, J., Jbabdi, S., Webster, M., Polimeni, J.R., Essen, D.C.V., Jenkinson, M., 2013. The minimal prepro-cessing pipelines for the human connectome project. NeuroImage 80, 105 – 124.
Gordon, E.M., Laumann, T.O., Adeyemo, B., Huckins, J.F., Kelley, W.M., Petersen, S.E., 2014. Generation and Evaluation of a Cor-tical Area Parcellation from Resting-State Correlations. Cerebral Cortex 26, 288–303.
Gorgolewski, K., Esteban, O., Gunnar, S., Brain, W., Poldrack, R., 2017. Openneuro – a free online platform for sharing and analysis of neuroimaging data., in: 23rd Annual Meeting of the Organiza-tion for Human Brain Mapping, p. 1677.
Gorgolewski, K.J., Storkey, A., Bastin, M.E., Whittle, I.R., Ward-law, J.M., Pernet, C.R., 2013. A test-retest fmri dataset for motor, language and spatial attention functions. GigaScience 2, 2047– 217X–2–6.
Gorgolewski, K.J., Varoquaux, G., Rivera, G., Schwarz, Y., Ghosh, S.S., Maumet, C., Sochat, V.V., Nichols, T.E., Poldrack, R.A., Poline, J.B., Yarkoni, T., Margulies, D.S., 2015. Neurovault.org: a web-based repository for collecting and sharing unthresholded statistical maps of the human brain. Frontiers in Neuroinformatics 9, 8.
Goutte, C., Toft, P., Rostrup, E., Nielsen, F.A., Hansen, L.K., 1999. On clustering fMRI time series. NeuroImage 9, 298–310. Greicius, M., Krasnow, B., Reiss, A., Menon, V., 2003. Functional
connectivity in the resting brain: a network analysis of the default mode hypothesis. Proc Natl Acad Sci 100, 253.
Greve, D.N., Fischl, B., 2009. Accurate and robust brain image alignment using boundary-based registration. NeuroImage 48, 63. Griffanti, L., Salimi-Khorshidi, G., Beckmann, C.F., Auerbach, E.J., Douaud, G., Sexton, C.E., Zsoldos, E., Ebmeier, K.P., Filippini, N., Mackay, C.E., et al., 2014. ICA-based artefact removal and accelerated fMRI acquisition for improved resting state network imaging. Neuroimage 95, 232–247.
Hanson, S.J., Matsuka, T., Haxby, J.V., 2004. Combinatorial codes in ventral temporal lobe for object recognition: Haxby (2001) revisited: is there a “face” area? NeuroImage 23, 156 – 166. Harrison, S.J., Woolrich, M.W., Robinson, E.C., Glasser, M.F.,
Beckmann, C.F., Jenkinson, M., Smith, S.M., 2015. Large-scale probabilistic functional modes from resting state fmri. NeuroIm-age 109, 217 – 231.
Hastie, T., Tibshirani, R., Friedman, J., 2009. The elements of sta-tistical learning. Springer.
Haxby, J.V., Gobbini, I.M., Furey, M.L., et al., 2001. Distributed and overlapping representations of faces and objects in ventral temporal cortex. Science 293, 2425.
Haynes, J.D., Rees, G., 2006. Decoding mental states from brain activity in humans. Nat. Rev. Neurosci. 7, 523.
Henri, M.D., 1999. The Human Brain: Surface, Three-dimensional Sectional Anatomy with MRI, and Blood Supply. Springer. Hua, K., Zhang, J., Wakana, S., Jiang, H., Li, X., Reich, D.S.,
Cal-abresi, P.A., Pekar, J.J., van Zijl, P.C., Mori, S., 2008. Tract probability maps in stereotaxic spaces: Analyses of white matter anatomy and tract-specific quantification. NeuroImage 39, 336. Huntenburg, J.M., Bazin, P.L., Margulies, D.S., 2018. Large-scale
gradients in human cortical organization. Trends in cognitive sci-ences 22, 21.
Hyv¨arinen, A., Oja, E., 2000. Independent component analysis: al-gorithms and applications. Neural Networks 13, 411.
Iannilli, E., Gasparotti, R., Hummel, T., Zoni, S., Benedetti, C., Fedrighi, C., Tang, C.Y., Van Thriel, C., Lucchini, R.G., 2016. Effects of manganese exposure on olfactory functions in teenagers: A pilot study. PLOS ONE 11, 1–9.
Jenkinson, M., Bannister, P., Brady, M., Smith, S., 2002. Improved optimization for the robust and accurate linear registration and motion correction of brain images. NeuroImage 17, 825 – 841. Jimura, K., Cazalis, F., Stover, E.R.S., Poldrack, R.A., 2014. The
neural basis of task switching changes with skill acquisition. Fron-tiers in Human Neuroscience 8, 339.
Kelly, A.C., Uddin, L.Q., Biswal, B.B., Castellanos, F.X., Milham, M.P., 2008. Competition between functional brain networks me-diates behavioral variability. NeuroImage 39, 527 – 537.
Kim, J., Wang, J., Wedell, D.H., Shinkareva, S.V., 2016. Identi-fying core affect in individuals from fmri responses to dynamic naturalistic audiovisual stimuli. PLOS ONE 11, 1–21.
Kiviniemi, V., Kantola, J., Jauhiainen, J., Hyv¨arinen, A., Tervonen, O., 2003. Independent component analysis of nondeterministic fmri signal sources. Neuroimage 19, 253.
Kiviniemi, V., Starck, T., Remes, J., Long, X., Nikkinen, J., Haapea, M., Veijola, J., et al., 2009. Functional segmentation of the brain cortex using high model order group PICA. Hum Brain Map 30, 3865.
Ledoit, O., Wolf, M., 2004. A well-conditioned estimator for large-dimensional covariance matrices. J. Multivar. Anal. 88, 365. Lee, K., Tak, S., Ye, J.C., 2010. A data-driven sparse GLM for
fMRI analysis using sparse dictionary learning with MDL crite-rion. IEEE Trans Med Imag 30, 1076.
Leech, R., Kamourieh, S., Beckmann, C.F., Sharp, D.J., 2011. Frac-tionating the default mode network: Distinct contributions of the ventral and dorsal posterior cingulate cortex to cognitive control. J Neurosci 31, 3217.
Lepping, R.J., Atchley, R.A., Chrysikou, E., Martin, L.E., Clair, A.A., Ingram, R.E., Simmons, W.K., Savage, C.R., 2016a. Neural processing of emotional musical and nonmusical stimuli in depres-sion. PLOS ONE 11, 1–23.
Lepping, R.J., Atchley, R.A., Savage, C.R., 2016b. Development of a validated emotionally provocative musical stimulus set for research. Psychology of Music 44, 1012–1028.
Mennes, M., Kelly, C., Colcombe, S., Castellanos, F.X., Milham, M.P., 2013. The extrinsic and intrinsic functional architectures of the human brain are not equivalent. Cerebral Cortex 23, 223–229. Mensch, A., Mairal, J., Bzdok, D., Thirion, B., Varoquaux, G., 2017. Learning Neural Representations of Human Cognition across Many fMRI Studies, in: Neural Information Processing Systems, p. 5885.
Mensch, A., Mairal, J., Thirion, B., Varoquaux, G., 2016a. Dictio-nary Learning for Massive Matrix Factorization, in: International Conference on Machine Learning, pp. 1737–1746.
Mensch, A., Mairal, J., Thirion, B., Varoquaux, G., 2018. Stochastic Subsampling for Factorizing Huge Matrices. IEEE Trans Sig Proc 66, 113.
Mensch, A., Varoquaux, G., Thirion, B., 2016b. Compressed Online Dictionary Learning for Fast Resting-State fMRI Decomposition, in: Proc. ISBI, p. 1282.
Michel, V., Gramfort, A., Varoquaux, G., Eger, E., Keribin, C., Thirion, B., 2012. A supervised clustering approach for fMRI-based inference of brain states. Pattern Recognition 45, 2041. Miller, K.L., Alfaro-Almagro, F., et al., 2016. Multimodal
popula-tion brain imaging in the UK biobank prospective epidemiological study. Nature Neuroscience .
Moran, J.M., Jolly, E., Mitchell, J.P., 2012. Social-cognitive deficits in normal aging. J Neurosci 32, 5553.
Mori, S., Wakana, S., Van Zijl, P.C., Nagae-Poetscher, L., 2005. MRI atlas of human white matter. Elsevier.
Mour˜ao-Miranda, J., Bokde, A.L., Born, C., Hampel, H., Stetter, M., 2005. Classifying brain states and determining the discriminating activation patterns: Support vector machine on functional MRI data. NeuroImage 28, 980.
Mueller, S., Weiner, M., Thal, L., Petersen, R., Jack, C., Jagust, W., Trojanowski, J.Q., Toga, A.W., Beckett, L., 2005. The alzheimer’s disease neuroimaging initiative. Neuroimaging Clinics of North America 15, 869.
Murphy, K., Fox, M.D., 2017. Towards a consensus regarding global signal regression for resting state functional connectivity MRI. Neuroimage 154, 169–173.
Olshausen, B., Field, D., 1997. Sparse coding with an overcomplete basis set: A strategy employed by V1? Vision research 37, 3311. Ono, M., Kubik, S., Abernathey, C.D., 1990. Atlas of the cerebral
sulci. G. Thieme Verlag.
O’Toole, A.J., Jiang, F., Abdi, H., Haxby, J.V., 2005. Partially dis-tributed representations of objects and faces in ventral temporal cortex. J Cog Neurosci 17, 580.
Pedregosa, F., Varoquaux, G., Gramfort, A., et al., 2011. Scikit-learn: Machine learning in Python. Journal of Machine Learning Research 12, 2825.
Perlbarg, V., Bellec, P., Anton, J.L., Pelegrini-Issac, M., Doyon, J., Benali, H., 2007. CORSICA: correction of structured noise in fMRI by automatic identification of ICA components. Magn Reson Imaging 25, 35.
Pervaiz, U., Vidaurre, D., Woolrich, M.W., Smith, S.M., 2019. Op-timising network modelling methods for fmri. bioRxiv .
Pinel, P., Thirion, B., Meriaux, S., Jobert, A., Serres, J., Le Bihan, D., Poline, J., Dehaene, S., 2007. Fast reproducible identifica-tion and large-scale databasing of individual funcidentifica-tional cognitive networks. BMC neuroscience 8, 91.
Pinho, A.L., Amadon, A., Ruest, T., Fabre, M., Dohmatob, E., Denghien, I., Ginisty, C., Becuwe-Desmidt, S., Roger, S., Laurier, L., Joly-Testault, V., M´ediouni-Cloarec, G., Doubl´e, C., Martins, B., Pinel, P., Eger, E., Varoquaux, G., Pallier, C., Dehaene, S., Hertz-Pannier, L., Thirion, B., 2018. Individual Brain Charting, a high-resolution fMRI dataset for cognitive mapping. Scientific Data 5, 180105.
Poldrack, R.A., Barch, D.M., Mitchell, J.P., et al., 2013. Toward open sharing of task-based fMRI data: the OpenfMRI project. Frontiers in neuroinformatics 7.
Poldrack, R.A., Clark, J., Par´e-Blagoev, E.J., Shohamy, D., Creso Moyano, J., Myers, C., Gluck, M.A., 2001. Interactive mem-ory systems in the human brain. Nature 414, 546–550.
Poldrack, R.A., Halchenko, Y.O., Hanson, S.J., 2009. Decoding the large-scale structure of brain function by classifying mental states across individuals. Psychological Science 20, 1364.
Power, J., Cohen, A., Nelson, S., Wig, G., Barnes, K., Church, J., Vogel, A., Laumann, T., Miezin, F., Schlaggar, B., Petersen, S., 2011. Functional network organization of the human brain. Neu-ron 72, 665–678.
Pruim, R.H., Mennes, M., Buitelaar, J.K., Beckmann, C.F., 2015. Evaluation of ICA-AROMA and alternative strategies for motion artifact removal in resting state fMRI. Neuroimage 112, 278–287. Rademacher, J., Caviness, V. S., J., Steinmetz, H., Galaburda, A.M., 1993. Topographical Variation of the Human Primary Cortices: Implications for Neuroimaging, Brain Mapping, and Neurobiol-ogy. Cerebral Cortex 3, 313–329.
Rademacher, J., Galaburda, A.M., Kennedy, D.N., Filipek, P.A., Caviness, V.S., 1992. Human cerebral cortex: Localization, par-cellation, and morphometry with magnetic resonance imaging. J Cog Neurosci 4, 352.
Repovs, G., Barch, D., 2012. Working memory related brain network connectivity in individuals with schizophrenia and their siblings. Frontiers in Human Neuroscience 6, 137.
Richiardi, J., Eryilmaz, H., Schwartz, S., Vuilleumier, P., Van De Ville, D., 2010. Decoding brain states from fMRI connectivity graphs. NeuroImage .
Rizk-Jackson, A., Aron, A., Poldrack, R., 2011. Classification learn-ing and stop-signal (1 year test-retest). Stanford Digital Reposi-tory .
Romaniuk, L., Pope, M., Nicol, K., Steele, D., Hall, J., 2016. Neu-ral correlates of fears of abandonment and rejection in borderline personality disorder. Wellcome Open Research 1.
Roy, A., Bernier, R.A., Wang, J., Benson, M., French, Jr., J.J., Good, D.C., Hillary, F.G., 2017. The evolution of cost-efficiency in neural networks during recovery from traumatic brain injury. PLOS ONE 12, 1–26.
Sala-Llonch, R., Smith, S.M., Woolrich, M., Duff, E.P., 2019. Spatial parcellations, spectral filtering, and connectivity measures in fmri: Optimizing for discrimination. Hum Brain Map 40, 407. Schaefer, A., Kong, R., Gordon, E.M., Laumann, T.O., Zuo, X.N.,
Holmes, A.J., Eickhoff, S.B., Yeo, B.T.T., 2017. Local-Global Par-cellation of the Human Cerebral Cortex from Intrinsic Functional Connectivity MRI. Cerebral Cortex 28, 3095–3114.
Schmahmann, J.D., Doyon, J., McDonald, D., Holmes, C., Lavoie, K., Hurwitz, A.S., Kabani, N., Toga, A., Evans, A., Petrides, M., 1999. Three-dimensional mri atlas of the human cerebellum in proportional stereotaxic space. NeuroImage 10, 233 – 260. Schonberg, T., Fox, C., Mumford, J., Congdon, E., Trepel, C.,
Pol-drack, R., 2012. Decreasing ventromedial prefrontal cortex ac-tivity during sequential risk-taking: An fmri investigation of the balloon analog risk task. Frontiers in Neuroscience 6, 80. Shirer, W., Ryali, S., Rykhlevskaia, E., Menon, V., Greicius, M.,
2012. Decoding subject-driven cognitive states with whole-brain connectivity patterns. Cerebral Cortex 22, 158.
Smith, R., Keramatian, K., Christoff, K., 2007. Localizing the ros-trolateral prefrontal cortex at the individual level. NeuroImage 36, 1387 – 1396.
Smith, S., Fox, P., Miller, K., Glahn, D., Fox, P., Mackay, C., et al., 2009. Correspondence of the brain’s functional architecture during activation and rest. Proc Natl Acad Sci 106, 13040.
Smith, S., Miller, K., Salimi-Khorshidi, G., Webster, M., Beckmann, C., Nichols, T., Ramsey, J., Woolrich, M., 2011. Network mod-elling methods for fMRI. Neuroimage 54, 875.
Sporns, O., Tononi, G., Kotter, R., 2005. The human connectome: a structural description of the human brain. PLoS Comput Biol 1, e42.
Stephan-Otto, C., Siddi, S., Senior, C., Mu˜noz-Samons, D., Ochoa, S., S´anchez-Laforga, A.M., Br´ebion, G., 2017. Visual imagery and false memory for pictures: A functional magnetic resonance imaging study in healthy participants. PLOS ONE 12, 1–17.