HAL Id: hal-00941048
https://hal-mines-paristech.archives-ouvertes.fr/hal-00941048
Submitted on 3 Feb 2014
HAL is a multi-disciplinary open access archive for the deposit and dissemination of sci-entific research documents, whether they are pub-lished or not. The documents may come from teaching and research institutions in France or abroad, or from public or private research centers.
L’archive ouverte pluridisciplinaire HAL, est destinée au dépôt et à la diffusion de documents scientifiques de niveau recherche, publiés ou non, émanant des établissements d’enseignement et de recherche français ou étrangers, des laboratoires publics ou privés.
Damien Colas, E. Finot, Sylvain Flouriot, Samuel Forest, Fréderic Herbst, Y.
Lacroute, Matthieu Mazière, T. Paris
To cite this version:
Damien Colas, E. Finot, Sylvain Flouriot, Samuel Forest, Fréderic Herbst, et al.. Strain field mea-surements in polycrystalline tantalum. 21ème Congrès Français de Mécanique, CFM 2013, Aug 2013, Bordeaux, France. 6 p. �hal-00941048�
Strain field measurements in polycrystalline tantalum
D. Colasa,b,c, E. Finota, S. Flouriotb, S. Forestc, F. Herbsta, Y. Lacroutea, M. Mazi`erec, T. Parisb
a. Laboratoire Interdisciplinaire Carnot de Bourgogne, CNRS, UMR 5209
Universit´e de Bourgogne, 9, avenue Alain Savary, BP 17870, 21078 Dijon Cedex, France e-mail: [email protected]
b. CEA Valduc, 21120 Is-sur-Tille, France
c. Mines ParisTech, Centre des Mat´eriaux CNRS, UMR 7633 BP 87, 91003 Evry Cedex, France
R´
esum´
e :
La compr´ehension et la quantification des m´ecanismes de d´eformation `a l’´echelle locale est un ´el´ement cl´e de l’analyse de l’amor¸cage de fissure. Des essais avec suivi de d´eformation ont ´et´e r´ealis´es en se basant sur la construction de cartes de d´eformation de plusieurs centaines de microm`etres de cˆot´e ; `
a partir de grilles constitu´ees de plots microm´etriques r´eguli`erement espac´es d´epos´es sur le tantale par un proc´ed´e de lithographie. Le calcul des d´eformations des grilles `a partir d’un programme d´edi´e permet de quantifier l’´evolution et la localisation de la d´eformation `a l’´echelle du grain ou de quelques grains dans le cadre d’essais interrompus.
Abstract :
The unterstanding and the local quantification of surface strain distribution is a key element of crack initiation analysis. Experiments following up the local strain distribution have been carried out, based on the construction of several hundred micrometers wide strain maps ; and using gratings of regularly spaced micrometric markers deposited by lithography. The strain maps are computed using a specific routine, allowing to quantify the local strain distribution at the grain scale for different interrupted tensile loads.
Mots clefs :
Crack Initiation ; Strain Distribution ; Lithography1
Introduction
In order to extend the knowledge of polycrystalline tantalum mechanical behaviour, a thorough study of the physical phenomena at the scale of the heterogeneities is necessary. Thus, interactions between the individual grains are not completely understood (for example grain boundaries, grain neighbou-rhood effect, etc.). Moreover, the specific thermo-mechanical environment confers to tantalum an uncommon macroscopic behaviour, caracteristic of BCC metals and mainly due to static strain ageing effect [14, 8, 2, 3, 7].
In addition, crack initiation in mechanical fatigue can be either transgranular for “high” temperatures and/or “low” strain rates or intergranular of “low” temperatures and/or “high” strain rates. Room temperature lies within the transition domain between those two mechanisms [11].
The improvement of numerical and experimental techniques allows to investigate strain localization phenomena at the scale of a few grains. Thus, it is possible to study the local strain inside the grain or on both sides of a grain boundary. Many studies on surface strain distribution have been performed on many materials, using various analysis methods [5, 9, 10, 15].
The present study uses gratings of regularly spaced micrometric markers deposited by electron beam lithography [1, 18]. This method allows an early detection of microplasticity initiation, even before reaching the macroscopic yield point.
Our goal is to find a method which is sufficiently predictive on crack propagation.
In the present paper, the macroscopic behaviour of tantalum is first presented. After exposing the experimental procedure, our measurements of the local strain distribution are analysed and discussed.
2
Macroscopic behaviour
(a) (b)
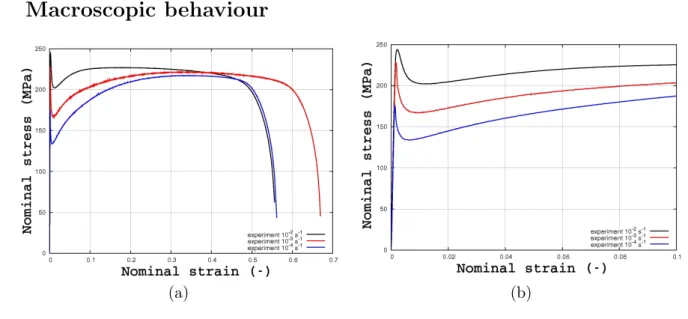
Fig. 1 – Tensile test at room temperature for three strain rates ˙ε = 10−4 s−1, ˙ε = 10−3 s−1 and 10−2 s−1. (a) Complete tensile test, (b) zoom on the first ten percent.
The macroscopic stress-strain response of tantalum at room temperature and for several strain rates is presented on Fig. 1. We can notice a strong strain rate sensitivity, a sharp yield point and high ductility. The sharp yield point is due to the unpinning of dislocations from solute atoms (mainly C, N, O) atmospheres. Thus, an additional stress is required in order to unpin them, leading to a macroscopic stress drop [14, 8, 2, 3, 7].
Because of this unpinning process at the yield threshold and for small strain loadings, plasticity may localize in some favorably oriented regions, which accommodate the major part of the plastic strain. Moreover, a strong interaction between the strain amplitude for cyclic loadings and the cyclic harde-ning have been observed, and are linked to interaction between dislocation families [4, 11, 12, 16, 17]. These basic facts led us to the study of the microscopical underlying phenomena, through the construc-tion of microgrids.
3
Experimental Procedure
3.1
Grid deposition
The grid is built in six successive steps [1, 18] :
– Substrate preparation : mechanical polishing and OPS finishing – Resin depositing : centrifugation of a thin PMMA layer
– Electron Beam Lithography : modified SEM-FEG JEOL controlled by computer. Building of the negative (mask) of the grating
– Resin dissolving by US bath
– Development : lift-off in a solvent
Several grids have been deposited along the sample, using a specific “checkerboard pattern” shown on Fig. 2 over 400x400 µm2, with 50x50 µm2 grids. They are composed of ”large-size“ markers of 1 µm diameter and 10 µm pitch and ”small-size“ markers of 100 nm diameter large and 2 µm pitch. The nickel used for the metallization allows a sufficient chemical contrast for the backscattered SEM images.
The Electron Beam Lithography method is quite time consuming for large scale patterns, and thus a compromise between insolation time and covered surface versus spatial resolution has been chosen. The tensile tests have been carried out using a Zwick 100 kN electro-mechanical machine. The sample has a 15 mm gauge length and a 9x3 mm2 cross section.
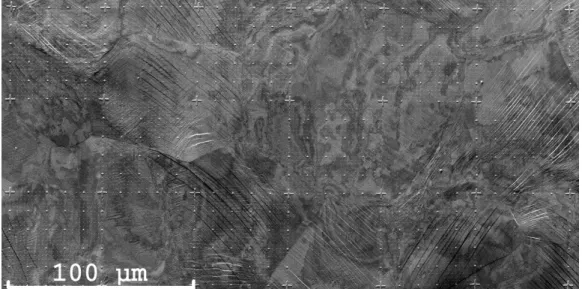
Fig. 2 – Partial checkerboard pattern after 1.8% of macroscopic plastic strain.
3.2
Strain calculation
Several methods implemented have been compared. For rather small deformations and rotation, the difference between the strain calculation methods is smaller than 10 percent.
The method presented here is the so-called ”infinitesimal strain method“ and uses the displacement gradient [13, 19].
ε11= U1,1; ε22= U2,2; ε12= 12(U1,2+ U2,1)
with Ui,j = ∂U∂xji
For a smooth description of the strain a cubic interpolation is computed for pixels between markers.
4
Results and discussion
An interrupted tensile test divided into four steps of macroscopic plastic strain (0.15%, 0.3%, 0.8% and 1.8% ) has been carried out at room temperature and ˙ε = 10−3 s−1. The macroscopic strain-stress response is shown on Fig. 3. The first unloading has been done at the beginning of the stress drop. Two macroscopic bands were visible on the polished surface of the sample, near the fillets. SEM images of those regions show many slip bands inside the grains, whereas in the center region nothing occurs. Moreover, some grains present many slip bands, while some other neighboring grains are undeformed (cf. Fig. 2). This localization is due to both grain orientation and a grain cluster effect. For a better
Fig. 3 – Interrupted tensile test at 0.15%, 0.3%, 0.8% and 1.8% of macroscopic plastic strain.
(a) (b) (c)
(d) (e)
Fig. 4 – SEM images on a 50x50 µm2 grid for severals steps : (a) initial grid, (b) 0.15%, (c) 0.3%, (d) 0.8% and (e) 1.8% of macroscopic plastic strain. The tensile direction corresponds to the horizontal direction. Distance between ”large-size“ crosses : 50 µm, distance between ”small-size“ crosses : 10 µm, distance between dots : 2 µm.
understanding, EBSD scans would be very useful and are in progress.
One typical 50x50 µm2 grid 3 mm away from a fillet has been chosen. Its evolution for each strain step is depicted on Fig. 4. We can notice that the first step is elastic, and no slip band appears. Howe-ver, after 0.8% of macroscopic plastic strain, some slip bands appear inside the left grain (thin dark lines). Two slip systems seem to be active, while the grain on the right remains elastic. After 1.8% strain, the region near the grain boundary becomes completely uneven, and markers are therefore hard to find. The right grain is still elastic, and the main part of the global strain is accomodated by the grain boundary region. Some intense bands parallel to the grain boundary appears in this region.
(a) (b) (c)
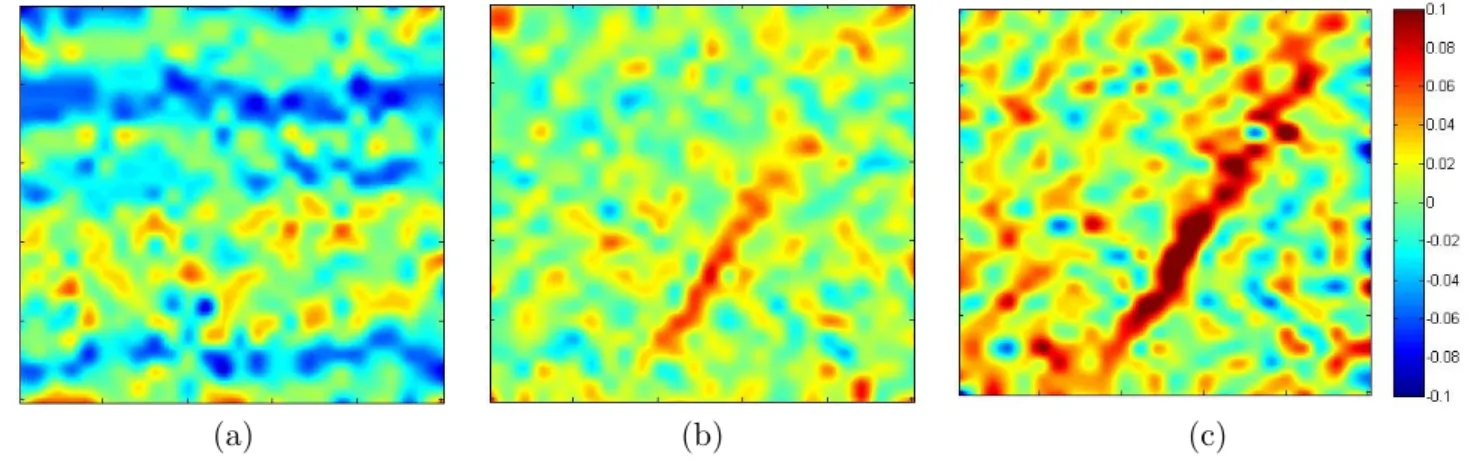
Fig. 5 – Local strain distributions (a) ε11, (b) ε12 and (c) ε22 of a 50x50 µm2 grid at 1.8% of
macroscopic plastic strain (step 4). The tensile direction correspond to the horizontal direction.
The local strain distribution of this region is shown for the last tensile step (εp = 1.8%) on Fig. 5.
The vertical direction corresponds to the direction 1, and the horizontal one to the direction 2, which is the macroscopic tensile direction.
We can see that the strain is localized at the grain boundary, where the local longitudinal strain ε22
can reach a value one order of magnitude higher (1.8% of macroscopic plastic strain for more than 15% of local plastic strain) : the grain boundary is finally grooved (see Fig. 4). The rest of the strain map is close to the macroscopic value, even if the noise is rather high. Some compressive region in the direction 1 is visible above the slip bands. It is important to keep in mind that all these measurements neglet the out of plane strains, which can be significant for strains localized near grain boundaries. We can notice that the lithography method and the marker’s adhesion on the substrate is completely adequate, because no marker has been pulled out during the successive steps.
5
Conclusions
The surface strain of polycrystalline tantalum has been studied using a local measurement method, giving a direct insight about the strain localization at the grain scale. In some region, the local plastic strain can be rather high, even if the macroscopic strain is still low : 1.8% macroscopic for more than 15% of local plastic strain.
The Electron Beam Lithography method has been fully validated, with reliable marker adhesion and a regular grid pattern.
The main prospect for the future is the investigation of more complex and fatigue loadings, in order to detect more accurately the local crack initiation. In that sense, a combination with ESBD measu-rements of the same areas would be a great improvement.
R´
ef´
erences
[1] Clair, A., Foucault, M., Calonne, O., Lacroute, Y., Markey, L., Salazar, M., Vignal, V., Finot, E. 2011 Strain mapping near a triple junction in strained Ni-based alloy using EBSD and biaxial nanogauges Acta materialia 59 3116-3123
[2] Cottrell, A., Bilby, B. 1949 Dislocation theory of yielding and strain ageing of iron. Proc. Phys. Soc. Conf. A 62 49-62
[3] Elliot, R.A., Orowan, E. 2004 Absence of yield points in iron on strain reversal after ageing and the Bauschinger overshoot. Mechanics of Materials 36 1143-1153
[4] Friedel, J. 1964 Dislocations Pergamon Press
[5] Goldrein, H.T., Palmer, S.J.P., Huntley, J.M. 1995 Automated fine grid technique for measurement of large strain deformation maps Optics and Lasers in Engineering 23 305-318
[6] Hatanaka, K., Fujimitsu, T., Inoue, H. 1992 A measurement of the three-dimensional strains around a reep-crack tip. Experimental Mechanics pp. 211-217
[7] Hoge, K.G., Mukherjee, A.K. 1977 The temperature and strain rate dependance of the flow stress of tantalum Journal of Materials Science 12 1666-1672
[8] L¨uders, W. 1860 Dingler’s Polytech 155 18
[9] Meurs, P.F.M., Schreurs, P.J.G., Peijs, T., Meijer, H.E.H. 1996 Characterization of interphase conditions on composite materials Composites Part A 27A 781-786
[10] Moulart, R., Rotinat, R., Pierron, F., Lerondel, G. 2007 On the realization of microscopic grids for local strain measurement by direct interferometric photolithography Optics and Lasers in En-gineering 45 1131-1147
[11] Mughrabi, H., Herz, K., Stark, X. 1981 Cyclic deformation and fatigue behavior of alpha-iron mono- and poly-crystals. International Journal of Fracture 17 193-220
[12] Mughrabi, H. and Wang, R. and Differt, K. and Essmann, U. 1983 Fatigue crack initiation by cyclic slip irraversibilities in High-Cycle Fatigue, Fatigue Mechanisms : Advances in quantitative measurment of physical damage. ASTM STP 811 5-45
[13] Paris, T. 2008 Mod´elisation du comportement m´ecanique des liaisons soud´ees h´et´erog`enes Ta/TA6V4 : comportement et crit`ere de rupture PhD thesis, Universit´e de Technologie de Troyes [14] Piobert, G. 1842 M´emoires de l’Artillerie V 505
[15] Rae, P.J., Goldrein, H.T., Bourne, N.K., Proud, W.G., Forde, L.C., Liljekvist, M. 1999 Measure-ment of dynamic large-strain deformation maps using an automated fine grid technique Optics and Lasers in Engineering 31 113-122
[16] Suresh, S. 1998 Fatigue of Materials Cambridge University Press
[17] Takao, K. and Kusukawa, K. 1996 Low-Cycle Fatigue behavior of commercially pure titanium Materials Science and Engineering A 213 81-85
[18] Vignal, V. Finot, E., Oltra, R. Lacroute, Y., Bourillot, E., Dereux, A. 2004 Mapping the 3D-surface strain field of patterned tensile stainless steels using atomic force microscopy Ultramicroscopy 103 183-189
[19] Wissuchek, D.J., Mackin, T.J., DeGraef, M., Lucas, G.E., Evans, A.G. 1996 A simple method for measuring surface strains around cracks Experimental mechanics 173-179