HAL Id: hal-01184543
https://hal.inria.fr/hal-01184543
Submitted on 15 Aug 2015
HAL is a multi-disciplinary open access
archive for the deposit and dissemination of
sci-entific research documents, whether they are
pub-lished or not. The documents may come from
teaching and research institutions in France or
abroad, or from public or private research centers.
L’archive ouverte pluridisciplinaire HAL, est
destinée au dépôt et à la diffusion de documents
scientifiques de niveau recherche, publiés ou non,
émanant des établissements d’enseignement et de
recherche français ou étrangers, des laboratoires
publics ou privés.
Challenges to Validate Multi-physics Model of Liver
Tumor Radiofrequency Ablation from Pre-clinical Data
Chloé Audigier, Tommaso Mansi, Hervé Delingette, Saikiran Rapaka, Tiziano
Passerini, Viorel Mihalef, Raoul Pop, Michele Diana, Luc Soler, Ali Kamen, et
al.
To cite this version:
Chloé Audigier, Tommaso Mansi, Hervé Delingette, Saikiran Rapaka, Tiziano Passerini, et al..
Chal-lenges to Validate Multi-physics Model of Liver Tumor Radiofrequency Ablation from Pre-clinical
Data. Computational Biomechanics for Medicine X, Oct 2015, Munich, Germany. pp.29-40.
�hal-01184543�
Challenges to Validate Multi-physics Model of
Liver Tumor Radiofrequency Ablation from
Pre-clinical Data
Chlo´e Audigier1,2, Tommaso Mansi2, Herv´e Delingette1, Saikiran Rapaka2,
Tiziano Passerini2, Viorel Mihalef2, Raoul Pop3, Michele Diana3, Luc Soler3,4,
Ali Kamen2, Dorin Comaniciu2, Nicholas Ayache1
1 Inria Sophia-Antipolis, Asclepios Research Group, Sophia-Antipolis, France 2
Siemens Corporate Technology, Imaging and Computer Vision, Princeton, NJ, USA
3 IHU, Strasbourg, France 4
IRCAD, Strasbourg, France
Abstract. The planning and interventional guidance of liver tumor ra-diofrequency ablation (RFA) is difficult due to the cooling effect of large vessels and the large variability of tissue parameters. Subject-specific modeling of RFA is challenging as it requires the knowledge of model geometry and hemodynamics as well as the simulation of heat transfer and cell death mechanisms. In this paper, we propose to validate such a model from pre-operative multi-modal images and intra-operative signals (temperature and power) measured by the ablation device itself. In par-ticular, the RFA computation becomes subject-specific after three levels of personalization: anatomical, heat transfer and a novel cellular necro-sis model. We propose an end-to-end pre-clinical validation framework that considers the most comprehensive dataset for model validation. This framework can also be used for parameter estimation and we evaluate its predictive power in order to fully assess the possibility to personalize our model in the future. Such a framework would therefore not require any necrosis information, thus better suited for clinical applications. We evaluated our approach on seven ablations from three healthy pigs. The predictive power of the model was tested: a mean point to mesh error between predicted and actual ablation extent of 3.5 mm was achieved.
1
Introduction
Subject-specific modeling of liver tumor radiofrequency ablation (RFA) can pro-vide additional guidance to radiologists during the intervention and improve the planning of the procedure, which are challenged by inter-subject variability in tis-sue characteristics, the heterogeneous cooling effect of large neighboring vessels, porous circulation and blood coagulation. More specifically, such models could help clinicians in deciding where to place the heating probe and for how long heating must be applied. Several approaches have been developed to describe and simulate RFA of liver tumors. They differ in their choice of the biophysical phenomena that are considered and the type of experimental data used to design
and validate them. All simulations are based on the bioheat equation considering a cooling effect that is either diffuse [1] or localized at neighboring vessels [2–5]. Furthermore, the cooling effect due to venous flow in the liver parenchyma is also considered in [4, 5]. Few authors [2, 4, 5] have proposed to simulate RFA on realistic subject-specific geometries extracted from images and only [6] has personalized biophysical parameters on patient data in order to minimize the discrepancy between simulated and measured necrotic (ablated) regions.
Up to now, the comparison between simulated and measured necrotic regions has been used by several authors [2, 4–6] as the main criteria of success in pre-dicting the effect of RFA on abdominal tumors, for either model validation or personalization. However, the necrosis of tissue is the resultant of several com-bined physical phenomena, mainly the heat transfer and cell death mechanisms, meaning that a given ablated region may be explained by several combinations of parameters. In addition to this identifiability issue, the size of the tumor extent can only be known reliably from post-operative imaging which makes it difficult to eventually update the ablation plan during the procedure. A method that relies also on pre-operative or interventional data for parameter identification is therefore required for RFA models to be clinically useful.
In this paper, an extended validation strategy of RFA is introduced, based also on delivered electrical power during ablation and temperature drop during cooling in addition to the extent of ablated regions. This approach leads to an increased confidence in the computed temperature map, a clinical surrogate for tissue damage during intervention. Furthermore, the probe temperature and delivered power are information that are readily available, in real-time, from the RF system and therefore could be used to update the therapy plan during the intervention.
The RFA computational model becomes subject-specific after three levels of personalization: anatomical, heat transfer and cellular necrosis. The computa-tional model, implemented using the Lattice-Boltzmann Method (LBM), relies on anatomies extracted from CT and device-based measurements (Sec. 3).
The proposed approach was successfully tested on seven surrogate hepatic tumors implanted on three healthy swines. Following the validation, we showed how this framework can be used for personalization. Parameter estimation was performed on two tumors to select a subject-specific set of parameters (Sec. 4). It lead to accurate predictions for both temperature evolution and necrotic re-gion extension: mean error between measured and simulated temperature of 12.0◦C, mean point-to-mesh error between predicted and actual ablation extent of 3.5 mm.
2
Pre-clinical Study for Model Validation
2.1 Experimental Setup
Pigs are considered as a relevant animal model as their hepatic system is similar to the human one. The extensive pre-clinical study includes three swines. Sev-eral surrogate tumors (diameters < 3cm) were inserted at various locations of
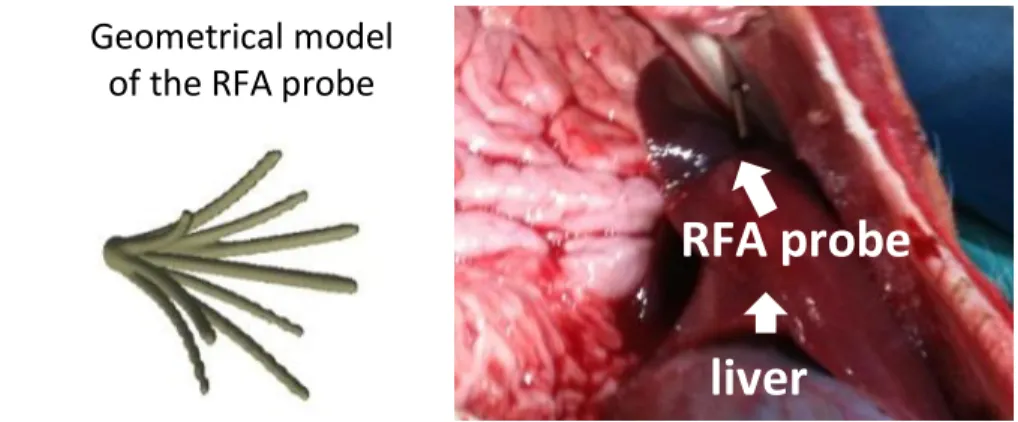
RFA probe
liver
Geometrical model
of the RFA probe
Fig. 1: (Left ): Mesh model of the probe with the 9 tips derived from a CT image of the probe only; (Right ): Photo of the probe inside the pig liver.
the liver (close to vessels or Glisson capsule) under ultrasound (US) guidance, followed by the acquisition of pre-operative CT images including portal, venous and arterial phases. The surrogate tumors were made of a specific gel which exhibited a hyper-intense signal in CT. An MR-compatible RFA probe (RITA, AngioDynamics) was deployed at 2cm of diameter under US guidance (Fig.1, right panel). An MR image was then acquired to get the position of the probe in the liver. The temperature and delivered power were monitored and recorded intra-operatively during and after the ablation. Finally, a post-operative CT or T2 MRI was acquired two days after the ablation to assess the extent of the necrotic areas. Overall, pre-, intra- and post-operative images were available, along with interventional device measurements. To the best of our knowledge, no such validation setup has been reported in the literature.
2.2 Data Preprocessing
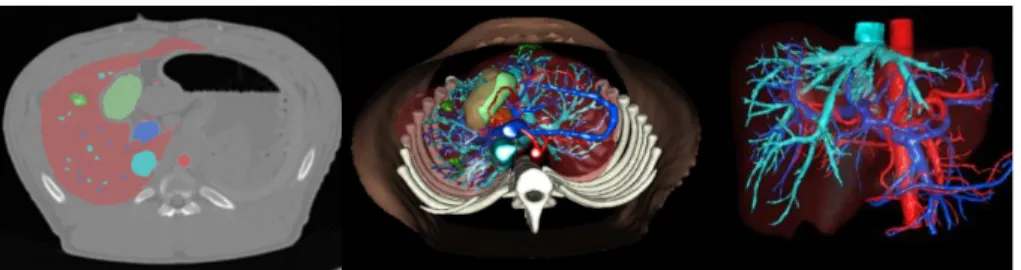
From the pre-operative CT data, the following anatomical structures were seg-mented semi-automatically by experts (Visible Patient, Strasbourg, France) and meshed (Fig. 2): the parenchyma, all tumors, hepatic veins, vena cava, portal vein, biliary vesicle and hepatic arteries. From post-operative CT or MR data, necrotic areas were segmented and meshed as well. Due to ethical reasons, CT with contrast agent could not be acquired two days after intervention, making accurate pre- to post-operative registration nearly impossible.
2.3 3D Modelling of the RFA Probe
The geometry of the probe when deployed at 2cm (the diameter of the area defined by the tips of the probe is 2cm) was acquired from a CT image of the probe only. A 3D mesh was then reconstructed (Fig.1, left panel) and manually registered on the pre-operative CT using the main axis of the probe and the intra-operative MR data. The rigid registration was visually checked by an expert up
Fig. 2: Segmentation of the liver, arterial vessels, portal and hepatic networks, surrogate tumors and biliary vesicle. (Left ): Overlay of the segmented areas on pre-operative CT image. (Middle): Creation of the 3D model. (Right ): Vessels and liver parenchyma.
to a rotation along its axis since the MR resolution did not allow to distinguish the nine tips of the probe.
3
Subject-Specific RFA Model
3.1 Heat Transfer Model
The bioheat equation describes how the heat flows from the probe through the liver while taking into account the cooling effect of the main vessels, as proposed in the Pennes model [7]. The temperature T is computed by solving the following reaction-diffusion equation:
ρtct
∂T
∂t = Q + ∇ · (dt∇T ) + R(Tb0− T ) (1) where ρt, ct, dtare the density, heat capacity, conductivity of the tissue, Q, the
source term, R, the reaction coefficient and Tb0the blood temperature (assumed
constant) in large vessels. In this study, the blood flow within the parenchyma considered as a porous medium is not taken into account as how it affects the overall cooling has not been clearly quantified in the literature, in particular when compared to the diffusive effect. Nonetheless our model includes the cool-ing effect, also called heat sink effect, of all hepathic large vessels (veins and arteries). Eq. (1) is solved using the Lattice Boltzmann Method (LBM) for fast computation on general purpose Graphics Processing Units (GPU). LBM has been developed for CFD and is now a well-established discretization method. Verification of the implementation has been performed through a comparison with an analytical solution and it has the advantage over FEM to be easily par-allelized in GPU [4]. An isotropic Cartesian grid with 7-connectivity topology and Neumann boundary conditions at the boundaries of the liver is employed. A Multiple-Relaxation-Time (MRT) model is used for increased stability [8]. For a time step of ∆t = 0.5s, faster than real-time computation can be achieved on a standard desktop machine (Windows 7, Intel Xeon, 3.30GHz, 16GB RAM, 12 CPUs, Nvidia Quadro K5000 4.0 GB).
3.2 Cellular Necrosis Model
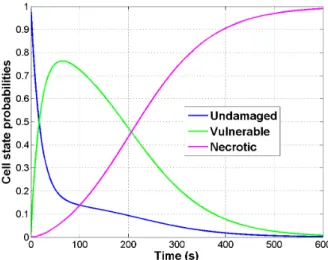
A three-state model [9] is coupled with the bioheat equation to compute tissue necrosis. Each cell has a probability to be either undamaged (U), vulnerable (V) or necrotic (N). Those probabilities vary with the simulated temperature over time according to the following state equation:
U β(T ) −−−→ ←− γ V δ(T ) −−−→ N (2)
where β(T ) = ¯βeT /Tk, δ(T ) = ¯δeT /Tk(1 + 10N ) and γ are the transition rates.
Unlike in [10], three distinct transition rates are considered to allow cells to reach the vulnerable state. (Fig. 3) represents the solution at one vertex over time if a constant temperature of 105◦C is applied. The cell death model is strongly coupled to the bioheat equation. More specifically, it depends on the temperature computed based on the bio-heat model (the transition rates β(T ), δ(T ) are temperature dependent), whose parameters depend on the state of the cell (the heat capacity depends on the state of the cell: cUt, cVt and cNt correspond
respectively to the heat capacity of undamaged, vulnerable and necrotic tissue). Eq. (2) gives three coupled ODEs that are solved with a first order explicit scheme on the same grid and with the same time step as the bioheat equation. For the heat transfer and cell death models, parameters are initially set to values from the literature [7], Table 1 reports them. The conductivity dt depends on
the temperature through dt= ¯dt∗ (1 + 0.00161 ∗ (T − 310)) as in [5].
Table 1: Nominal Value of Model Parameters.
Notation Parameter Name Nominal Value
γ (s−1) recovery rate coefficient 7.7×10⁻³
¯
β (s−1) damage rate coefficient 3.3×10⁻³
¯
δ (s−1) vulnerable rate coefficient 3.3×10⁻³ cVt (J(kg K)
−1
) heat capacity of vulnerable tissue 3.6 ×10³ cNt (J(kg K)−1) heat capacity of necrotic tissue 0.67×10³
cUt (J(kg K)−1) heat capacity of undamaged tissue 3.6 ×10³
¯
dt (W(m K)−1) heat conductivity 0.512
3.3 Parameter Estimation from Probe Measurements
Computation of Heating Power. During the intervention, the delivered power and the temperature distribution are measured by the ablation probe itself. We assume that the measured power is actually strongly correlated (pro-portional) to the heat power P (t) delivered through radio-frequency to heat the liver tissue. Proportionality is assumed to account for power dissipation due to electrical resistance, and the unknown surface ratio of the probe being heated. The heat power P (t) delivered to the tissue can be computed at each time step of the simulation from the bioheat equation according to Fourier’s law:
P (t) = Z S dt ∂T (t) ∂n dS (3)
where S is the probe surface and n is the outer normal at that surface. During our experiments, the measured electrical power appeared to reach its maximum during the increase in temperature, before reaching the plateau of 105◦C (Fig. 6). This phenomena cannot be explained by a constant heat capacity which would lead to a peak after the plateau is reached. Instead, this observation suggests that the cells reach their vulnerable state faster. Thus we update our necrosis model accordingly: after studying the ODEs of the model and a sensitivity analysis on its parameters, ¯δ has been modified such that tissues reach very fast their vulnerable state which entails a significant change of heat capacity (Table 3). Cooling Stage. RFA is simulated by imposing the measured temperature at the tips of the probe (Dirichlet boundary condition) until the heating stops at a given time t = ta. In the absence of any delivered heat power, the nine tips of
the probe cool down at a speed which depends on the conductivity dt and the
heat capacity ct. Thus during the cooling period tc− ta (cooling stops at time
t = tc), the simulated temperature Tscan be compared with the measurements
Tmread from five tips of the probe (four tips do not have any thermistors).
Personalization. After a sensitivity analysis, we chose to estimate the heat capacity cU
t and the constant part of the conductivity ¯dtas they mainly influence
the delivered power, the temperature distribution and the size of ablated regions. These two parameters are personalized from probe measurements (temperature
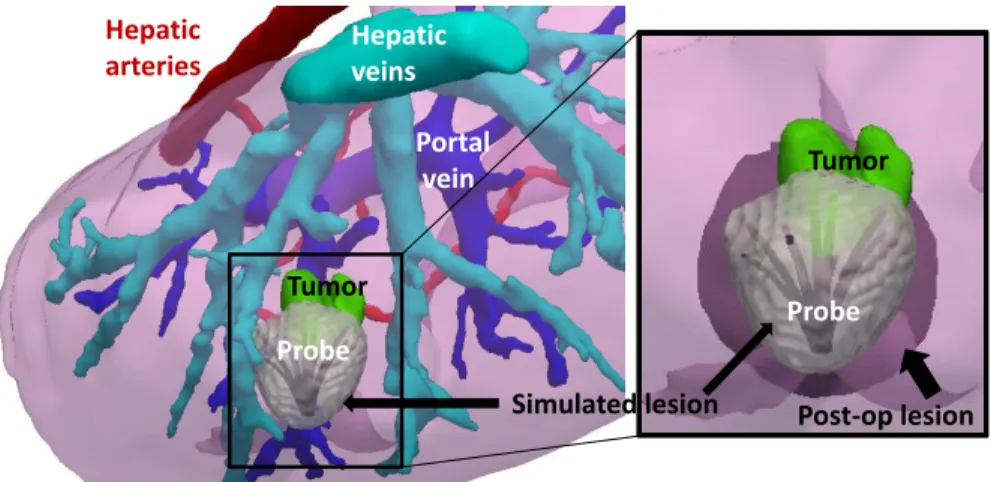
Hepatic arteries Portal vein Tumor Probe Hepatic veins Probe Tumor Post-op lesion Simulated lesion
Fig. 4: Comparison between the simulated and the post-operative necrotic areas on tu-mor 2-1. (Left ): The simulated lesion is showed around the RFA probe in the subject-specific geometry. (Right ): Zoom on the ablation area, the simulated lesion is qualita-tively close to the registered post-operative lesion.
and power) by minimizing the following cost function:
f = 1 ta t=ta−1 X t=0 (Pm(t) − Ps(t))2 σ2 Pm + 1 tc− ta t=ta+tc X t=ta (mTm(t) − mTs(t)) 2 σ2 Tm (4)
where σP mand σT mare the standard deviations associated with the heat power
and the temperature, both of them evaluated from the variability in the avail-able observations (equal to 13.3 and 5 in our experiments). To cope with the uncertainty in the rotation of the probe along its axis, the mean tip temperature mT is used for the personalization.
Using DAKOTA1, a gradient-free optimization method, the Constrained
Op-timization BY Linear Approximations (COBYLA), is used to minimize the cost function Eq. (4) as only a few forward simulations (typically 20) are required. COBYLA is a sequential trust-region algorithm. Initially, the total domain of parameters is visited (here: dt: 0.51 to 6.14, cUt: 18 to 3618) and then the region
is contracted. The estimation took around 13 hours (25 iterations).
4
Evaluation on Swine Data
4.1 Model Validation
The model was evaluated on seven ablations performed in three swines. The ap-plied RFA protocol was not exactly the same for all ablations. Five ablations were performed through several short cooling and heating periods, whereas the other
1
h
c
h
c
h
c
heating
cooling
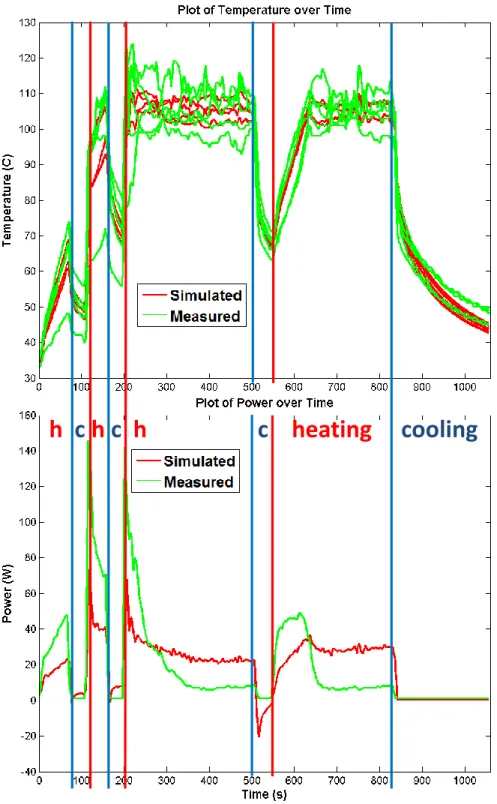
Fig. 5: Comparison between the simulated and the measured temperature on tumor 3-1. During the heating phase, the temperature is imposed, the power is simulated and compared to the measured one. During the cooling phase, the simulated (non-imposed) temperature is compared to the measured one.
Table 2: Evaluation on Pig Data. Pig Necrotic Point-to-mesh error 1 3.71 ± 2.49 mm 2-1 4.06 ± 1.59 mm 2-2 4.02 ± 1.35 mm 2-3 2.46 ± 1.35 mm 3-1 3.80 ± 2.39 mm 3-2 4.85 ± 2.13 mm 3-3 2.13 ± 1.71 mm
two ablations included only one long final cooling stage after a continuous heat-ing period. For all pigs, nominal value of parameters (reported on Table 1) were employed. In each case, the simulated lesion was compared with the registered ground-truth. Due to the uncertainty in the registration of the post-operative image to the pre-operative image, the necrotic lesion segmented on the post-operative image is registered rigidly to the pre-post-operative image by aligning its barycenter with the barycenter of the simulated necrosis. Fig. 4 shows results for tumor 2-1, in this case, the model under-estimate the lesion size. Quantita-tively, point-to-mesh errors [11] computed between the simulated lesion and the registered post-operative ground-truth showed good prediction of the necrotic extent (3.5mm of mean point-to-mesh error). Values are reported in Table 2. The prediction of the necrosis extent was valid up to 5mm which can be considered as sufficient for clinical applications. Qualitatively, as one can see on Figure 5, the simulated heat power and temperature were close to the heat power and the temperature given by the RFA probe itself.
4.2 Towards Model Personalization
As the data came from healthy pigs of similar age and weight, we hypothesized that the parameters would be the same for all of them. The personalization based on the probe temperature and power was performed for the two tumors with final cooling stage as it was long enough to observe reliably the effect of the conductivity dt, yielding two sets of personalized heat capacity and conductivity
values, reported in Table 3. We validated not only the ability to personalize the model but also its predictive power by evaluating the simulation results on
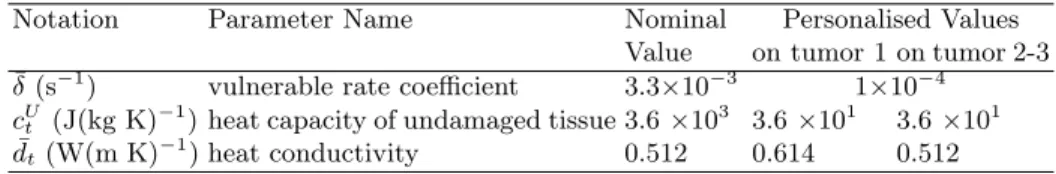
Table 3: Parameters values.
Notation Parameter Name Nominal Personalised Values
Value on tumor 1 on tumor 2-3 ¯
δ (s−1) vulnerable rate coefficient 3.3×10⁻³ 1×10⁻⁴ cUt (J(kg K)
−1
) heat capacity of undamaged tissue 3.6 ×10³ 3.6 ×101 3.6 ×101 ¯
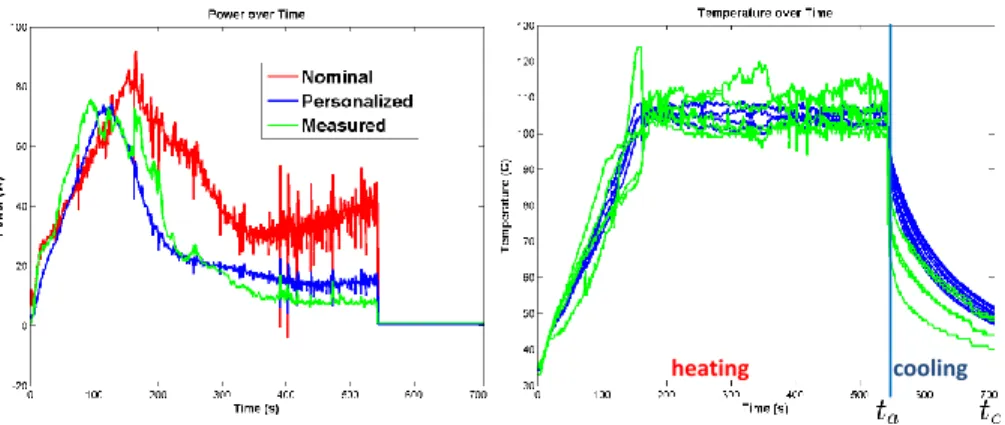
cooling heating
Fig. 6: Personalization of the heat capacity and the conductivity using (Left ) the de-livered power curve over ablation (Right ) the temperature distribution after ablation from tumor 1 (here, the red and blue curves are superimposed). The error between the measurement and the computation is reduced from 22.9 to 7.9W for the power and is equal to 19.3◦C for the temperature.
five different tumors. Briefly, the minimization of the error between measured and simulated values of power and temperature was done only on 2 tumors (2 different pigs). In both cases, the values independently found were really close: the same value of heat capacity was estimated, and the conductivity values were almost equal to the nominal value, as expected as the pigs were healthy.
The estimated heat capacity and the nominal conductivity were then used to simulate RFA on the five remaining cases and errors in temperature, heat power and necrosis size were evaluated. Small errors were obtained in those cases too, without previously having fit the parameters for those tumors. As detailed in (Sec. 3.3), the vulnerable rate coefficient was also adjusted to match the raise in delivered power. These results confirmed the stability of the personalization framework. As reported in Table 4, the use of personalized parameters instead of nominal parameters led to good predictions of the necrosis extent, the heat power and the temperature (mean errors of 14.8W and 12.0◦C respectively). However, by fitting the temperature and the delivered heat power, the novel approach could estimate the temperatures around each tumor at any time during the ablation. This additional information could be used as surrogate to assess the amount and location of damaged tissue (cells that received excessive heat but without being necrosed) surrounding the ablated region.
The extent of the necrotic area is mainly controlled by the conductivity dt
and the heat capacity of vulnerable cells cV
t (not of undamaged ones cUt). Since dt
was not changed after optimization, there was no significant difference in terms of necrotic area after personalization, despite a better match for the measured power and cooling temperature as illustrated on Fig. 6. It was actually not surprising that the nominal dt value was optimal since all pigs were healthy, of
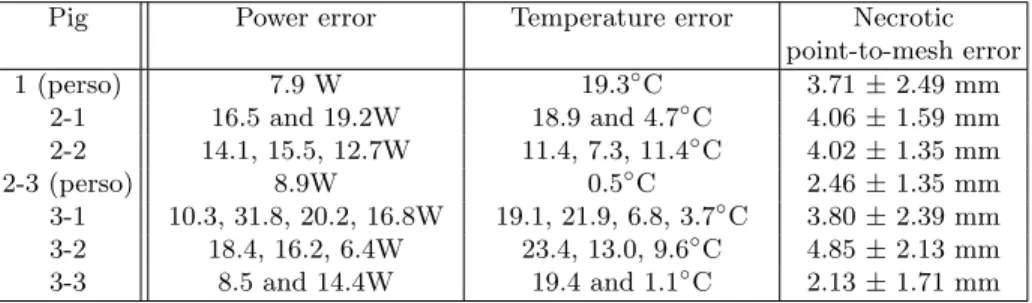
Table 4: Quantitative evaluation of model prediction: on average, mean errors of 14.8W and 12.0◦C. The mean errors between simulated and measured values are computed for each ablation. For the five ablations which were performed through several cooling and heating periods, the different error values for each period are reported.
Pig Power error Temperature error Necrotic
point-to-mesh error 1 (perso) 7.9 W 19.3◦C 3.71 ± 2.49 mm 2-1 16.5 and 19.2W 18.9 and 4.7◦C 4.06 ± 1.59 mm 2-2 14.1, 15.5, 12.7W 11.4, 7.3, 11.4◦C 4.02 ± 1.35 mm 2-3 (perso) 8.9W 0.5◦C 2.46 ± 1.35 mm 3-1 10.3, 31.8, 20.2, 16.8W 19.1, 21.9, 6.8, 3.7◦C 3.80 ± 2.39 mm 3-2 18.4, 16.2, 6.4W 23.4, 13.0, 9.6◦C 4.85 ± 2.13 mm 3-3 8.5 and 14.4W 19.4 and 1.1◦C 2.13 ± 1.71 mm
it suggests that simulations with optimized dt and cUt are realistic in terms of
necrotic area, power and temperature predictions which was the objective. In clinical settings, due to the large variety of diseases treated by RFA (cirrhosis, fibrosis, etc), the proposed method should be suitable to get subject-specific parameters from easily accessible data.
5
Conclusion
In this paper, we proposed a novel approach to validate computational models of radiofrequency ablation (RFA) based on pre-, intra-, and post-operative images and device-based measurements, in a close-to-clinical settings. The approach was successfully evaluated on three swines and seven ablations. We presented a pre-clinical validation of a detailed model, required prior to any pre-clinical study for which personalization would occur during the intervention.
In clinical RFA of liver tumors, we cannot assume that the biophysical pa-rameters are the same for all patients, as assumed in this experiment for the three pigs, and personalization is therefore required. However, by evaluating the discrepancy in terms of temperature and delivered power, key biophysical pa-rameters (the heat capacity and the conductivity of the bioheat model) could be estimated leading to promising predictions. Here, we just relied on information localized at the tips of the probe, the cooling temperature and the delivered power during the intervention (no temperature maps, no post-op images re-quired) and we showed that the model can be personalized from patient data, which was not granted. We limited the number of personalized parameters (2). However by estimating more parameters like cV
t, cNt , current errors like the lesion
size around tumor 2-1 for example, could be reduced.
This opens new perspectives for updating intra-operatively the RFA model prediction of each lesion based on those two probe measurements. Because they are available in real-time during the intervention, this appears as a far better option than using the necrosis extent which is mostly visible post-operatively.
Future work will attempt to optimize the computation time to estimate on the fly key parameters from readily available probe measurements, to include additional cases and observations quantities (MR thermometry for instance) in order to further improve the personalization and to reliably estimate the deformation between pre- and post-operative imaging for a precise validation of the necrosis extent prediction. Further refinements in the model can be added such as the advection effect of the porous circulation in the parenchyma [6].
Acknowledgment
Part of this work was funded by the IHU in Strasbourg through the Simu-lAB project: Radio-frequency ablation on Liver. The authors are grateful to Gael Fourr´e, Franck Blindauer, Mourad Bouhadjar and Rodrigo Cararo, radiol-ogy technicians and veterinary at the IHU Surgical Institute, for their valuable assistance in performing the experimental procedures.
References
1. Chen, X., Saidel, G.M.: Mathematical modeling of thermal ablation in tissue surrounding a large vessel. J Biomech 131 (2009)
2. Altrogge, I., Preusser, T., Kroger, T., Haase, S., Patz, T., Kirby, R.M.: Sensitivity analysis for the optimization of radiofrequency ablation in the presence of material parameter uncertainty. Int. Journal for Uncertainty Quantification 2 (2012) 3. Jiang, Y., Mulier, S., Chong, W., Diel Rambo, M., Chen, F., Marchal, G., Ni, Y.:
Formulation of 3D finite elements for hepatic RFA. IJMIC 9 (2010) 225–235 4. Audigier, C., Mansi, T., Delingette, H., Rapaka, S., Mihalef, V., Boctor, E., Choti,
M., Kamen, A., Ayache, N., Comaniciu, D.: Efficient Lattice Boltzmann solver for patient-specific radiofrequency ablation of hepatic tumors. (2015)
5. Payne, S., Flanagan, R., Pollari, M., Alhonnoro, T., Bost, C., O’Neill, D., Peng, T., Stiegler, P.: Image-based multi-scale modelling and validation of radio-frequency ablation in liver tumours. Philos T Roy Soc A 369 (2011) 4233–4254
6. Audigier, C., Mansi, T., Delingette, H., Rapaka, S., Mihalef, V., Carnegie, D., Boctor, E., Choti, M., Kamen, A., Comaniciu, D., et al.: Parameter estimation for personalization of liver tumor radiofrequency ablation. In: MICCAI Workshop on Abdominal Imaging–Computational and Clinical Applications. (2014)
7. Pennes, H.H.: Analysis of tissue and arterial blood temperatures in the resting human forearm. J Appl Physiol 85 (1998) 5–34
8. Pan, C., Luo, L.S., Miller, C.T.: An evaluation of lattice boltzmann schemes for porous medium flow simulation. Computers & fluids 35 (2006) 898–909
9. Breen, M., Chen, X., Wilson, D., Saidel, G.: Modeling cellular thermal damage from radio-frequency ablation. In: EMBS/BMES Conference, (IEEE)
10. ONeill, D., Peng, T., Stiegler, P., Mayrhauser, U., Koestenbauer, S., Tscheliessnigg, K., Payne, S.: A three-state mathematical model of hyperthermic cell death. Ann Biomed Eng 39 (2011) 570–579
11. Zheng, Y., Barbu, A., Georgescu, B., Scheuering, M., Comaniciu, D.: Fast auto-matic heart chamber segmentation from 3D CT data using marginal space learning and steerable features. In: Computer Vision, 2007. ICCV 2007. IEEE 11th Inter-national Conference on, IEEE (2007) 1–8