European Heart Journal (1991) 12, 1132-1139
Left ventricular flow from apex to base during systole and
isovolumic relaxation in a patient with hypertrophic
cardiomyopathy and midventricular obstruction
G. SUTSCH, R. JENNI AND H. P. KRAYENBUHL
From the Department of Internal Medicine, Medical Policlinic, Cardiology, University Hospital Zurich, Switzerland
KEY WORDS: Cardiomyopathy with midventricular obstruction, Doppler and isovolumic relaxation flow.
The occurrence of a left ventricular anterograde flow velocity (maximal: 39 m . s~~') is demonstrated in a 32-year-old patient with hypertrophic cardiomyopathy and midventricular obstruction, beginning at early systole and persisting
throughout the isovolumic relaxation. Cardiac catheterization with simultaneous dual high fidelity pressure measurements in the apical and basal chambers confirmed the presence of the Doppler maximal instantaneous pressure gradient of 60 mmHg. Contrast left ventricular angiography excluded apical dvskinesia. In the two intracavity compartments, isovolumic relaxation time and the time constant of pressure decay (T) were abnormal whereby x was more delayed in the apical than in the basal portion. The presence of an apical high pressure zone during systole with impeded and delayed emptying through the midventricular obstacle and the late onset and prolongation of relaxation are thought to be the cause of the intraventricular flow from apex to base lasting from early systole throughout isovolumic relaxation.
Introduction
Midventricular obstruction is a rare variant of hyper-trophic obstructive cardiomyopathy and is estimated to occur in 1% of this primary myocardial disease'11. It is characterized by a massive midventricular hyper-trophy which is usually localized at the level of the papillary muscles. Classically, during systole, the mid-ventricular thickened walls approach each other, separ-ating the left ventricle into two chambers: one apical high pressure zone and one basal low pressure zone. This gives rise to a variety of intracavity velocity pat-terns detectable by continuous and pulsed Doppler wave recordings.
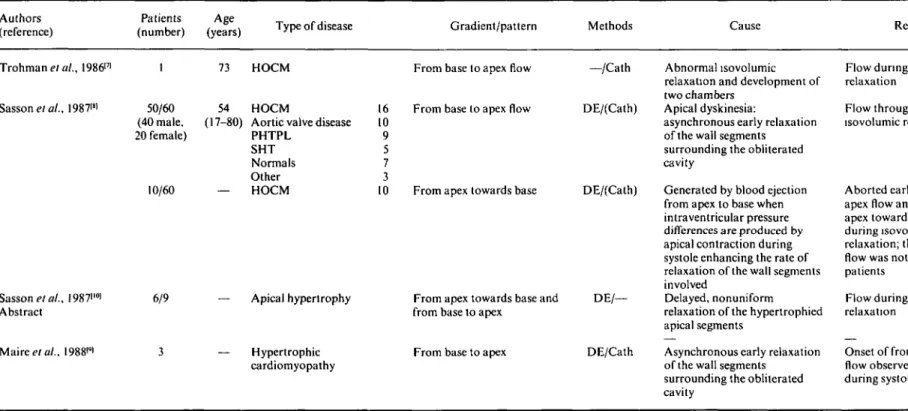
Until recently, detection of intracavity flow velocities in these patients was confined to the isovolumic relax-ation period only f'2"41 see Table 1). The flows were said to occur from the apical portion towards the base, and they were described in association with apical hypo- or dyskinesia'2"41.
The aim of this report is to present the unique Doppler echocardiographic findings of a basally directed intra-ventricular flow lasting from early systole to mitral valve opening in a patient with hypertrophic obstructive cardio-myopathy and midventricular obstruction. Cardiac cath-eterization with simultaneous dual intraventricular high fidelity pressure measurements confirmed the presence, magnitude and time course of the pressure gradient between the apical and the basal left ventricular compartments.
Submitted for publication on 11 September 1990. and in revised form 29 November 1990.
Correspondence: DrG. Sutsch, MD. Department of Internal Medicine. Medi-cal Policlinic, Card.olog>, University Hospital, Ramistraiie 100, CH-8091 Zurich, Switzerland.
Case report
CLINICAL HISTORY AND PHYSICAL FINDINGS
A 32-year-old man with palpitations, exertional dizzi-ness and brief episodes of fainting, and with a familial history of hypertrophic obstructive cardiomyopathy (the father and one brother died at the age of 52 and 10 years, respectively, with documented hypertrophic obstructive cardiomyopathy) was followed over 10 years to detect any worsening of the condition. The sole coronary risk factor was a 20-year history of cigarette smoking. During the last 2 years the patient was treated with verapamil 360 mg daily. Physical examination revealed no signs of conges-tive heart failure and the patient was normotensive and had a normal heart rate. The apical impulse was promi-nent but not enlarged, and was within the midclavicular line. Heart auscultation revealed normal sounds. A 3/6 grade meso-telesystolic murmur was heard from the apex to the axilla. A 2/6 grade midsystolic ejection murmur was audible in the aortic area which increased during the Valsalva manoeuvre.
NONINVASIVE STUDIES
Chest X-ray showed a normal cardiac silhouette and a cardiothoracic ratio of 0-5. A 24-h Holter monitoring revealed sinus rhythm throughout the whole recording period and an average of 309 premature ventricular beats. h ' including 32 paired beats. h"1 (for compari-son, 2 years before 19 premature ventricular beats. h"' including 10 paired beats, respectively, were monitored). At upright bicycle ergometry the patient performed 140 W for 3 min (67% of the predicted working capacity). The heart rate reached 167 beats. min~' i.e. 97% of the predicted submaximal heart rate. The patient complained of fatigue, but no angina occurred. The electrocardio-gram (ECG) during exercise could not be used to detect
Slamaero/.. I989«
Maze el al., I988121
Siitsch ef a/., 1991 (present study) 1 7 1 41 — 32 Midventricular obstruction in apical hypertrophy Midventricular obstruction Midventricular obstruction in HOCM
From apex towards base
From apex towards base (secondary outflow) From apex towards base
DE/Cath Apical dyskinesia with apical necrosis; nonuniform relaxation
DE/— Apical dyskinesia
DE/Cath Apical high pressure zone with delayed emptying and relaxation
Flow confined to isovolumic relaxation
Flow during isovolumic relaxation
Flow from early systole to mitral valve opening
2
S' 2
HOCM: hypertrophic obstructive cardiomyopathy; DE: Doppler echocardiography; Cath: cardiac catheterization.
1
5-1134 G. Siitsch et al.
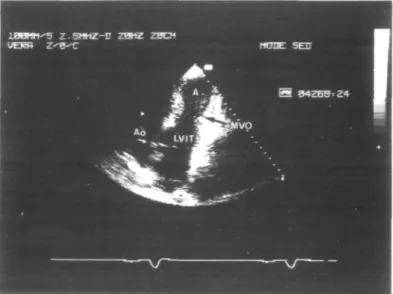
Figure I Two-dimensional echocardiography: RAO equivalent tomographic section from the apical window showing the midventricular obstruction (A = apex; LVIT = left ventricular inflow tract; Ao = aorta; MVO = midventricular obstruction).
myocardial ischaemia because of pre-existing intraven-tricular conduction abnormalities at rest and signs of left ventricular hypertrophy with strain.
Echocardiography
Repeated standard two-dimensional and M-mode echocardiographic studies were performed using a Hewlett-Packard 77020AC unit equipped with a duplex transducer containing a 2-5-MHz crystal set for imaging, pulsed wave and colour Doppler and a 1-9-MHz crystal set for continuous wave. Features of hypertrophic ob-structive cardiomyopathy, such as thickened muscular walls with a septal maximum of 2-4 cm at the level of the papillary muscle and a high shortening fraction of 56% (normal 29-46%) were found. The left atrium was moderately dilated (4-4 cm; normal range 1-5-4-0 cm) and mild mitral regurgitation was shown. All segments of the left ventricle contracted normally and on the apical four-chamber view the systolic midventricular obstruction was clearly visualized (Fig. 1). An intraventricular gradient was detected at the site of the maximal septal hypertro-phy, responsible for the systolic midventricular obliter-ation, and thus for the separation of the left ventricle into two chambers leaving only a tiny blood jet passing the obstacle.
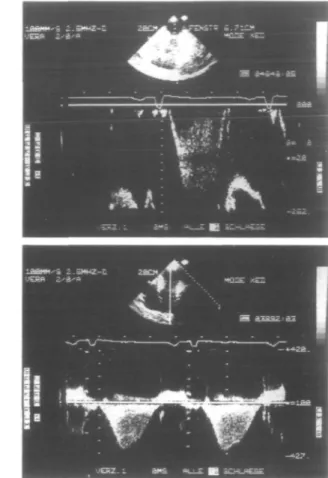
Using continuous wave Doppler from the apical transducer position, flow was shown to be continuously directed from the apex towards the base, starting at early systole and persisting until mitral valve opening, includ-ing, therefore, the isovolumic relaxation period (total duration 466 ms; peak flow 3-9 m . s"1; Fig. 2, right lower panel).
Using pulsed wave Doppler in the same apical trans-ducer position, the sampling volume was moved along the axis of the midventricular obstruction to detect the best
signal and was finally placed into the blood jet at, and just distally, (toward bases) from the midventricular obstruction (Fig. 2, right upper panel). A velocity directed continuously toward the base was recorded (455 ms) con-firming this site as the site generating the aforementioned particular continuous wave spectrum.
By combining the observations from the continuous wave spectrum and the pulsed wave Doppler recordings at the site of the midventricular obstruction, that is by superimposing the findings of onset, duration and direc-tion of the flow velocities, we excluded this particular continuous wave spectrum as deriving from mitral regurgitation.
INVASIVE STUDY
Cardiac catheterization was performed because of the patient's family history, the increased occurrence of premature beats despite medical therapy, the newly occurred symptoms such as exercise-induced dizziness and palpitations combined with reduced physical work-ing capacity and, finally, the ultrasonic findwork-ings of an intraventricular Doppler peak gradient of 60 mmHg.
Premedication consisted of 10 mg chlordiazepoxide administered orally 1 h before catheterization; the last dose of 120 mg of varapamil was given 24 h prior to the invasive study.
Left and right heart catheterization was performed using the right femoral artery and vein approach, respect-ively. An 8 F Millar pigtail angiographic catheter was advanced retrogradely through the aortic valve and positioned first in the left ventricular outflow tract; a micromanometer-tipped 3 F Millar catheter (both from Millar Instruments Inc., Houston, Texas, USA) was passed through a 8-5 F Brockenbrough catheter via the transseptal route and placed into the left ventricular inflow tract. The gains of the high fidelity tracings were
Apex
• 3 0
5 4 0
-2 0 0 4 0 0 6 0 0
Figure 2 Left panel.(from top to bottom): reconstruction of the left ventricular pressure measurements from the digitized apical and basal zone tracings (see Fig. 3); the resulting instantaneous pressure differences and the calculated instantaneous flow velocities use the modified Bernoulli equation (AP = 4v2). The time course of the calculated flow velocities had an identical configuration to the Doppler
echocardio-graphic continuous wave spectrum depicted on the right upper panel. In particular, there was a hump on the calculated flow velocity curve at about 380 ms after the R-wave which briefly interrupted the ongoing deceleration. Intervals between individual data points were 5 ms. The horizontal dashed line at 1 m . s~' was drawn to facilitate visual comparison with the adjacent continuous wave Doppler recording which was filtered at 1 m . s"'. LVP = left ventricular pressure. Right upper panel: Pulsed wave Doppler recording at and distally (toward basis) from the midventricular obstruction. Duration of the flow velocity, from apex towards base, was 455 ms (heart rate = 69 beats . min ~'). Markers on the horizontal and vertical axis indicate 200 ms and 0-2 m . s~\ respectively. Sampling at this level excluded that the systolic flow spectrum obtained from continuous wave recording originated from mitral valve regurgitation. Right lower panel: Continuous wave Doppler record-ing from the apical transducer window showrecord-ing a spectrum lastrecord-ing from early systole to mitral valve openrecord-ing. The flow was always directed from the apex towards the base (duration 466 ms, heart rate = 76 beats, min"'). The maximal flow velocity was 3 - 9 m . s " ' (maximal instantaneous pressure gradient = 60 mmHg). Note the similarity of the aforementioned notch on the continuous wave spectrum which again marked a short interruption on the deceleration flow envelope. Markers on the horizontal and vertical axis indicate 200ms and I r a . s "1,
respectively.
adjusted so as to match the conventional pressure tracings obtained via the lumen of the two catheters. Pressures in the left ventricular outflow and inflow tract were identical (Fig. 3). The 8 F pigtail Millar catheter was then advanced to the left ventricular apex and simultaneous high fidelity micromanometer pressure measurements were carried out from both the apex and the inflow tract (heart basis) allowing the determination of the instantaneous pressure gradient between the two chambers. During systole, the separation of the pressure tracings started at 140 ms after the R-wave of the ECG; this was accompanied by a loud murmur on the phonocardiogram which persisted until peak pressure was reached in the apical zone (at 260 ms from the R-wave). During that period, the pressure in the basal chamber fell in two steps separated by a short
plateau after the apical tracing had reached its peak press-ure. The peak pressure difference from apex to basis was 52 mmHg (mean pressure gradient 32 mmHg) at rest and, following a premature ventricular beat, the peak pressure difference rose to 81 mmHg (mean pressure gradient 56 mmHg).
During isovolumic relaxation, asynchrony of the left ventricular pressure course persisted. Following aortic valve closure, the pressure tracings fell towards baseline but the pressure decay was delayed in the apical portion as compared to the left ventricular inflow tract. At 470 ms after the R-wave, there was crossover of the two press-ure tracings with the apical presspress-ure falling below the left ventricular inflow tract tracing. This intraven-tricular pressure difference persisted during early and
1136 G. Siitsch etal. 150—1 x E E 0 — ' . A. PCG LVP ECG
Figure 3 Simultaneous recording of left ventricular high fidelity pressure curves from the apical and basal zones and rapid withdrawal of the pigtail micromanometer from the apical position to the left ventricular outflow tract distal from the midventricular obstruction (arrow between second and third beat; heart rate = 67 beats. min ~'). Note the midsystolic rise of pressure in the apical chamber and the delayed onset of relaxation. Conversely, the pressure decay in the basal portion started earlier as compared to the high pressure tracing and was followed by a mid- to late systolic plateau-like phase. Moreover, 'isovolumic' relaxation time was more prolonged in the basal (131 ms) than in the apical (93 ms) chamber because the lowest early diastolic pressure was reached later in the basal than in the apical compartment. A2 on the
phonocardiogram (PCG) indicates aortic valve closure, LVP = left ventricular pressure, and ECG = electrocardiogram.
Frame at 82 ms before aortic valve opening Frame at 70 ms after aortic valve opening
Frame at 340 ms after
aortic valve opening
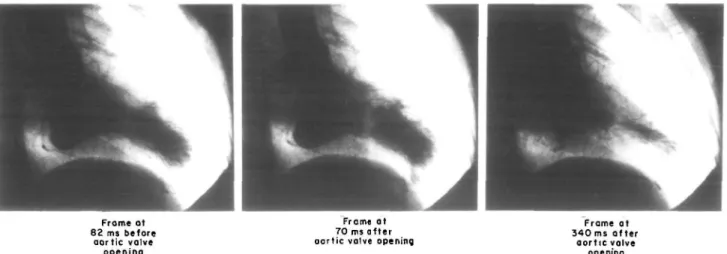
Figure 4 Left v e n t r i c u l a r c i n e a n g i o g r a m in t h e right a n t e r i o r oblique position d u r i n g a c a r d i a c cycle (heart rate = 67 beats . m i n1) . T h e frames a r e 82 m s before. 70 m s and 340 m s after aortic valve opening, respectively. T h e m a r k e d midventricular o b s t r u c t i o n is clearly visualized.
mid-diastole and lasted until 680 ms after the R-wave. Thereafter, left ventricular pressures during diastole were identical except for a difference in the maximal peaks of atrial contraction where the apical pressure was slightly below the pressure in the left ventricular inflow tract. The apically located pigtail micromanometer was then withdrawn into the outflow chamber under continuous
pressure recording (Fig. 3). Biplane left ventricular angi-ography was carried out via trie pigtail micromanometer angiographic catheter in the RAO and LAO projection using nonionic radiographic contrast dye (Lopamiro® 370: lopamidol 755-2 mg. ml"1 and trometamol 1 mg. ml"1). Sixty ml of dye were injected at a flow of 12ml.s"'. Cineangiography was recorded on 35mm
X E - 6 0 0
1
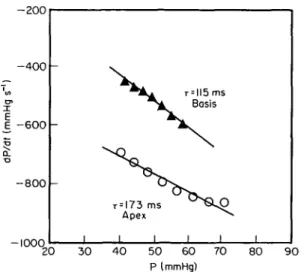
•o - 8 0 0 — mnn r = !73 ms Apex I 1 1 BasisK
i i i 20 30 4 0 50 60 P (mmHg) 70 80 9 0Figure 5 Time constant of pressure decay r for the apical and basal zones of the left ventricle, respectively. Both values for r were increased (normal 40 ms1'01); however, in the apex it was more
prolonged. A, basal zone of left ventricle; O, apical zone of left ventricle.
cinefilm (Siemens Angioscope) at a filming rate of 50 frames, s"' (Fig. 4) with simultaneous recording of the electrocardiogram, the numerical code of the frames and the left ventricular pressures on an oscillograph (Electronics for Medicine VR 12) at a paper speed of 250mm. s"1.
On the projected film detailed frame-by-frame analysis was performed. After mitral valve closure, first symmetric contraction of all left ventricular segments occurred. At 140 ms after the R-wave, a progressive midventricular narrowing was visualized with a maximum being reached at 260 ms after the R-wave. At that time, the two left ventricular chambers were almost separated and there remained only a pencil-like thin communication between the two compartments. At 340 ms after the R-wave, the left ventricular in- and outflow tract started to relax and, with a delay of approximately 20 ms, the aortic valve closed, while the apical portion continued to eject blood through the obstacle, which persisted until 460 ms after the R-wave. Mitral valve opening occurred at 480 ms after the R-wave, initiating diastolic filling of the left ventricle with the blood gradually proceeding first into the left ven-tricular outflow tract (onset at 480 ms after the R-wave) and later into the apex (onset 540 ms after the R-wave). In addition, a mild regurgitant jet into the left atrium was demonstrated. The coronary arteries were normal at selective coronary arteriography.
Calculation of relaxation indexes
The 'isovolumic' relaxation time (time from maximum negative dP/dt to lowest early diastolic pressure) and the time constant of left ventricular pressure decay (r, in ms) were determined separately for each functional chamber. Left ventricular high fidelity pressure tracings were digitized manually for a cardiac cycle using an electronic digitizer (Numonics Corp.) interfaced to a computer
The time constants of left ventricular relaxation were computer calculated as the negative reciprocal of the slope of the linear regression between left ventricular pressure and negative dP/dt coordinates, during the time period extending from maximum negative dP/dt to the point at which the falling left ventricular pressure reached the value of 5 mmHg above the left ventricular end-diastolic pressure'6' (Fig. 5). In the left ventricular inflow tract, r was 115 ms (maximum negative dP/dt = 606 mmHg. s"' occurring at a pressure of 62 mmHg and at 377 ms after the R-wave, or 12 ms after the beginning of aortic valve closure) while in the apical zone r was 173 ms (maximum negative dP/dt = 864 mmHg. s"1 at a pressure of 76 mmHg and at 410 ms after the R-wave, or 44 ms after the onset of aortic valve closure). At 460 ms after the R-wave (last cineangio frame at which midventricular obstruction was present), the pressure in the apical zone was still elevated with 37 mmHg as compared to the left ventricular outflow tract with 26 mmHg.
Discussion
Intraventricular flow phenomena during isovolumic relaxation are rare and occur mostly in association with massive structural changes of the left ventricular myocardium with disturbances in systolic and diastolic function.
The first isovolumic relaxation flow was reported in a 73-year-old patient with hypertrophic cardiomyopathy'71. In this particular patient, an intracavitary regurgitation of injected contrast material from the left ventricular out-flow tract to the left ventricular body and apex was described during isovolumic relaxation. Thereafter, sev-eral Doppler echocardiographic studies focusing on intraventricular flow phenomena have described various types and durations of intracavitary flow patterns (Table 2). In a large study of 60 patients with isovolumic relax-ation flow, accurately studied from the apical transducer position with continuous and pulsed wave Doppler181, 50 patients were found to have a normal forward systolic flow continuous with an unusual apically directed iso-volumetric relaxation flow, which originated mostly at the middle third of the septum, extended along the intra-ventricular septum, and was detectable until mitral valve opening. In all but one of the remaining 10 patients, the isovolumic relaxation flow, directed from base to apex, lasted only for a portion of that period and the flow signal turned into the opposite direction in the late part of the isovolumic relaxation phase. Later it was pointed out'91 that this flow was not restricted to the isovolumic relax-ation period only, but that apically directed flow was superimposed to the normally occurring systolic forward flow and persisted beyond the isovolumic relaxation. In these studies, apical dyskinesia leading to asynchronous early relaxation of the wall segments involved'891 were thought to cause these apically directed flow patterns.
Table 2 Flow characteristics during systole and isovolumic relaxation in patients with other diseases
Authors (reference)
Patients Age
(number) (years) Type of disease Gradient/pattern Methods Cause Remarks
Trohman et at., 198617' Sasson etal., 19871" ., I987i'°i Abstract Mairee/a/., 1988<*l 50/60 (40 male, 20 female) 10/60 6/9 73 54 '-80) HOCM HOCM
Aortic valve disease PHTPL SHT Normals Other HOCM 16 10 9 5 7 3 10 — Apical hypertrophy — Hypertrophic cardiomyopathy
From base to apex flow
From base to apex flow
From apex towards base
From apex towards base and from base to apex
From base to apex
—/Cath Abnormal isovolumic relaxation and development of two chambers
DE/(Cath) Apical dyskinesia:
asynchronous early relaxation of the wall segments surrounding the obliterated cavity
DE/(Cath) Generated by blood ejection from apex to base when intraventricular pressure differences are produced by apical contraction during systole enhancing the rate of relaxation of the wall segments involved
DE/— Delayed, nonuniform relaxation of the hypertrophied apical segments
DE/Cath Asynchronous early relaxation of the wall segments
surrounding the obliterated cavity
Flow during isovolumic relaxation
Flow throughout isovolumic relaxation
Aborted early from base to apex flow and late from apex towards base flow during isovolumic relaxation; this inversion of flow was noted in 9 of the 10 patients
Flow during isovolumic relaxation
Onset of from base to apex flow observed already during systole
or dyskinesia in patients with an apical form of hyper-trophy'341. The basally directed flow pattern was confined to isovolumic relaxation, and, was preceded by a short systolic flow directed towards the base'31. Another study demonstrated Doppler echocardiographic presence of a flow originating in the apical portion of the left ventricle and directed towards the base in two groups of patients with apical dyskinesia or hypertrophy, but this flow, which was assumed to be caused by delayed, nonuniform relaxation of the hypertrophied apical segment'10', was detected only during isovolumic relaxation'2101.
This report is now a unique description of a basally directed flow velocity persisting from early systole to mi-tral valve opening in a patient with hypertrophic obstruc-tive cardiomyopathy and midventricular obstruction. Based on the Doppler echocardiographic examination, the flow velocity was clearly demonstrated to originate at the site of the midventricular obstruction, to continue during isovolumic relaxation, and was not simulated by mitral regurgitation. The haemodynamic findings showed the persistence of an intraventricular gradient between the apex and the base throughout systole, generating a pressure gradient which was capable of maintaining a tiny forward blood flow through the intracavitary obstacle from systole to mitral valve opening.
The combination of the two independent methods confirmed the ongoing intracavitary flow during systole and isovolumic relaxation: calculation and plotting of the expected instantaneous flow velocities (using the modified Bernoulli equation) from the digitally analysed high fidelity pressure curves (Fig. 2, left lower panel) revealed a striking similarity with the continuous wave Doppler recording (Fig. 2, right lower panel).
In the present case, two mechanisms are thought to be responsible for this particular flow. First, there is a some-what delayed onset of contraction of the apical portion which then induces a delayed flow. Second, despite the presence of a forcefully contracting apical chamber, there is a massive obstacle which impedes rapid emptying and causes the delayed and continuous flow directed towards the base.
The pressure differences observed during diastole might result from the following two mechanisms: first, there is delayed early filling of the apical chamber
the basal chamber.
In this case, standard calculation of T for quantification of relaxation is a problem because there was no truly isovolumic relaxation phase in the two compartments. The continuous flow from the apical portion to the left ventricular base may explain why the coordinates of negative dP/dt and left ventricular pressure did not really fit a straight line. The discrepancy between the duration of relaxation time and T in the two compartments may largely be due to the fact that 'isovolumic' relaxation time encompassed a variable portion of early diastolic filling as well.
References
[1] Wigle ED, Sasson Z, Henderson MA, el al. Hypertrophic cardiomyopathy. The importance of the site and the extent of hypertrophy. A review. Prog Cardiovasc Dis 1985; 28: 1-85. [2] Maze S, Parry W, Kotler MN. Color flow and spectral Doppler
evaluation of midventricular obstruction, hypertrophic ob-structive cardiomyopathy and cavity obliteration (abstr). J Am Coll Cardiol 1988; 11 (Suppl 74 A).
[3] Zoghbi WA, Haichin RN, Quinones MA. Mid-cavity obstruc-tion in apical hypertrophy: Doppler evidence of diastolic intra-ventricular gradient with higher apical pressure. Am Heart J
1988; 116: 1469-74.
[4] Slama MA, Tribouilloy C, Bickert P, et al. Myocardiopathie hypertrophique apicale avec obstruction medio-ventriculaire et necrose apicale. Arch Mai Coeur 1989; 82: 1623-7.
[5] Eichhorn P, Grimm J, Koch R, Hess OM, Carroll J, Krayenbuehl HP. Left ventricular relaxation in patients with left ventricular hypertrophy secondary to aortic valve disease. Circulation 1982; 65: 1395-404.
[6] Murakami T, Hess OM, Krayenbuehl HP. Left ventricular function before and after diltiazem in patients with coronary artery disease. J Am Coll Cardiol 1985; 5: 723-30.
[7] Trohman RG, Palomo AR, Nguyen NX, Myerburg RJ, Kessler KM. Reversal of left ventricular intracavitary diastolic regurgi-tation in hypertrophic obstructive cardiomyopathy. J Am Coll Cardiol 1986; 8: 703-5.
[8] Sasson Z, Hatle L, Appleton CP, Jewett M, Alderman EL, Popp RL. Intraventricular flow during isovolumic relaxation: de-scription and characterization by Doppler echocardiography. J Am Coll Cardiol 1987; 10: 539-46.
[9] Maire R, Jenni R, Krayenbuehl HP. Retrograde left ventricular flow during early relaxation. J Am Coll Cardiol 1987; 11:672-3. [10] Sasson Z, Hatle L, Rakowski E, Wigle ED, Popp RL. Patterns of left ventricular isovolumic relaxation and diastolic filling in apical hypertrophy (abstr). Circulation 1987; 76 (Suppl IV): IV-249