DOI: 10.1093/jnci/djr256 © The Author 2011. Published by Oxford University Press. All rights reserved. Advance Access publication on July 28, 2011. This is an Open Access article distributed under the terms of the Creative Com mons Attribution Non-Commercial License (http://creativecommons.org/licenses/by-nc/2.5), which permits unrestricted non-commercial use, distribution, and reproduction in any medium, provided the original work is properly cited.
Neuroblastoma, a cancer of embryonal neural crest cells, is the most common solid tumor of early childhood. The majority of children with neuroblastoma are diagnosed with advanced disease that is poorly responsive to conventional chemotherapy (1). Several biological and genetic factors have been identified for this disease, including age at diagnosis, tumor stage, unfavorable
histology, and the status of the v-myc myelocytomatosis viral related oncogene, neuroblastoma derived (MYCN) oncogene (1). MYCN gene amplification can be demonstrated in approximately 20% of primary neuroblastomas, is accompanied by MYCN over-expression, and is a powerful adverse prognostic indicator for this disease (2,3).
ARTICLE
ABCC Multidrug Transporters in Childhood Neuroblastoma:
Clinical and Biological Effects Independent of Cytotoxic
Drug Efflux
Michelle J. Henderson, Michelle Haber, Antonio Porro, Marcia A. Munoz, Nunzio Iraci, Chengyuan Xue, Jayne Murray, Claudia L. Flemming, Janice Smith, Jamie I. Fletcher, Samuele Gherardi, Chin-Kiat Kwek, Amanda J. Russell, Emanuele Valli, Wendy B. London, Allen B. Buxton, Lesley J. Ashton, Alan C. Sartorelli, Susan L. Cohn, Manfred Schwab, Glenn M. Marshall, Giovanni Perini, Murray D. Norris
Manuscript received February 24, 2010; revised June 9, 2011; accepted June 16, 2011.
Correspondence to: Michelle Haber, AM PhD, Hon DSc, Children’s Cancer Institute Australia for Medical Research, Lowy Cancer Research Centre, University of New South Wales, PO Box 81, Randwick, NSW 2031, Australia (e-mail: mhaber@ccia.unsw.edu.au) and Giovanni Perini, PhD,, Department of Biology, University of Bologna, via F. Selmi 3, 40126 Bologna, Italy (e-mail: giovanni.perini@unibo.it).
Background Although the prognostic value of the ATP-binding cassette, subfamily C (ABCC) transporters in childhood neuroblastoma is usually attributed to their role in cytotoxic drug efflux, certain observations have suggested that these multidrug transporters might contribute to the malignant phenotype independent of cytotoxic drug efflux.
Methods A v-myc myelocytomatosis viral related oncogene, neuroblastoma derived (MYCN)–driven transgenic mouse neuroblastoma model was crossed with an Abcc1-deficient mouse strain (658 hMYCN1/2, 205 hMYCN1/1 mice)
or, alternatively, treated with the ABCC1 inhibitor, Reversan (n = 20). ABCC genes were suppressed using short interfering RNA or overexpressed by stable transfection in neuroblastoma cell lines BE(2)-C, SH-EP, and SH-SY5Y, which were then assessed for wound closure ability, clonogenic capacity, morphological differentiation, and cell growth. Real-time quantitative polymerase chain reaction was used to examine the clinical significance of ABCC family gene expression in a large prospectively accrued cohort of patients (n = 209) with primary neuroblastomas. Kaplan–Meier survival analysis and Cox regression were used to test for associations with event-free and overall survival. Except where noted, all statistical tests were two-sided.
Results Inhibition of ABCC1 statistically significantly inhibited neuroblastoma development in hMYCN transgenic mice (mean age for palpable tumor: treated mice, 47.2 days; control mice, 41.9 days; hazard ratio [HR] = 9.3, 95% confidence interval [CI] = 2.65 to 32; P < .001). Suppression of ABCC1 in vitro inhibited wound closure (P < .001) and clonogenicity (P = .006); suppression of ABCC4 enhanced morphological differentiation (P < .001) and inhib-ited cell growth (P < .001). Analysis of 209 neuroblastoma patient tumors revealed that, in contrast with ABCC1 and ABCC4, low rather than high ABCC3 expression was associated with reduced event-free survival (HR of recurrence or death = 2.4, 95% CI = 1.4 to 4.2; P = .001), with 23 of 53 patients with low ABCC3 expression ex-periencing recurrence or death compared with 31 of 155 patients with high ABCC3. Moreover, overexpression of ABCC3 in vitro inhibited neuroblastoma cell migration (P < .001) and clonogenicity (P = .03). The combined expression of ABCC1, ABCC3, and ABCC4 was associated with patients having an adverse event, such that of the 12 patients with the “poor prognosis” expression pattern, 10 experienced recurrence or death (HR of recurrence or death = 12.3, 95% CI = 6 to 27; P < .001).
Conclusion ABCC transporters can affect neuroblastoma biology independently of their role in chemotherapeutic drug
efflux, enhancing their potential as targets for therapeutic intervention. J Natl Cancer Inst 2011;103:1236–1251
The development of resistance to multiple cytotoxic drugs is a major cause of treatment failure in cancer patients, and members of the ATP-binding cassette (ABC) transporter superfamily, including ABC subfamilies B and C, member 1 (ABCB1 and ABCC1), may contribute to this phenomenon by active efflux of chemotherapeutic agents from cancer cells (4). We have previously shown (5,6), both retrospectively and prospectively, that high-level expression of ABCC1, but not ABCB1, is a powerful independent prognostic indicator of poor outcome in neuroblastoma (5,6). Furthermore, ABCC1 appears to be transcriptionally regulated by the MYCN oncogene in neuroblastoma cells (7,8). ABCC1 extrudes a number of chemotherapeutic drugs used in the routine treatment of neuroblastoma, leading us and others to conclude that ABCC1 may influence clinical outcome by mediating resistance to cytotoxic drugs used during treatment [reviewed in (4,9)]. Using two independent preclinical models of neuroblastoma, we recently demonstrated that genetic or pharmacological inhibition of ABCC1 sensitizes tumors to treatment with cytotoxic drugs that are known ABCC1 substrates (10).
However, there is also circumstantial evidence (11) that ABC transporters contribute to aspects of tumor biology independently of their capacity to expel cytotoxic drugs. In our own studies of ABCC1 gene expression in primary untreated neuroblastoma, we have observed a small number of patients with favorable clinical stage neuroblastoma but with high-level expression of ABCC1 and rapidly progressive disease (unpublished results). Because of their favorable clinical staging, these patients did not receive chemo-therapy; therefore, the association between high ABCC1 expres-sion and clinical outcome cannot be explained in terms of ABCC1-mediated chemoresistance. Similarly, in a small retro-spective study (12), we found that high levels of ABCC4 expression, like ABCC1, were associated with poor clinical outcome in neuro-blastoma, and although that same study demonstrated that high levels of ABCC4 could protect neuroblastoma cells from the chemotherapeutic drug irinotecan in vitro, the patients in the study received neither irinotecan nor any other drugs known to be ABCC4 substrates. Those results also suggested that the prognostic significance of ABCC4 could not be explained in terms of ABCC4-mediated cytotoxic drug resistance. These findings raised the possibility that high levels of ABCC1 and ABCC4, and potentially other ABC transporters, may contribute to poor outcome in neuroblastoma through functions additional to and independent of efflux of chemotherapeutic drugs.
To specifically address this hypothesis, we first examined the role of ABCC1 in tumor formation by inhibition or deletion of Abcc1 in a well-characterized mouse model of neuroblastoma. We also tested the effects of depleting ABCC1 and ABCC4 using short interfering RNA (siRNA), or ectopic expression of ABCC1 and ABCC3, on cell motility, clonogenic capacity, differentia-tion, and cell growth in cultured neuroblastoma cells. Because other members of the ABCC branch of the ABC family can also extrude a variety of relevant physiological substrates, we exam-ined the relationship between expression of all ABCC family members and clinical outcome in a large cohort of prospectively accrued neuroblastoma patients who had been previously recruited to assess ABCC1, as well as in a large independent cohort.
CONTEXTS AND CAVEATS Prior knowledge
Resistance to cytotoxic drugs is thought to be a major cause of treatment failure in childhood neuroblastoma, and members of the ATP-binding cassette (ABC) transporter superfamily may contrib-ute to this phenomenon by active efflux of chemotherapeutic agents from cancer cells. However, ABC drug transporters may also contribute to tumor progression through other mechanisms besides drug efflux.
Study design
The activity of the transporter ABC subfamily C, member 1 (ABCC1) was studied in mice null for ABCC1 or treated with an ABCC1 inhibitor. ABCC genes were also suppressed in neuroblastoma cell lines with short interfering RNA. The association of ABCC expression in tumor specimens with event-free and overall survival was analyzed in 209 primary neuroblastoma patients.
Contribution
Inhibition of ABCC1 suppressed neuroblastoma development in mice and inhibition of ABCC1 and ABCC4 suppressed clonogenicity and other functions relevant to tumor progression in neuroblastoma cell lines. Higher expression of ABCC1 and ABCC4 and lower ABCC3 expression were associated with higher rates of recurrence or death, as was the combined expression of all three transporters. Implication
The ABC transporters ABCC1, 3 and 4 may contribute to poor out-comes in neuroblastoma through functions other than their role in resistance to cytotoxic drugs.
Limitations
The precise cellular mechanisms by which ABC transporters con-tribute to neuroblastoma progression are not yet known. In vivo experiments were only performed for the ABCC1 transporter but not for ABCC3 and ABCC4.
From the Editors
Materials and Methods
Transgenic and Knockout Mice and Treatment With Reversan
To examine the effect of ABCC1 on neuroblastoma development and progression, we used the hMYCN transgenic mouse, in which targeted expression of the hMYCN transgene to neuroectodermal tissue by use of a tyrosine hydroxylase promoter results in the development of neuroblastoma, which closely resembles the primary human disease (13). The transgenic mouse line was backcrossed for four generations to 129SVter mice (Animal Resources Centre,
Perth, Australia) and maintained as an inbred line at Children’s Cancer Institute Australia (14), with all subsequent male and female experimental mice being derived from this breeding colony. All mice that carry two copies of the transgene (ie, homozygous) develop tumors within a narrow 12-day window around 6 weeks of age. Recently, we identified a nontoxic, potent, and bioactive small-molecule inhibitor of ABCC1, designated Reversan, which enhanced the therapeutic efficacy of ABCC1-substrate drugs in tumor-bearing hMYCN transgenic mice (10). For ABCC1 inhibi-tion studies, Reversan was obtained from ChemBridge Corp (San
Diego, CA). Weaned 3-week-old hMYCN transgenic mice were randomly assigned to treatment in a 5-day on and 2-day off schedule with either 10 mg/kg Reversan solubilized in dimethyl sulfoxide (DMSO) delivered by intraperitoneal injection (n = 20) or with equivalent amounts of the vehicle under the same schedule (control, n = 9), until a medium-sized palpable tumor (1 cm2) was detected.
This experimental design had more than 80% statistical power to detect a delay in tumor formation of at least 12%, at a = .05.
The hMYCN transgenic mice were crossed with Abcc12/2 mice
(C57 Bl/6 background), which have both alleles of Abcc1 inacti-vated by homologous recombination (15). Offspring that were hMYCN1/2Abcc11/2 were mated, and the resulting hMYCN1/2Abcc11/2
offspring were then backcrossed four times to 129X1/SV mice (Jackson Laboratory, Bar Harbor, ME). A total of 658 hMYCN1/2
mice (160 Abcc11/1, 329 Abcc11/2, and 169 Abcc12/2), in addition to
205 hMYCN1/1 mice (50 Abcc11/1, 106 Abcc11/2, and 49 Abcc12/2),
all on a 129 background, were followed to study variations in tumor incidence and latency associated with presence or absence of functional Abcc1 alleles. Mice were palpated twice weekly and were killed by cervical dislocation or carbon dioxide–mediated as-phyxiation when a medium-sized (1 cm2) palpable tumor was
detected. Tumor incidence was followed until the detection of a tumor or until 20 weeks of age. This experimental design afforded statistical power of at least 80% to detect a twofold decrease in tumor incidence at a = .05 in a dominant genetic model.
All experimental procedures involving transgenic mice were approved by the University of New South Wales Animal Care and Ethics Committee according to the Animal Research Act, 1985 (New South Wales, Australia) and the Australian Code of Practice for Care and Use of Animals for Scientific Purposes (1997). Gene Silencing, Transfection, and Cellular Assays
Human neuroblastoma cells BE(2)-C, SH-EP, and SH-SY5Y were obtained from the laboratory of Barbara Spengler (Fordham University, New York, NY) (16,17) and cultured in Dulbecco’s mod-ified Eagle medium (DMEM) containing 10% heat-inactivated fetal bovine serum and 2 mM glutamine. SH-EP cells were pas-saged 6–8 times before use. The identities of the BE(2)-C and SH-SY5Y lines were verified by short tandem repeat genetic pro-filing (CellBank Australia, Sydney, Australia).
Lipofectamine 2000 reagent (Invitrogen, Carlsbad, CA) was used to deliver SMARTpool siRNA or individual siRNA duplexes for ABCC1 (1–10 nM), ABCC4 (1–10 nM), or siCONTROL non-targeting pool siRNA (Dharmacon, Lafayette, CO) alone or in combination. For each cell line, siRNA transfection conditions were optimized using a green fluorescent protein–labeled siRNA duplex and flow-assisted cell sorting to determine conditions that would achieve transfection of at least 80% of cells. The siRNA sequences used as individual duplexes were, for ABCC1 suppres-sion in SH-EP cells, ABCC1 SMARTpool duplex 1 (sense): GAUGACACCUCUCAACAAAdTdT; and for ABCC4 suppres-sion in BE(2)-C cells, ABCC4 SMARTpool duplex 1 (designated ABCC4.1) (sense): GGACAGCCCUCGACCUUAAdTdT; or an independent sequence reported by Reid et al. (18), herein desig-nated ABCC4 duplex 5 or ABCC4.5 (sense): GAUGGUGCAU GUGCAGGAUdTdT (18). For constitutive expression of ABCC1 in SH-SY5Y cells, transfection with pCMV14-3xFLAG-ABCC1,
or the ATP-binding site mutants, pCMV14-3xFLAG-ABCC1-D1454N or ABCC1-DE1454LL, was followed by selection of stable clones with 500 µg/ml G418 (Geneticin; Invitrogen Australia Pty Ltd, Mulgrave, Australia), which were subsequently main-tained with 150 µg/ml G418. The ABCC1-D1454N mutation was previously shown to abolish ATP-dependent ABCC1 transporter activity while not affecting correct localization of the transporter (19), and the ABCC1-DE1454LL mutant was predicted to have similar properties (Supplementary Figure 1, available online and http://www.uniprot.org/uniprot/O15439; accessed June, 2010). For stable clones expressing ABCC3, BE(2)-C cells were transduced with retroviral pCMV14-3xFLAG-ABCC3 or the ATP-binding site mutant, pCMV14-3xFLAG-ABCC3-V1322F. The V1322F mutation was predicted to abolish transporter activity while still being localized in the plasma membrane and is based on studies involving the closely related transporter, ABCC6, in which a single amino acid change in a region N-terminal to the Walker A motif in the second ABC domain abolishes catalytic activity (20) while retaining correct membrane localization in mammalian cell lines (Andras Varadi, personal communication). In this region, there is high sequence conservation with ABCC3. Localization of ABCC1 and ABCC3 variants to the plasma membrane was verified by im-munocytochemical staining for the FLAG epitope (Supplementary Figures 1 and 2, available online). After G418 selection, pooled or cloned transfectants were examined for protein expression by western blot and immunocytochemistry. Control cells were stably transduced with an empty vector.
Generation of ATP-binding site mutants was carried out according to the QuikChange Lightning Site-Directed Mutagenesis Kit (Stratagene, La Jolla, CA) using forward primer 5′-ATC CTT GTG TTG AAT GAG GCC ACG GCA G-3′ for ABCC1-D1454N (single mutant), forward primer 5′-ATC CTT GTG TTG CTT CTG GCC ACG GCA G-3′ for ABCC1-DE1454/1455LL (double mutant) and forward primer 5′-AGG TGG GGA TCT TCG GCC GCA CTG G-3′ for ABCC3-V1322F.
Whole-cell extracts were prepared using lysis buffer (50 mM Tris pH 7.4, 150 mM NaCl, 0.2% NP-40, 50 mM NaF, 5 mM EDTA, 0.1 mM orthovanadate, plus protease inhibitor cocktail [Sigma]) as described previously (21). To analyze the expression of ABCC3 protein, membrane-enriched fractions were prepared using a published protocol (22). Western blots were performed according to standard procedures as previously described (5) using 20–50 µg of whole-cell or membrane extracts. The antibodies used were against ABCC1 (rat monoclonal MRPr1; Alexis Biochemicals, CA; 1:500), ABCC3 (mouse monoclonal M3II-21; Abcam number ab3376; Cambridge, MA; 1:750), ABCC4 (rat monoclonal M4I-10; Alexis Biochemicals; 1:1000), FLAG epitope (anti-FLAG mouse mono-clonal M2; Sigma, St Louis, MO; 1:1000), ß-actin (rabbit polymono-clonal A2066; Sigma; 1:2000), and α-tubulin (mouse monoclonal DM1A; Sigma; 1:3000). Immunocytochemistry was performed using mouse monoclonal anti-FLAG M2 (Sigma) and Cy3-conjugated goat anti-mouse (Jackson Immuno Research, West Grove, PA). Nuclei were stained with Hoechst 33258 (Sigma). The intracellular locali-zation of ABCC proteins was assessed using a conventional epifluo-rescence microscope (Eclipse 90i; Nikon Instruments, Melville, NY) equipped with a digital CCD camera. Image collages were made using Adobe Photoshop (Adobe System, Inc., San Jose, CA).
Unless otherwise stated, all means were derived from at least three experiments. For wound closure assays, cell-free areas were generated by use of either a pipette tip or removal of a wound assay chamber (IBIDI, Martinsried, Germany) 48–72 hours after siRNA transfection or 2–6 hours after Reversan (5 µM) addition, and once a confluent monolayer was present. Growth medium (DMEM) was replaced (with medium containing Reversan where applicable) and two or three wound areas per condition were photographed at 24 or 48 hours. Wound size was quantified by measuring the cell-free areas using Image-J software (National Institutes of Health, Bethesda, MD). To quantify neurite outgrowth, after 72-hour exposure to siRNA, cells with one or more neuritic extensions of at least twice the length of the cell body were scored as positive. At least 100 cells were counted per random field, with at least four fields taken per treatment in each of three separate experiments. Colony-forming assays were performed as previously described (23), with cells replated 24 hours following siRNA transfection and colonies of greater than 100 cells counted. Alternatively, 24 hours after plating, SH-EP cells were exposed to 5 µM Reversan for 72 hours and colonies counted 7 days after plating. DNA synthesis was monitored after 72-hour exposure to siRNA or 24-hour expo-sure to 5 µM Reversan. Cells in 12-well plates were cultured in the presence of 0.5 µCi of 3H-thymidine and a 500-fold excess of
unla-beled thymidine for 5 hours before harvesting for radioassay in triplicate by liquid scintillation counting. Bromodeoxyuridine (BrdU) incorporation was measured using a Delfia Cell proliferation kit (AD0200; Perkin Elmer, Waltham, MA). Cell clones were plated in 96-well plates at a cell density of 15 000 cells per well with 200 µL DMEM medium and cultured for 48 hours before addition of BrdU for 2–12 hours, followed by triplicate assay according to the manufacturer’s protocol.
Patients and Tumor Specimens
The children in this study were enrolled in Pediatric Oncology Group (POG) Neuroblastoma Biology Study 9047 through POG-affiliated locations in North America, Switzerland, and Australia and were treated according to disease stage, age, and tumor biology, as specified in institutional as well as different POG protocols (5). To be eligible for POG Study 9047, patients were required to be 21 years of age or younger, newly diagnosed with pathological confirmation of neuroblastoma, to have informed consent, and to submit a blood or tumor specimen. Patients were consecutively accrued and, at the time of analysis, those specimens for whom clinical follow-up data were unavail-able were excluded from the study. The final cohort comprised 209 patients (205 enrolled between 1996 and 1998 and four patients enrolled between 1994 and 1995). This study population was found to be representative of patients with neuroblastoma in general with respect to well-established prognostic indicators, including MYCN amplification status, age at diagnosis, and tumor stage (Supplementary Figure 3, available online). The median period of follow-up for surviving patients was 55 months (range 0–196 months), whereas the median time from diagnosis to death among the patients with treatment failure was 18 months (range 0–60 months). All deaths except for five (two attributable to infection and three to hemorrhage) were disease related. The protocol was approved by individual institutional review boards,
and informed consent was obtained for every patient registered in the study.
Gene Expression Analyses
RNA was extracted using TRIZOL reagent (Life Technologies, Mulgrave, Australia) and reverse transcribed with Moloney murine leukemia virus reverse transcriptase (Life Technologies) according to the manufacturer’s protocols, as previously described (5). Gene expression was determined by real-time quantitative polymerase chain reaction for 40 cycles using the ABI PRISM 7700 and ABI 7900HT sequence detection systems (Applied Biosystems, Foster City, CA). For each gene, transcript quantification was based on the comparative threshold cycle method, or DDCt method, which compares the expression of a target gene normalized to the expres-sion of a reference gene (in our case ß2-microglobulin), to provide
relative quantification (24). As a positive control for each assay, cDNA derived from either the IMR-32 or SH-EP neuroblastoma cell lines was included in the experiment. Primer and probe sequences for ß2-microglobulin (internal control), ABCC1, and ABCC4
(5,12) are listed, along with the remaining genes in Supplementary Table 1 (available online). Genes with a mean Ct value of 35 or greater in a set of 16 tumors (representative in terms of clinical parameters such as MYCN amplification status, stage, and clinical outcome) were not studied further.
Statistical Procedures
Differences in polymerase chain reaction values for a given target gene or phenotypic traits between groups were assessed by two-sided Student t tests. In the case of BrdU or 3H-thymidine
incorporation assays, one-sample Student t tests were used to com-pare between control and treated samples, where the control was assigned a value of 100%. For experiments involving more than two groups, one-way analysis of variance (ANOVA) was performed and, in cases where significant differences were detected, followed by pairwise t tests as indicated. Associations between clinical char-acteristics of patients and molecular charchar-acteristics of tumors were examined using Fisher’s exact test. Event-free survival time was calculated as the time from diagnosis until the first occurrence of disease relapse, progression, death from any cause, or until last contact if no event occurred. Overall survival was the time from diagnosis until death or until last contact if the patient did not die. Survival analyses using SAS Version 9 (SAS Institute, Inc, Cary, NC) were performed according to the method of Kaplan and Meier (25) with SEs according to Peto and Peto (26) and compar-isons of survival curves made using two-sided log-rank tests. Multivariable Cox regression analyses were performed to deter-mine whether ABCC1, ABCC3, and ABCC4 gene expression were independently statistically predictive of event-free or overall sur-vival. For the publicly available microarray dataset, clinical, patho-logical, and gene expression data for 251 primary neuroblastoma tumors (27) were downloaded via http://pob.abcc.ncifcrf.gov/cgi-bin/JK; accessed January, 2009. Kaplan–Meier survival analyses were performed using StatView 4.1 (Abacus Concepts, Inc, Berkeley, CA). Probabilities of survival and hazard ratios (HRs) are given with 95% confidence intervals (CIs). Proportionality was confirmed by visual inspection of the plots of log(2log(S(time))) vs log(time), which were observed to remain parallel. P values less than .05 were
considered statistically significant. The clinical characteristics and outcomes of the patients were masked from the laboratory staff performing the gene expression analyses. For each of the genes analyzed, a continuous range of polymerase chain reaction values was obtained for the cohort of tumors. For a given gene, to cate-gorize expression as either high or low, the cohort was repeatedly divided into two groups, with cut points at each quartile and at the lower and upper deciles of expression. For each cut point, a Cox model produced a P value and hazard ratio. Of the cut points with P < .05, the one with the highest hazard ratio was selected as the optimal expression cut point. This methodology has been described in detail in London et al. (28).
Results
Pharmacological or Genetic Attenuation of ABCC1 and Neuroblastoma Development In Vivo
To examine the effect of ABCC1 on neuroblastoma development and progression, we administered Reversan to hMYCN transgenic mice (n = 20; control group, n = 9) homozygous for the hMYCN transgene immediately after weaning but before macroscopic tumor development and in the absence of chemotherapeutic agents. We observed a statistically significant delay in tumor pro-gression (mean age at occurrence of palpable abdominal tumor: treated mice, 47.2 days; vehicle-treated control mice, 41.9 days; HR = 9.3, 95% CI = 2.65 to 32; P < .001; Figure 1, A). To explore the role of ABCC1 in tumorigenesis, mice lacking the Abcc1 gene (Abcc12/2) were crossed with hMYCN transgenic mice and the
progeny monitored for tumor formation. Loss of one allele of Abcc1 (Abcc11/2), and hence reduced expression of ABCC1
(Supplementary Figure 4, available online), resulted in an increase in tumor latency in mice homozygous for the hMYCN transgene by comparison with wild-type (wt) Abcc11/1 mice (mean age for
occurrence of palpable abdominal tumor: Abcc11/1 mice [n = 50],
8.2 weeks; Abcc11/2 mice [n = 106], 9.2 weeks; HR = 1.63, 95%
CI = 1.24 to 2.7; P = .003). Surprisingly, the statistical significance of this effect was lost upon complete deletion of Abcc1 (mean age for occurrence of palpable abdominal tumor: Abcc11/1 mice [n = 50],
8.2 weeks; Abcc12/2 mice [n = 49], 8.6 weeks; HR = 1.1, 95% CI =
0.7 to 1.6; P = .7). Loss of one allele of Abcc1 also decreased tumor incidence in mice hemizygous for hMYCN by comparison with mice possessing both alleles of Abcc1 (tumor incidence: Abcc11/2
mice [n = 329], 12%; Abcc11/1 mice [n = 160], 21%; OR = 1.88,
95% CI = 1.13 to 3.11; P = .02, Fisher exact test; Figure 1, B). In mice completely lacking Abcc1, there was no further impact on incidence by comparison with mice lacking one allele of Abcc1 (tumor incidence: Abcc11/2 mice [n = 329], 12%; Abcc12/2 mice
[n = 169], 15%; OR = 1.3, 95% CI = 0.77 to 2.24; P = .33, Fisher exact test; Figure 1, B).
ABCC1 and ABCC4 Expression and Neuroblastoma Cell Biology
In light of these observations and our previous finding that high ABCC4 expression is associated with poor outcome in neuroblas-toma patients not treated with any drugs known to be substrates of ABCC4 (12), we sought to investigate the roles of ABCC1 and ABCC4 in neuroblastoma cell biology. Efficient depletion of ABCC1 and ABCC4 was achieved using siRNA in the MYCN-amplified human neuroblastoma cell line, BE(2)-C (Figure 2, A).
ABCC1 depletion led to impaired cell motility, as measured by the ability to move into an artificial wound (mean % of wound open ± 95% CI: ABCC1, 38.6 ± 6.9 vs control, 7.0 ± 3.5, P < .001, two-sided Student t test, four independent experiments; Figure 2, B and C). The decreased wound-filling ability was attributable to impaired cell motility rather than decreased proliferation, because cells depleted of ABCC1 showed only a modest, although statisti-cally significant decrease in thymidine incorporation (mean % of control ± 95% CI: ABCC1, 91.7 ± 1.4; P = .01, one-sample Student t test, three independent experiments; Figure 2, D). The BE(2)-C cells depleted of ABCC1 also displayed a substantial impairment in colony-forming ability (mean number of colonies ± 95% CI: ABCC1, 19.8 ± 2.7 vs control, 26.0 ± 3.3, P = .006, two-sided Student t test, three independent experiments; Figure 2, E), whereas morphological differentiation, as assessed by neurite extension, was only slightly increased (mean % neurite-positive cells ± 95% CI: ABCC1, 4.3 ± 0.78 vs control, 2.0 ± 0.4, P = .02, two-sided Student t test, three independent experiments; Figure 2, F).
By contrast with ABCC1, depletion of ABCC4 from BE(2)-C cells resulted in markedly increased morphological differentiation (mean % neurite-positive cells ± 95% CI: ABCC4, 14.2 ± 2.4 vs control, 2.0 ± 0.4, P < .001, two-sided Student t test, three inde-pendent experiments; Figure 2, F). ABCC4 depletion was also associated with substantially decreased thymidine incorporation (mean % of control ± 95% CI: ABCC4, 62.3 ± 5.5, P = .005, one-sample t test, three independent experiments; Figure 2, D) and colony-forming ability (mean number of colonies ± 95% CI: ABCC4, 17.8 ± 2.6 vs control, 26.0 ± 3.3, P < .001, two-sided Student t test, three independent experiments; Figure 2, E). There was also some impairment of cell motility in ABCC4-depleted cells (mean % of wound open ± 95% CI: ABCC4, 26.5 ± 8.0 vs control, Figure 1. Role of ABCC1 in neuroblastoma formation in vivo. A)
Administration of ABCC1 inhibitor, Reversan (triangles), and tumor formation in homozygous hMYCN transgenic mice (n = 20) and vehicle-treated controls (n = 9, DMSO; squares). B) Loss of one Abcc1 allele (Abcc11/2) and tumor incidence in hemizygous hMYCN transgenic mice
(hMYCN1/2) compared with mice possessing both alleles of Abcc1
(Abcc11/2 mice, n = 329, Abcc11/1 mice, n = 160, P = .02, two-sided
Fishers exact test). Effect of loss of the second allele (Abcc12/2)
com-pared with mice lacking one allele of Abcc1 (Abcc11/2 mice, n = 329,
Abcc12/2 mice, n = 169, P = .33; two-sided Fisher exact test). Abcc1 =
ATP-binding cassette, subfamily C, member 1; DMSO = dimethyl
sulf-oxide; hMYCN = human v-myc myelocytomatosis viral related
7.0 ± 3.5, P < .001, two-sided Student t test, four independent experiments, Figure 2, C). Combined suppression of ABCC1 and ABCC4 in BE(2)-C cells had no further impact on the magnitude of effect for any of these properties (Figure 2, B–F).
Consistent with a role for ABCC1 in cell motility, MYCN non-amplified SH-SY5Y neuroblastoma cells, which have relatively low levels of MYCN and ABCC1 (29,30), displayed considerably enhanced migratory ability when expressing high levels of exoge-nous ABCC1 in two independent clones: ABCC1 D5 wt and ABCC1 H7 wt (mean % of wound open ± 95% CI: ABCC1 D5 wt,
8.3 ± 5.3 or ABCC1 H7 wt, 13.3 ± 0.4 vs empty vector, 59.9 ± 9.6, P < .001, one-way ANOVA and two-sided t test, three independent experiments, Figure 3, A–C, Supplementary Figure 1, available online). ABCC1 transporter activity is necessary for the observed effects on cell motility, because forced expression of catalytically inactive ABCC1 (ABCC1-D1454N clone B4 or ABCC1-DE1454LL clone B7) had no impact on cell motility (mean % of wound open ± 95% CI: ABCC1 B4, 49.6 ± 4.5 vs empty vector, 59.9 ± 9.6, P = .08; ABCC1 B7, 55.6 ± 9.0 vs empty vector, 59.9 ± 9.6, P = .54, one-way ANOVA and two-sided t test, three independent Figure 2. Impact of ABCC1 and ABCC4
suppres-sion in BE(2)-C human neuroblastoma cells. A) Western blot analysis of ABCC1 and ABCC4 protein expression following exposure of BE(2)-C cells to ABCC1- and ABCC4-specific siRNA molecules, alone or in combination, or to control siRNA (lane 1). B) Representative images of wound closure assay; Scale bar = 125 µm. C) Quantification demonstrating impaired motility of BE(2)-C cells depleted of ABCC1, ABCC4, or both, as measured by wound closure assay for 48 hours. D)
3H-thymidine incorporation assay in BE(2)-C
cells depleted of ABCC1, ABCC4, or both. E) Clonogenic capacity of BE(2)-C cells upon de-pletion of ABCC1 and ABCC4 was assayed after 10 days. F) Neurite extension in BE(2)-C cells upon depletion of ABCC1 and ABCC4. In panels (C), (E), and (F), P values were derived from two-sided Student t test vs control, whereas one-sample t test (H0, µ = 100%) was used in
panel (D). Means are derived from at least three independent experiments. Error bars represent 95% confidence intervals. ABCC =
ATP-binding cassette, subfamily C; siRNA =
experiments; Figure 3, C). High-level expression of ABCC1 in these cells also enhanced colony-forming ability (mean number of colonies ± 95% CI: ABCC1 D5 wt, 97.6 ± 21.8 or ABCC1 H7 wt, 97.0 ± 18.0 vs empty vector, 73.9 ± 4.3, P = .03, one-way ANOVA and two-sided t test, four independent experiments; Figure 3, D). This effect was completely abrogated in cells overexpressing the mutant ABCC1 carrying a single amino acid change in the ABC domain (D1454N) or the catalytically inactive double mutant of ABCC1 (DE1454LL) (mean number of colonies ± 95% CI: ABCC1 B4, 74.8 ± 1.6 vs empty vector, 73.9 ± 4.3, P = .96; ABCC1 B7, 73.5 ± 5.9 vs empty vector, 73.9 ± 4.3, P = .88; one-way ANOVA and two-sided t test, four independent experiments; Figure 3, D). Overexpression of ABCC1 did not affect BrdU in-corporation in SH-SY5Y cells (mean % of empty vector ± 95% CI: ABCC1 D5 wt, 96.5 ± 12.7; ABCC1 H7 wt, 93.7 ± 11.8, P = .68, one-way ANOVA, three independent experiments; Supplementary Figure 5, A, available online).
Next, we examined the impact of genetic or pharmacological suppression of ABCC1 in the MYCN nonamplified neuroblastoma cell line, SH-EP. Again, siRNA-mediated ABCC1 depletion impaired motility (mean % wound open ± 95% CI: ABCC1, 22.7 ± 2.4 vs control, 7.8 ± 4.1, P = .01, two-sided Student t test, three independent experiments; Figure 3, G) and colony-forming ability (mean number of colonies ± 95% CI: ABCC1, 48.5 ± 1.0 vs con-trol, 60.0 ± 2.0, P = .01, two-sided Student t test, two independent experiments, each with two internal replicates; Figure 3, H) of SH-EP cells, whereas the relatively minor effect on thymidine incorporation observed in BE(2)-C cells was not apparent in SH-EP cells (mean % of control ± 95% CI: ABCC1, 98.4 ± 15.7, P = .86, one-sample Student t test, three independent experiments; Supplementary Figure 5, B, available online). Inhibition of ABCC1 by Reversan had even more pronounced effects, in terms of reduced wound closure (mean % wound open ± 95% CI: Reversan, 25.0 ± 11.0 vs DMSO, 4.3 ± 1.8, P = .01, two-sided Student t test, three independent experiments; Figure 3, I and J) and colony-forming ability (mean number of colonies ± 95% CI: Reversan, 58.7 ± 12.3 vs DMSO, 124.7 ± 24.7, P = .01, two-sided Student t test, three independent experiments, Figure 3, K), than siRNA-mediated ABCC1 suppression, and also in terms of decreased thymidine incorporation (mean % of DMSO control ± 95% CI: Reversan, 65.0 ± 12.9, P = .033, one-sample Student t test, three independent experiments; Supplementary Figure 5, C, available online). In addition to a reduction in colony number, inhibition of ABCC1 by Reversan also resulted in an effect on colony size, whereby a greater proportion of large (>300 cells) colonies were noted in the controls compared with colonies arising from Reversan-treated SH-EP cells (mean number of large colonies ± 95% CI: DMSO, 99 ± 29.4 vs Reversan, 33 ± 7.25, P = .01, two-sided Student t test, three independent experiments; Supplementary Figure 5, D, available online). Thus, modulation of ABCC1 by siRNA-mediated suppression, forced expression, or pharmacological inhibition, consistently affected cell motility and clonogenicity in three different neuroblastoma cell lines.
The phenotypic changes observed upon depletion of ABCC4 in BE(2)-C cells using SMARTpool siRNA, involving enhancement of neurite extension and accompanied by decreased thymidine incorporation and colony formation, were investigated further by
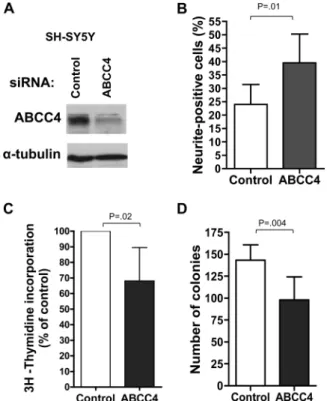
targeting ABCC4 with individual siRNA duplexes and by exam-ining the effect of ABCC4 suppression in an independent cell line SH-SY5Y. Of the four SMARTpool component duplexes (desig-nated duplex 1 through 4), only duplex 1 was found to effectively suppress ABCC4 expression (Supplementary Figure 6, A, available online; data not shown). However, efficient suppression of ABCC4 expression was also achieved using an independent sequence tar-geting ABCC4 (18) (Supplementary Figure 6, A, available online, ABCC4.5). Using either of these sequences to target ABCC4 in BE(2)-C cells, even more pronounced effects on neurite extension (mean % neurite-positive cells ± 95% CI: ABCC4.1, 17.8 ± 4.9 or ABCC4.5, 27.3 ± 3.3 vs control, 2.6 ± 1.6, P < .001, one-way ANOVA and two-sided t test, three independent experiments; Supplementary Figure 6, B, available online), thymidine incorpo-ration (mean % of control ± 95% CI: ABCC4.1, 55.0 ± 11.4, P =.004; ABCC4.5, 45.9 ± 20.6, P = .014, one-way ANOVA and one-sample t test, three independent experiments; Supplementary Figure 6, C, available online), and colony formation (mean number of colonies ± 95% CI: ABCC4.1, 27.6 ± 3.9 or ABCC4.5, 30.8 ± 9.6 vs control, 54.8 ± 7.6, P < .001, one-way ANOVA and two-sided t test, three independent experiments; Supplementary Figure 6, D, available online) than had been evident with the SMARTpool siRNA were observed. Upon depletion of ABCC4 in SH-SY5Y cells using SMARTpool siRNA (Figure 4, A), the results obtained were entirely consistent with those observed in the BE(2)-C cell line. Thus, ABCC4 suppression resulted in a substantial increase in the proportion of cells extending neuritic processes, despite the high basal level of neurites for this cell line (mean % neurite- positive cells ± 95% CI: ABCC4, 39.5 ± 6.7 vs control, 24.0 ± 4.5, P = .01, two-sided Student t test, three independent experiments; Figure 4, B). This increased morphological differentiation was accompanied by statistically significantly reduced thymidine incor-poration (mean % of control ± 95% CI: ABCC4, 68.1 ± 13.1, P = .02, one-sample Student t test, three independent experiments; Figure 4,C) and colony-forming ability (mean number of colonies ± 95% CI: ABCC4, 98.1 ± 16.3 vs control, 143.2 ± 10.8, P = .004, two-sided Student t test, three independent experiments; Figure 4, D). Finally, we examined the effect of pharmacological inhibition of ABCC4 on the behavior of BE(2)-C cells. Although there is a cur-rent lack of potent and specific ABCC4 inhibitors, we have identi-fied, through chemical small-molecule library screening, a number of compounds that sensitize ABCC4-overexpressing cells to the well-characterized ABCC4 substrate, 6-mercaptopurine (6-MP), and that enhance 14C-6-MP accumulation in these cells.
Importantly, among these compounds, we have identified at least two that substantially reduce the growth of BE(2)-C cells and enhance their neurite formation (data not shown), thus closely recapitulating the effects of siRNA-mediated ABCC4 depletion.
Together, these data indicate that in the absence of chemother-apeutic agents, modulation of ABCC1 or ABCC4 can influence multiple neuroblastoma cell characteristics relevant to tumor progression.
ABCC Family Gene Expression and Outcome in Primary Neuroblastoma
In addition to ABCC1, other members of the C branch of the ABC transporter family expel both cytotoxic drugs and a range of
Figure 3. Impact of ABCC1 modulation in SH-SY5Y and SH-EP neuro-blastoma cells. A) Western blot analysis of ABCC1 protein expression following stable transduction of SH-SY5Y cells with either empty vector, wild-type (wt) ABCC1 (clones D5, H7), ABCC1 D1454N single mutant (clone B4), or ABCC1 DD1454LL double mutant (clone B7) con-structs. Refer to Supplementary Figure 1 (available online) for verifica-tion of membrane-localized transporter expression. B) Representative images of wound closure assay; Scale bar = 125 µm. C) Expression of ABCC1-wt and motility of SH-SY5Y cells, as measured by wound clo-sure assay for 24 hours, compared with catalytically inactive mutants. D) Quantification of colony-forming assay upon expression of ABCC1-wt or catalytically inactive mutants in SH-SY5Y cells. In panels (C) and (D), one-way analysis of variance followed by two-sided t tests vs control were used to generate P values. E) Western blot analysis of ABCC1
protein expression following exposure of SH-EP cells to ABCC1-specific siRNA, or to control siRNA. F) Representative images of wound closure assay; Scale bar = 125 µm. G) Quantification indicating impaired wound closure ability upon ABCC1 suppression. H) ABCC1 depletion and impaired forming ability. I, J) Wound closure and K) colony-forming abilities of SH-EP cells upon pharmacological inhibition of ABCC1 using 5 µM Reversan. Means displayed in all panels are derived from at least three independent experiments except for the clonogenic-ity assay of siRNA-transfected SH-EP cells (H), which was derived from two independent experiments, each with two internal replicates. In panels (G), (J), and (K), P values were derived from the two-sided Student t test vs control. Error bars represent 95% confidence intervals. ABCC1 = ATP-binding cassette, subfamily C, member 1; DMSO, dimethyl sulfoxide; siRNA = short interfering RNA.
endogenous substrates that are capable of influencing tumor behavior [reviewed in (11,31,32)]. Having established that ABCC1 can affect the behavior of neuroblastoma cells both in vitro and in vivo and that ABCC4 can also influence neuroblastoma cell Figure 4. Impact of ABCC4 suppression in SH-SY5Y neuroblastoma cells. A) Western blot analysis of ABCC4 protein expression following exposure of SH-SY5Y cells to ABCC4-specific SMARTpool siRNA, or to control siRNA. B) Enhanced neurite extension in SH-SY5Y cells upon depletion of ABCC4. C) 3H-thymidine incorporation in SH-SY5Y cells
depleted of ABCC4. D) Clonogenic capacity upon depletion of ABCC4 was assayed after 12 days. In panel (B) and (D), P values were derived from two-sided Student t test vs control, whereas one-sample t test was used in panel (C) (H0, µ = 100%). Means are derived from three replicate
experiments and error bars represent 95% confidence intervals. ABCC4 = ATP-binding cassette, subfamily C, member 4; siRNA = short inter-fering RNA.
Table 1. Clinical and molecular characteristics of neuroblastoma patient tumors*
Clinical characteristic
No. of patients
MYCN amplification ABCC1 expression ABCC3 expression ABCC4 expression
Present Absent High Low High Low High Low
Age† <1 y 3 93 12 84 87 8 9 87 >1 y 20 91 8 104 67 45 11 101 Tumor stage‡ Favorable 1 105 8 98 87 18 6 100 Unfavorable 22 65 12 76 56 32 14 74
* Two hundred and nine study patients; Categories are overlapping. MYCN amplification was considered absent if there were nine or fewer FISH signals for MYCN per tumor cell and present if there were more than nine signals. Status of two case patients was unknown. For ABCC1 and ABCC4, the level of expression was considered high or low in relation to the upper decile of DDCt values for all tumors analyzed. For ABCC3, the level of expression was considered high or low in relation to the lower quartile of DDCt values for all tumors analyzed. DDCt method is the comparative threshold cycle method of transcript quantification. ABCC =
ATP-binding cassette, subfamily C; FISH = Fluorescence in situ hybridization; MYCN = v-myc myelocytomatosis viral related oncogene, neuroblastoma derived.
† Age (categorized as <1 or >1 year at diagnosis) was statistically significantly associated with MYCN amplification (P < .001) and with ABCC3 expression (P < .001) (Two-sided Fisher exact tests). Age was unknown for one patient.
‡ Tumor stage was categorized as favorable (INSS stages 1, 2A/2B, or 4S) or unfavorable (INSS stages 3 or 4) and was unknown in 15 case patients. Tumor stage was statistically significantly associated with MYCN amplification (P < .001), ABCC3 expression (P = .003), and ABCC4 expression (P = .03) (Two-sided Fisher’s exact tests). INSS = International Neuroblastoma Staging System.
characteristics, we assessed whether the expression of other ABCC family members was associated with clinical outcome in this disease and whether their effects might be independent of cyto-toxic drug efflux. We therefore analyzed the expression of the remaining ABCC family members (including ABCC4, which had previously been investigated only in a small retrospective study) in 209 prospectively accrued primary neuroblastomas (refer to Materials and Methods and Supplementary Figure 3, available online, for cohort description). Initial examination of ABCC gene family mem-bers revealed that expression levels of ABCC6, ABCC7, and ABCC10–12 were either extremely low or undetectable in a repre-sentative subset of neuroblastoma samples. These genes were not examined further. Expression levels of the remaining genes, ABCC2-5 and ABCC8-9, were determined for the entire neuroblastoma cohort by real-time polymerase chain reaction.
Like ABCC1, which we previously showed to be highly expressed in tumors with MYCN amplification (5,6), we found statistically significantly higher levels of ABCC4 expression in neu-roblastomas with MYCN amplification (n = 23), compared with those without MYCN amplification (n = 184) (mean DDCt ± 95% CI: MYCN-amplified, 962 ± 495.9 vs MYCN nonamplified, 96 ± 21.6, P < .001, two-sided Student t test). ABCC4 expression was also associated with advanced tumor stage (Table 1; P = .03). We also observed a strong inverse association between ABCC3 expres-sion and advanced tumor stage (Table 1; P = .003) and also older age at diagnosis (Table 1; P < .001). Expression of ABCC8 and ABCC9 was associated with MYCN amplification (mean DDCt ABCC8 ± 95% CI: MYCN-amplified, 53 ± 33.3 vs MYCN nonam-plified, 29 ± 6.9, P = .04, and mean DDCt ABCC9 ± 95% CI: MYCN-amplified, 5.2 ± 7.3 vs MYCN nonamplified, 3.9 ± 0.33, P = .02, two-sided Student t tests). Whereas expression of ABCC2, ABCC5, and ABCC9 was associated with older age at diagnosis (Supplementary Table 2, available online), there were no associa-tions between expression of ABCC2, ABCC5, or ABCC8-9 and tumor stage (Supplementary Table 2, available online).
As previously described for this cohort, ABCC1 expression was found to be strongly associated with outcome following dichotomization
around the upper decile (5). Using this same cut point, high ABCC4 expression was also strongly associated with reduced event-free survival (HR = 4.7, 95% CI = 2.5 to 8.9; P < .001) and overall survival (HR = 5.4, 95% CI = 2.8 to 10.4; P < .001; Table 2 and Supplementary Figure 7, A, available online), consistent with earlier findings in a smaller separate cohort (12). Again, none of the patients in this study were treated with any cytotoxic drugs that are substrates of ABCC4. Similar results were obtained when the data were dichotomized using the mean or upper quartile as cut points (data not shown). In contrast, low levels, rather than high levels, of ABCC3 expression were strongly associated with reduced event-free survival (HR = 2.4, 95% CI = 1.4 to 4.2; P = .001) and reduced overall survival (HR = 2.4, 95% CI = 1.3 to 4.3; P = .003; Table 2 and Supplementary Figure 7, D, available online), with 23 of 53 patients with low ABCC3 expression experiencing recurrence or death compared with 31 of 155 patients with high ABCC3. This result remained statistically significant whether the upper quartile, median, or lower quartile was used for dichotomization, with the lower quartile maximally differentiating outcome of patients. No other ABCC genes predicted outcome, regardless of the cut point used (Supplementary Table 3, available online).
ABCC1 expression was highly prognostic in subsets of patients expected to have either particularly poor or particularly good out-come (5). Extending this observation, in patients with advanced disease (stages 3 and 4), high ABCC4 or low ABCC3 expression was associated with statistically significantly worse outcome (% 5-year event-free survival ± 95% CI: high ABCC4, 21 ± 43.1 vs low ABCC4, 54 ± 23.5, P < .001 and % 5-year event-free survival ± 95% CI: low ABCC3, 34 ± 33.3 vs high ABCC3, 57 ± 25.5, P = .03; Supplementary Figure 7, B and E, available online). Similarly, for patients without MYCN amplification, low-level ABCC4 or high-level ABCC3 expression was associated with better outcome compared with patients having high ABCC4 or low ABCC3 expres-sion (% 5-year event-free survival ± 95% CI: high ABCC4, 53 ± 66.6 vs low ABCC4, 80 ± 11.8, P = .022 and % 5-year event-free
survival: low ABCC3, 63 ± 27.4 vs high ABCC3, 84 ± 13.7, P = .0016; Supplementary Figure 7, C and F, available online).
In testing for the independent prognostic significance of ABCC1, ABCC3, and ABCC4 gene expression in a model with tumor stage, age, and MYCN amplification, only stage (HR of re-currence or death = 4.5, 95% CI = 2.1 to 9.9; P < .001) and the three ABCC genes (HR, high ABCC1 = 2.3, 95% CI = 1 to 5; P = .04; low ABCC3 = 2.3, 95% CI = 1.2 to 4.4; P = .01; high ABCC4 = 3.1, 95% CI = 1.2 to 7.7, P = .02) remained associated with event-free survival (Table 2). Age and MYCN amplification were not independently statistically significant in this model. The only factors that retained independent prognostic significance for overall survival were tumor stage (HR of death = 9.5, 95% CI = 3.2 to 27.6; P < .001) and ABCC4 expression (HR of death = 3.2, 95% CI = 1.2 to 8.3; P = .02).
Given the strong association between altered expression of these three transporters and clinical outcome, we examined the prognostic value of their combined expression pattern. In this analysis, there were eight possible combinations based on high or low expression of the three genes. These eight combinations were descriptively compared with Kaplan–Meier curves, and clusters were recategorized into groups, such that curves not statistically significantly different from one another were included in the same group (Figure 5, A). These statistical groupings were subsequently found to accurately reflect biological risk associated with ABCC gene expression. Group A included only those patients whose tumors displayed low levels of ABCC1 and ABCC4 and high levels of ABCC3, reflecting “favorable” ABCC gene expression. The 5-year cumulative event-free survival rate of this group was 85% (95% CI = 77% to 90%). Group B consisted of patients whose tumors displayed only one unfavorable risk factor with respect to the three ABCC genes analyzed (ie, ABCC1 high, ABCC4 high, or ABCC3 low), and the event-free survival rate of this group was 60% (95% CI = 47% to 71%). Group C was found to comprise patients whose tumors exhibited two or more unfavorable ABCC risk factors, and the event-free survival rate of patients in this Table 2. Univariate and multivariable Cox regression analysis of factors prognostic for outcome in neuroblastoma*
Factor
Event-free survival Overall survival
HR (95% CI)† P‡ HR(95% CI) P‡
Univariate
High ABCC1 expression (n = 209) 3.8 (2.0 to 7.2) <.001 3.4 (1.7 to 6.8) .001
Low ABCC3 expression (n = 208) 2.4 (1.4 to 4.2) .001 2.4 (1.3 to 4.3) .003
High ABCC4 expression (n = 209) 4.7 (2.5 to 8.9) <.001 5.4 (2.8 to 10.4) <.001
Multivariable (n = 192)§
High ABCC1 expression 2.3 (1.0 to 5.0) .04 1.7 (0.7 to 3.9) .21
Low ABCC3 expression 2.3 (1.2 to 4.4) .01 1.9 (1.0 to 3.8) .06
High ABCC4 expression 3.1 (1.2 to 7.7) .02 3.2 (1.2 to 8.3) .02
Advanced tumor stage 4.5 (2.1 to 9.9) <.001 9.5 (3.2 to 27.6) <.001
Older age 1.8 (0.8 to 3.8) .14 2.1 (0.9 to 4.9) .10
MYCN amplification 1.02 (0.5 to 2.3) .96 1.1 (0.5 to 2.6) .75
* MYCN amplification was considered absent if there were nine or fewer FISH signals for MYCN per tumor cell and present if there were more than nine signals. Status of two case patients was unknown. For ABCC1 and ABCC4, the level of expression was considered high or low in relation to the upper decile of DDCt values for all tumors analyzed. For ABCC3, the level of expression was considered high or low in relation to the lower quartile of DDCt values for all tumors analyzed. DDCt method is the comparative threshold cycle method of transcript quantification. ABCC = ATP-binding cassette, subfamily C; FISH = Fluorescence
in situ hybridization; MYCN = v-myc myelocytomatosis viral related oncogene, neuroblastoma derived.
† Hazard ratios were calculated as the antilogs of the regression coefficients in the proportional hazards regression. ‡ Univariate: log-rank test; Multivariable: Cox model.
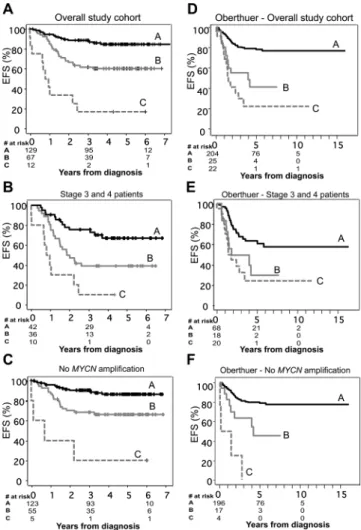
group was 17% (95% CI = 3% to 41%). The combined expression of ABCC1, ABCC3, and ABCC4 was associated with patients having an adverse event, such that of the 12 patients with the “poor prognosis” expression pattern, 10 experienced recurrence or death. Figure 5. Prognostic significance of ABCC gene expression in neuro-blastoma. A) Combined expression of the ABCC1, ABCC3 and ABCC4 genes and cumulative event-free survival (EFS) in 209 patients with neuroblastoma. Patients were categorized into eight clusters on the basis of their combined ABCC1, ABCC3, and ABCC4 expression pattern. Kaplan–Meier survival analysis of these clusters revealed three statisti-cally distinct groupings (Groups A, B, and C), which were associated with the risk of relapse associated with individual ABCC gene expres-sion. Group A included only those patients whose tumors displayed low levels of ABCC1 and ABCC4 and high levels of ABCC3, reflecting “favorable” ABCC gene expression. Group B consisted of patients whose tumors displayed only one unfavorable risk factor with respect to the three ABCC genes analyzed (ie, ABCC1 high, ABCC4 high, or
ABCC3 low), and Group C comprised patients whose tumors exhibited
two or more unfavorable ABCC risk factors. Similar associations between combined ABCC gene expression and increasingly poor out-come were also observed in subgroups of patients (B) with stage 3 or 4 disease or (C) whose tumors lacked MYCN amplification. D) Combined expression of the ABCC1, ABCC3, and ABCC4 genes and cumulative EFS in 251 neuroblastoma patient samples analyzed by Oberthuer et al. (27). Patients in the Oberthuer et al. (27) cohort were categorized into eight groups as described for panel (A) above. These groupings were also strongly predictive of EFS in subgroups of patients (E) with unfa-vorable (stages 3 and 4) disease or (F) with non–MYCN-amplified disease. At 0, 3, and 6 years from diagnosis [Panels (A), (B), and (C)], or 0, 5, and 10 years from diagnosis [Panels (D), (E), and (F)], the number of patients at risk of relapse are shown. ABCC = ATP-binding cassette,
subfamily C; MYCN = v-myc myelocytomatosis viral related oncogene, neuroblastoma derived.
Patients in this group were 12 times more likely to have an adverse event (HR of recurrence or death = 12.3; 95% CI = 6 to 27; P < .001). Combined ABCC gene expression was also analyzed in sub-groups of patients with unfavorable (stages 3 and 4) disease (Figure 5, B) or without MYCN amplification (Figure 5, C) and found for each case to be highly prognostic of outcome. The risk of an adverse event for Group C patients was high in both subgroups with a hazard ratio of 6.4 (95% CI = 3 to 15; P < .001) for patients with stage 3 or 4 tumors and 13.9 (95% CI = 5 to 42; P < .001) for patients without MYCN amplification.
Multivariable analysis of combined expression of the ABCC1, ABCC3, and ABCC4 genes, including tumor stage, age, and MYCN amplification as variables, revealed stage and unfavorable expres-sion of one (Group B) or more (Group C) ABCC genes as indepen-dent indicators of event-free survival, with the hazard ratio for an adverse event in Group B being 2.05 (95% CI = 1 to 4; P = .033) and in Group C being 5.02 (95% CI = 2 to 14; P = .001).
Validation of Prognostic Significance of ABCC1, ABCC3, and ABCC4 in an Independent Dataset
To verify the prognostic significance of ABCC gene expression in an independent cohort, we analyzed a publicly available dataset from Oberthuer et al. (27) containing clinical, pathological, and gene expression data for 251 primary neuroblastoma tumors. From this dataset, normalized expression data generated by custom oligo-nucleotide microarray hybridization were extracted for ABCC1, ABCC3, and ABCC4 and the association with clinical outcome examined. Again, high expression of either ABCC1 (HR of recur-rence or death = 4.7; 95% CI = 2.7 to 8.1; P < .001) or ABCC4 (HR = 3.95; 95% CI = 2.3 to 6.8; P < .001) was strongly associated with reduced event-free survival, as was low expression of ABCC3 (HR = 3.35; 95% CI = 1.9 to 5.95; P < .001). Furthermore, when patients were grouped according to the combined expression pat-tern of ABCC1, ABCC3, and ABCC4 as described above, these groupings were again found to distinguish good, intermediate, and poor patient outcome (Figure 5, D). Five-year cumulative event-free survival was 77% (95% CI = 70% to 83%) in Group A, which included only those patients whose tumors displayed low levels of ABCC1 and ABCC4 and high levels of ABCC3 reflecting favorable ABCC gene expression, whereas event-free survival in Group B was 41% (95% CI = 19% to 63%) and in Group C only 22% (95% CI = 2.4 to 41%; P < .001). These groupings were also strongly predictive of event-free survival in subgroups of patients with unfa-vorable (stages 3 and 4) disease (Group A = 57% [95% CI = 44% to 71%], Group B = 30% [95% CI = 4.2% to 55%], Group C = 24% [95% CI = 2.9% to 45%], P < .001; Figure 5, E) or with non–MYCN-amplified disease (Group A = 77% [95% CI = 71% to 84%], Group B = 45% [95% CI = 18% to 72%], Group C = 0% [95% CI = 0% to 0%], P < .001; Figure 5, F). Of the other ABCC genes examined, expression data for ABCC2 and ABCC8 were also available in this dataset. Consistent with our study, neither of these genes was statistically significantly associated with patient outcome.
ABCC3 Expression and Neuroblastoma Cell Characteristics
Surprisingly, the analysis of ABCC gene expression in two independent cohorts of neuroblastoma patients demonstrated a
powerful independent association between low levels of ABCC3 expression and clinical outcome. Although patients in both cohorts were treated with etoposide (5,27,33), an ABCC3 substrate, only an association between high-level expression of an ABCC family member and poor clinical outcome could be explained in terms of enhanced drug transport mediating chemotherapeutic drug resis-tance and hence clinical outcome.
To investigate the significance of low ABCC3 expression in neuroblastoma, BE(2)-C cells, which have extremely low endoge-nous levels of ABCC3, were transduced to constitutively express ABCC3. Stable clones expressing ABCC3 (Figure 6, A) displayed substantially impaired cellular migratory activity, as measured by wound closure ability (mean % of wound open ± 95% CI: ABCC3 B12 wt, 55.0 ± 9.0 or ABCC3 A12 wt, 50.5 ± 4.5 vs empty vector, 1.5 ± 2.0, P < .001, one-way ANOVA and two-sided t test, three independent experiments; Figure 6, B and C), and reduced colony-forming capacity (mean number of colonies ± 95% CI: ABCC3 B12 wt, 75.1 ± 2.35 or ABCC3 A12 wt, 73.9 ± 2.7 vs empty vector, 90.9 ± 9.4, P =.03, one-way ANOVA and two-sided t test, three
independent experiments; Figure 6, C), although no statistically significant impact on cell proliferation was observed (mean % of empty vector ± 95% CI: ABCC3 B12 wt, 83.4 ± 9.0; ABCC3 A12 wt, 87.6 ± 9.6, P = .22, one-way ANOVA, three independent ex-periments, Figure 6, E). Similar results were obtained upon stable expression of ABCC3 in mass-transfected pools (Supplementary Figure 8, available online). ABCC3 transport activity is necessary for the observed effects on cell motility and clonogenicity, because the wound closure and colony-forming ability of cells expressing catalytically inactive ABCC3 (ABCC3-V1322F) were indistin-guishable from cells transfected with empty vector (mean % of wound open ± 95% CI: ABCC3 C4, 5.4 ± 4.3 vs ABCC3 D1, 3.0 ± 2.4 vs empty vector, 1.5 ± 2.0, P = .34, one-way ANOVA, three independent experiments; Figure 6, C and mean numberof colonies ± 95% CI: ABCC3 C4, 91.1 ± 6.5 vs ABCC3 D1, 92.0 ± 7.4 vs empty vector, 90.9 ± 9.4, P = .98, one-way ANOVA, three independent experiments; Figure 6, D).
Collectively, these data clearly indicate that ABCC1, ABCC3, and ABCC4 have the ability to affect multiple aspects of tumor cell
Figure 6. Impact of ABCC3 gene expression on human BE(2)-C neuroblastoma cell char-acteristics. A) Western blot analysis of ABCC3 protein expression following stable transduction of BE(2)-C cells with either empty vector, wild-type (wt) ABCC3 (clones A12, B12) or ABCC3 V1322F mutant (clones C4, D1) constructs. Refer to Supplementary Figure 2 (available online) for verification of membrane-localized transporter expression. B) Representative images of wound closure assay; Scale bar, 125 µm. C) Expression of ABCC3-wt and impaired motility of BE(2)-C cells, as measured by wound closure assay for 24 hours, compared with catalytically in-active mutant. D) Colony-forming assay and E) Bromodeoxyuridine (BrdU) incorporation upon expression of ABCC3-wt or catalytically inactive mutant in BE(2)-C cells. One-way analysis of variance followed by two-sided
t tests vs control were used to generate P values. Means are derived from three
rep-licate experiments and error bars represent 95% confidence intervals. ABCC3 = ATP-binding cassette, subfamily C, member 3.
phenotype, independent of any role in cytotoxic drug efflux and drug resistance.
Discussion
Although several studies suggest that ABC drug transporters contribute to tumor progression independent of their drug efflux capabilities [reviewed in (11)], the evidence has remained essen-tially correlational to date. The current study provides direct ge-netic evidence that an ABC transporter, ABCC1, can contribute to tumor development in a mouse cancer model. Furthermore, this study demonstrates that high-level expression of ABCC4 and low-level expression of ABCC3 are both highly associated with clinical outcome in patients with neuroblastoma, a result not accounted for by the cytotoxic drug efflux capacities of either protein. The combined expression of ABCC1, ABCC3, and ABCC4 stratified patients into groups having excellent, interme-diate, or poor outcome, and this combination of factors is one of the most powerful independent prognostic markers yet, to our knowledge, identified for this disease. Finally, this study demon-strates that each of these transporters affects multiple character-istics of cultured neuroblastoma cells, providing initial insights into the physiological function of these transporters beyond drug efflux.
The ABCC branch of the ABC transporter superfamily con-tains several transporters known to confer cellular resistance to clinically important chemotherapeutic agents (9). The best charac-terized of these, ABCC1, transports several classes of chemothera-peutic drugs commonly used in the treatment of neuroblastoma including Vinca alkaloids, epipodophyllotoxins, and anthracyclines. We found that pharmacological inhibition of ABCC1 using Reversan, or deletion of one Abcc1 allele, delays tumor formation in the hMYCN transgenic mouse model of neuroblastoma in the absence of antineoplastic agents. Consistent with this observation, siRNA-mediated depletion of ABCC1 or inhibition of ABCC1 with Reversan in neuroblastoma cell lines impaired cell motility and clonogenic capacity, also in the absence of chemotherapeutic agents. These results reinforce earlier observations in which intro-duction of antisense mRNA to ABCC1 into neuroblastoma cells resulted in reduced cell growth and increased apoptosis in cell culture or cell line xenograft models (29,34). Conversely, forced high-level expression of ABCC1 enhanced cell migratory ability and clonogenic ability, with these effects shown to be dependent on the ATP-driven efflux capacity of ABCC1. Together, these results provide compelling evidence for a role for ABCC1-mediated efflux of endogenous cellular substrates in neuroblas-toma biology.
We have now found high ABCC4 expression to be strongly predictive of poor outcome in three independent cohorts. In con-trast to the broad substrate specificity of ABCC1, ABCC4 overex-pression has been shown to confer resistance only to nucleoside analogs and topoisomerase poisons, such as camptothecin, irinote-can, and topotecan (9,35,36), none of which were used to treat the patients within any of these cohorts. In addition, this study identi-fied low, rather than high, expression of ABCC3 as being predictive of poor outcome, despite the ability of ABCC3 to expel the impor-tant neuroblastoma chemotherapeutic, etoposide. Consistent with
these observations, siRNA-mediated silencing of ABCC4 using either SMARTpool siRNA or either of two independent siRNA duplexes in two different neuroblastoma cell lines, led to an increase in morphological differentiation and reduced growth capacity, with these effects being faithfully recapitulated by chemical small molecules that inhibit ABCC4-mediated drug efflux. By comparison, the most prominent phenotype associated with ABCC1 modulation was altered cell motility, with little impact on morphological differentiation. Although depletion of either gene impaired colony-forming ability, suggesting that these proteins may share some functions, ABCC4 modulation had a substantially more pronounced effect on proliferation, as measured by
3H-thymidine or BrdU incorporation, perhaps pointing to distinct
mechanisms. Consistent with low-level expression of ABCC3 being associated with poor clinical outcome in neuroblastoma, overex-pression of ABCC3 led to decreased cell motility and colony for-mation, with these effects again being shown to be dependent on the catalytic activity of ABCC3 and suggesting involvement of efflux of cellular substrates important to neuroblastoma biology. The finding that forced expression of ABCC3 mirrored the effects of ABCC1 depletion suggests opposing roles for these proteins in neuroblastoma.
Thus, although high ABCC1 expression in neuroblastoma can clearly contribute to the chemoresistant behavior of this tumor through enhanced drug efflux (5,10), our data provide compelling evidence for an additional and more direct contribution to tumor growth and progression. The prognostic power of high ABCC4 expression and low ABCC3 expression for poor outcome, together with the inability of known cytotoxic drug substrates to account for these associations in the cohorts studied, as well as the impact of modified expression of these genes on neuroblastoma cell pheno-types, all suggest that these transporters may also contribute to neuroblastoma biology and clinical outcome independently of drug efflux. Crossbreeding experiments between MYCN trans-genic mice and Abcc3 and Abcc4 gene knockout models, paralleling those already undertaken with Abcc1 knockout mice, are the essen-tial next steps to determine the true biological impact of these two transporters in neuroblastoma development, progression, and treatment response in vivo. These studies are currently underway and will be important in validating these genes as worthwhile ther-apeutic targets for this disease.
Although the mechanisms underlying these observations are at present unknown, the efflux of endogenous substrates seems to be the most probable. ABCC1 expels a diverse range of physiological substrates including folates, phosphosphingolipids, glutathione, leukotrienes, and glutathione conjugates of steroids, many of which have established roles in tumor development and progres-sion, and the activities of this transporter are important in a range of normal cellular processes such as export of endogenous interme-diates and protection from toxic insult [see (11,37) for recent reviews]. Recently, ABCC1 was found to play a role in migration of thyroid carcinoma cells by mediating efflux of the inflammatory mediator sphingosine-1-phosphate (38) and was responsible for mediating the antiapoptotic effects of glucocorticoids in human fibroblasts by promoting sphingosine-1-phosphate efflux (39). Mice lacking ABCC1 display an altered response to inflammatory stimuli, most likely attributable to decreased secretion of the