Printed in Great Britain
The m = 1 motion of a screw pinch measured
by external magnetic probes
By A. P O C H E L O N AND R. KELLER
Ecole Polytechnique Fe'de'rale de Lausanne, Switzerland Centre de Recherehes en Physique des Plasmas (Received 29 March 1976 and in revised form 24 May 1976)
Measurements of the m = 1 growing mode of a linear screw pinch, by external dipole probes, are compared with the recorded plasma motion on streak photo-graphs. Good agreement is found up to a maximum amplitude which depends on plasma density and growth rate.
1. Introduction
Magnetic dipole coils have already been studied theoretically and experiment-ally (Mirnov 1965; Haberstich & Forman 1969; van Heijningen et al. 1972; de Kock et al. 1974). The problems related to the geometry of the current channel have been studied by several workers (King et al. 1972; Bobeldijk et al. 1973; Stott 1975; Kiyama et al. 1975). The aim of this work is to show the relationship between the detected kink mode signals and the optical traces from streak photo-graphs. This problem is of importance for controlling plasma motion in a feed-back stabilization experiment (Keller et al. 1976). It is also a convenient way of detecting plasma motion in general.
2. Experimental arrangement
The pinch configuration and plasma characteristics are as follows. The theta coil measures 142 cm and has an inner radius b = 4-5 cm. Two slits are machined in the mid-plane for observing the plasma motion in orthogonal directions, 45° above and below the horizontal. The main field reaches 16 Kgauss in 3-8/isec at which time the crowbar is switched on. The quartz discharge tube has an inner diameter of 5 cm. The time evolution of the axial Jz current is similar to that of the main Bs field. Two electrodes, 1-2 cm in diameter, are 142 cm apart, and are pro-tected by limiters in order to concentrate the axial current on the front of the elec-trodes. In this way, definite boundary conditions exist for the pinch. At 45 mTorr Deuterium filling pressure, diamagnetic probe measurements show a mean /? of 0-1 and a mass collection of 85 % at 3 /^sec after the start of the pinch. /? decreases rapidly afterwards. From growth rate measurements we find the Kruskal-Shafranovlimitforthefixed-endscrewpinchat J2 = 2100 Awhich corresponds toa
mean plasma radius of a = 0-8 cm. The same radius is obtained from the luminosity profile. A mean plasma temperature of 11 eV follows from pressure balance.
Cut A-A CutB-B
FIGUBE 1. Arrangement of the dipole coils: 1, Theta coil; 2, Midplane viewing ports; 3, Quartz vessel; 4, Dipole coil holder; 5, Plastic dipole coil core; 6, Adjustment screw for suppressing Bz pick-up.
The magnetic dipole probes are wound on an annular core of A — 0-9 cm2 cross-section, surrounding the discharge tube at a mean radius of r = 3-4 cm. The windings are equally spaced and cover 120° sectors, each of it having
v = 62 turns. The two windings of each probe are connected in parallel, and their
magnetic axes are orthogonal. The probes are located as near as possible to the viewing ports, as shown in figure 1.
To calibrate the probe we proceed in the following way: we place a conducting rod in the discharge tube, parallel to its axis, and we measure the integrated signal as a function of the radial displacement of the rod (King et al. 1972). The perturbation of the azimuthal field is given by
)s(d-6), (1) y being the displacement and
(see (11)) given by
its azimuthal angle, s is a geometrical factor
where a is the radius of the rod, taken equal to the mean plasma radius, b is the inner radius of the theta coil.
Let v' be the winding density of the first probe
dv
= _|! for
7 T- l
n
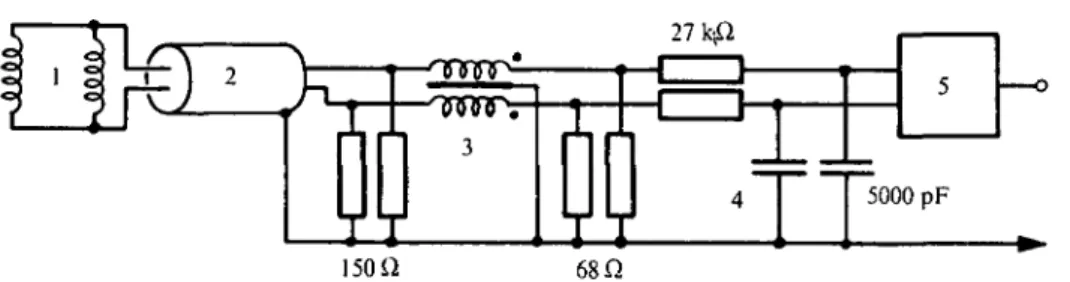
150 Si 68 n
FIGURE 2. Dipole probe circuit: 1, Probe; 2, Bifilar cable 95 Cl; 3, Isolation inductance 6 mH/l-2/tH; 4, Passive integrator; 5, Differential amplifier.
The first Fourier coefficient of the m = 1 winding density is i r2'
n Jo v'cosddd= 1-1 (4)
The choice of an angle of 120° makes the coefficient m = 3 disappear. The next non-zero coefficient is that of the m = 5 mode, and equals —0-22 \v'\. As the azimuthal field decreases rapidly with r (see (12)), the probe shows a sensitivity of only 0-2 % for the m = 5 mode. Thus the winding density may be taken equal to 1-1 \v'\ cos# for the first probe, and 1-1 \v'\ isind for the second. The sum gives a complex winding density of the detection system
M|j/|exp{i0}. (5)
which allows us to condense the detected signals into a complex form with vectorial meaning
U = Ux + iUv = ^ fdt [ "ddRe(B)A \v'\ exp{i0} = yJzCexp{i0}.
iT
iJ JO
(6)
The factor £ comes from the parallel setting of the two halves of one probe. C is the calibration constant which is determined experimentally:
0 =3-3v/i0As
Snrh, ' (7)
Ux and Uy are the integrated signals of the two probes, whose relative amplitudes yield the azimuthal angle ^.T^ is the integration time constant and A is the surface of one winding. The absolute value y of the displacement results from the ratio of the signal \U\ to JZC.
As the probes are exposed to a strong electric field induced in the theta coil, the electrostatic pick-up is important. The parallel setting of the two sectors already improves the situation. It is however necessary to connect the probes symmetrically to a bifilar cable and to integrate separately along both paths before taking the difference. The differential amplifier rejects in principle the common mode, but it stops working correctly when the signal exceeds the satura-tion value. To avoid this inconvenience it has been necessary to attenuate the common mode by means of an isolation inductance, common to both paths. The electrical circuit is shown in figure 2.
dispersion relation and the magnetic field have already been calculated several times (Kadomtsev 1966). We summarize here the results for a rectangular density profile and for large wavelengths.
We consider an infinitely long pinch with deformation wavelength A = — 2n/h. The mode m of the surface motion is described by
rp = a + gm\ (8)
where £(m) is the surface perturbation
y(m) contains the exponential factor exp (yt) where y is the growth rate of the
instability. The perturbation of the azimuthal field Be at a distance r from the axis (r > a) is given by:
B^Z—BJ-j (m + aah)smexv{i[m(d-<f>) + hz]}. (10) Bo = /i0Jj2na is the unperturbed azimuthal field, and a = BJB0 > 1 is the ratio of axial and azimuthal fields. sm is a geometrical factor resulting from image currents circulating at the surface of the exterior conductor and on the
Plasma 1 + W ™
m
l-(a/b)Zm' { '
Expression (10) can be written in the form
^ (12)
Coming directly to the mode m = 1 (omitting the subscript 1), we have
The real part of this expression is the physical value of the field. We notice that the field of the plasma is different from the one of a straight conductor. Only the first term of (13) is identical to expression (1). The dipole coil detects at the same time a field proportional to the tilt d^/dz of the pinch. This field is equal to the transverse component of a field Bz which would have been carried away by the pinch and tilted in the direction d^jdz. The relative phase of the two terms in (13) is equal to the angle between the direction of displacement and the normal to the plane where the tilt occurs (here the angle is zero). The probe signal ceases to be in direct relation with the displacement £ (Bobeldijk, Oomens & van der Laan 1973). The calibration constant depends on the helicity, and even changes sign by crossing the Kruskal-Shafranov limit.
The dispersion relation of an infinitely long pinch can be written as
0 -»ro in o\ ~n i j i \
HPa
where q is the commonly used safety factor
q = —ocah. (15)
We shall now consider the case of our experiment, where the pinch is fixed at the ends. Our measurements (Pochelon & Keller 1974) have effectively shown that the plasma axis forms a sinusoid inscribed on a helix, with its nodes at z = + \L,
L being the distance between the electrodes. This boundary condition requires
a superposition of two m = 1 modes having different wave vectors h:
(16) with K1 = hc-imlL and Ti2 = hc + TrnjL'\
or qx = qc + nAq and q2 = qc — nAq. j By analogy with (15), we have the following relations:
qc = —<xahc and Aq = naa/L. (18) I t is evident that both modes must have the same growth rate. From (14) we have the condition q1[2 — (2—fi)q1] = q2[2 — (2-fi)q2], which determines the
q U a n t l t y 9 c
* . = l/<2-/») (19) and also the growth rate
/i0pa21 \qc
The fundamental component n = 1 becomes unstable when
Aq < qc. (21)
This inequality expresses the condition for exceeding a new Kruskal-Shafranov limit for a fixed-end screw pinch. By introducing these quantities in (16) the perturbation of the plasma surface becomes
in = Vn c o s [nnzjL - \n{n - 1)] exp {i(d -<f> + hcz)}. (22) We have observed, in addition to the fundamental component, a weak excita-tion of the second harmonic n = 2. The two moexcita-tions evolve in the same direcexcita-tion, in other words, the azimuthal angles $ of the two components are the same.
The perturbation of the azimuthal field is calculated from (13) and (22). For the fundamental K = l w e obtain
^ - q c ) cos (nzIL)+ iAq sin (7TZJL)]ex^{i(d-(p + hcz)} (23) •*- ** X f i t
and for the harmonic n = 2
B2 = y2 - ^ f [(1 - qc) sin (2m IL) - 2iAq cos (2m\L]\ exp {i(6 - <j> + hcz)}. (24)
^ [ ( l ) 2 i A2] exp {i(0 - 94)}. (25)
Note that (l — qB) = (l-ft)/(2-ft). The detected signal is calculated after inte-grating (6):
U J C ) { i 4 } 2 b { i t & ) } ] . (26)
The azimuthal angle of the displacement is well detected provided that the amplitude of the n = 2 mode is negligible. In fact, our measurements have shown little difference in direction between the optically and magnetically detected motions, which demonstrates the existence of an n = 2 motion superposed onto the main instability.
The simultaneous detection of several modes would make it necessary to have an equal number of probes carefully placed. The signals would represent a mixture of modes whose separation would require an appropriate method.
4. Experimental results
The integrated signals from the probes, Ux and Uy, are adjusted with respect to the zero trace of the signals, obtained in the absence of axial current. This little perturbation is induced by the axial field Bs, the probes being very sensi-tive to a misalignment. The analysis of the results is made by using (26). Let
Rx and Ry be the coordinates of the magnetic trajectory, obtained by dividing the voltages Ux and Uy by Jz, by the calibration constant C and by the factor (1 — qc), which is equal to (1— /?)/(2 —ft). As ft is small, this last factor is less influenced by the temporal variation of ft. In the figures we report simultaneously the magnetic co-ordinates Rx, Ry and the optical trajectory recorded by an image converter camera.
It would be easy to determine the amplitude ?/2 of the harmonic n = 2 from
the difference of the azimuthal angles, if another phenomenon were not per-turbing the measurements, as will be shown below.
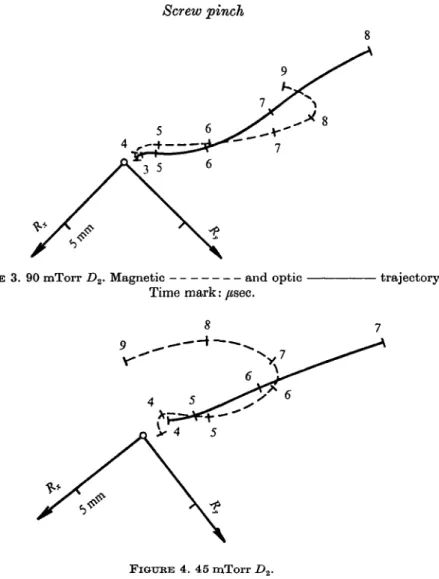
The measurements are made with Deuterium plasma at three different filling pressures. Figure 3 shows the result obtained with a pressure of 90 mTorr. The
Jz current reaches 5800 A at its maximum, which is about 2-5 times the stability limit value. The plasma motion is directed towards the 0-coil slot, which is at the right of the figure. We observe good agreement between optical and magnetic measurements up to an amplitude of 9 mm. The harmonic n = 2 is not apparent, even though it is unstable in the above conditions. Its initial perturbation is then very small.
The measurements at 45 mTorr are shown in figure 4 for the same axial current. The magnetic and optical amplitudes are equal up to about 6 mm. A small difference of azimuthal angle reveals the presence of a component y2 of the harmonic n = 2. From 7 mm the magnetic trajectory changes violently in direction and splits off completely from the optical trajectory. The explanation
FIGURE 3. 90 mTorr Ds. Magnetic and optic Time mark: /tsec.
• trajectory.
FIGURE 4. 45 mTorr Dz.
of this phenomenon can be found on the streak photograph. We notice a plasma filament leaving the central plasma column. It looks very probable that an appreciable part of the axial current is flowing in this filament, which changes the current distribution. The dipole coils measure the centre of the current distribution, whereas the optical trajectories reported in the figures are the ones of the principal column. This instability appears only at large amplitude and we attribute it to a nonlinear effect coming from the growth of an m = 2 mode or eventually a higher one.
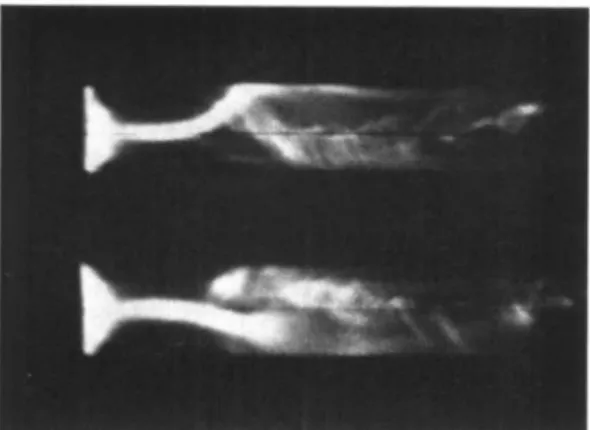
Figure 5 shows results obtained with a filling pressure of 23 mTorr. The above comments are also applicable to this case. Here the Js current is equal to twice the Kruskal-Shafranov limit. The trajectories are equal up to an amplitude of 3 mm. The streak photograph in figure 6 is a stereoscopic view of the kink. I t is overexposed so as to make the separation from the main plasma column visible. The total length of the visible trace is 22 /jsec, and the vertical scale may be read from the spacing between the two zero lines of the traces which corresponds to 7-5 cm.
FIGUBE 5. 23 mTorr D~.
The divergence of magnetic and optical trajectories appears above a certain displacement amplitude depending on filling pressure and growth rate. This phenomenon has also been observed by Kiyama et al. (1975).
5. Conclusion
Magnetic measurements of the gross motion by orthogonal dipole coils show good agreement with the optically measured plasma displacement at high filling pressure. A small amplitude of the n = 2 mode is detectable. At lower densities, the agreement remains until the axial current path splits into plasma filaments, which are visible in overexposed streak photographs.
We wish to thank Mr H. Ripper for technological assistance. This work was supported by the Swiss National Science Foundation.
R E F E R E N C E S
BOBELDIJK, C, OOMENS, A. A. M. & VAN DEB LAAN, P. C. T. 1973 Nucl. Fusion, 13, 121.
DE KOCK, L. C. J., MEDDENS, B. J. H., OBNSTEIN, L. T. M., SCHBAM, D. C. & VAN H E I J -NINGEN, R. J. J. 1974 Rijnhuizen Report 74-86.
HABEBSTICH, A. & FOBMAN, P. R. 1969 Los Alamos Rep. LA 4075-MS, 18.
KADOMTSEV.B.B. 1966 Reviews of Plasma Physics (ed.M.A. Leontovich) vol.2,153. Plenum.
KELLEB, R., POCHELON, A. & BACHMANN, W. 1976 Phys. Rev. Lett. 36, 465.
KING, R. E., ROBINSON, D. C. & VEBHAGE, A. J. L. 1972 J. Phys.D: Appl. Phys. 5, 2015.
KIYAMA, S., NEWTON, A. A. & WOOTTON, A. J. 1975 Nucl. Fusion, 15, 563. MIBNOV, S. V. 1965 Plasma Physics, 7, 325.
POCHELON, A. & KELLEB, R. 1974 Ecole Polytechnique Fe'de'rale de Lausanne LRP 86/74.
STOTT, p E_ 1975 Course on^Plasma Diagnostics and Data Aquisition Systems. Inter-national School of Plasma Physics, Varenna, Italy (ed. A. Eubank & E. Sindoni).
VAN HEIJNINGEN, R. J. J., MABIS, D. J., BOBELDIJK, C. & VAN DEB LAAN, P. C. T. 1972
FIGURE C. 23 mTorr D2. Streak photograpli of the kink.