The effectiveness of policies for
formal knowledge transfer from
European universities and public
research institutes to firms
Franz Barjak
1,*, Nordine Es-Sadki
2and Anthony Arundel
31
School of Business, University of Applied Sciences and Arts Northwestern Switzerland (FHNW), Riggenbachstrasse 16, 4600 Olten, Switzerland, 2Maastricht Economic Research Institute on Innovation and Technology (UNU-MERIT), United Nations University and Maastricht University, Keizer Karelplein 19, 6211 TC Maastricht, The Netherlands and3Australian Innovation Research
Centre (AIRC), University of Tasmania, Hobart 7004, Australia and UNU-MERIT, Keizer Karelplein 19, 6211 TC Maastricht, The Netherlands
*Corresponding author. Email: [email protected]
We use survey data for 247 European universities and 40 public research organizations to investigate the effects of institutional policies on four outcomes of transfer performance (R&D agreements with companies, patent applications, licence agreements, and start-ups established). We find that the effects of policies to establish clear rules, improve transparency, and provide financial or non-finan-cial incentives vary by outcome. Improving transparency by publishing the policies for licencing or intellectual property are often negatively correlated with outcomes, particularly for licence agree-ments. Out of three non-financial incentives, only social rewards have a rather positive effect (on start-ups), but financial incentives are positively correlated with several outcomes. A higher salary is positively linked to the number of research agreements and patent applications, while giving in-ventors a share of revenue is positively correlated with licencing and start-ups. The results suggest that the type of incentive as well as the degree of transparency of transfer policies should be chosen
to complement the main transfer channels and strategy of the institution.
Keywords: technology transfer; institutional policies; university by-laws.
1. Introduction
Since the early 1990s an increasing stream of publications has investigated the knowledge and technology transfer performance of universities and public research institu-tions and the effect of different policies on performance. Awareness among university administrators and policy makers about the importance of regulations governing knowledge transfer activities has also risen. Yet there is little evidence on the effectiveness of policies for specific outcomes.
This is of particular concern for Europe, where national laws and institutional regulations on the ownership and transfer of academic research results are still subject to
change (Geuna and Rossi 2011). To encourage good practice, in 2008 the European Commission (EC) issued recommendations for a Code of Practice (COP) containing 18 guidelines (referred to as principles in the document) for the management of intellectual property (IP) and know-ledge transfer activities by universities and public research institutes. The COP includes seven principles for IP, seven principles for knowledge transfer, and four principles for collaborative and contract research. The goal of the prin-ciples is to ‘better convert knowledge into socio-economic benefits’ through a more effective exploitation of publicly funded research results (European Commission 2008: 5). Several principles advance publishing IP and other policies
to improve transparency. The EC suggested that European Union (EU) member states adopt the COP principles in their national guidelines and regulations and encourage their universities and public research organizations to also adopt practices compatible with the COP. Compliance with principles 1 and 2 are required as part of the funding conditions for R&D under the new Framework Programme ‘Horizon 2020’ (European Commission 2013: 53–4). The mandatory principles cover the publication of IP policies and the provision of clear rules for staff and students regarding the disclosure of new ideas with potential commercial interest, the owner-ship of research results, record keeping, the management of conflicts of interest, and engagement with third parties. This article uses the results of two surveys conducted in 2011 and 2012 of European Knowledge Transfer Offices (KTOs) to examine the effect of several recommended principles on knowledge transfer outcomes. Responses were obtained from 247 leading research universities and 40 public research institutes located in 32 European countries. The results permit an evaluation of a greater range of policies than possible for single country studies. Most previous research is based on a single country, such as research using the US Association of University Technology Managers data set (see for instance Friedman and Silberman 2003; Lach and Schankerman 2004, 2008), Caldera and Debande’s (2010) study of Spanish universities and Okamuro and Nishimura’s (2013) Japanese study. One of the few exceptions using a multi-country data set is Conti and Gaule (2011), but this study does not include policy variables.
The analyses presented below address several gaps in the academic literature on the effects of university policies on the knowledge transfer performance of KTOs. First, we examine the effect of a broader range of policies than avail-able in other studies, with data on policies for IP, licencing, and start-up activities. Second, we distinguish between internal policies that affect mainly faculty and staff and published policies; publishing a policy and communicating its content to potential transfer clients potentially reduces the opportunities for negotiation of terms, with conse-quences for licencing agreements. Third, we include incen-tives for non-financial benefits. Currently, financial incentives dominate the literature. For brevity, the multi-variate analyses focus on four outcomes: two that are closer to research (the number of research agreements and patent applications) and two that are closer to the market (the number of licence agreements and start-ups established).
2. Research on knowledge transfer
performance
Previous studies have evaluated a range of factors that can affect knowledge transfer performance, including the
characteristics of the KTO, the characteristics of the affiliated institution, market characteristics, and of par-ticular interest to this study, policies that can affect know-ledge transfer outcomes.
2.1 Characteristics of the KTO
Several KTO features such as its age, size, and experience of its staff can influence knowledge transfer performance. Previous research has established that older KTOs with presumably more experienced staff perform better (Siegel, Waldman and Link 2003; Link and Siegel 2005; Conti and Gaule 2011; Curi, Daraio and Llerena 2012). In addition, the number of KTO employees has been found to increase performance (Rogers, Yin and Hoffmann 2000; Owen-Smith and Powell 2001; Thursby and Kemp 2002; Siegel, Waldman and Link 2003; Conti and Gaule 2011), with some exceptions. Chapple et al. (2005) found a negative relationship between KTO size and transfer efficiency in UK universities, and Van Looy et al. (2011) found no cor-relation between KTO size and patent applications and contract research. Using the Higher Education Funding Council for England HEFCE data set, Hewitt-Dundas (2012) argues that it is not the size of the KTO, but the alignment of organizational support and strategic priorities that influences success. A related factor is the characteristics of KTO staff, with low turnover (conducive to greater experience) and business and marketing expert-ise improving transfer success (Siegel et al., 2003; Conti and Gaule 2011).
Researchers have examined several organizational char-acteristics and strategies used by KTOs, including the autonomy of KTOs in respect to the institution that they serve (Siegel, Waldman and Link 2003; Markman, Gianiodis and Phan 2009; Conti and Gaule 2011), their organizational structure, and degree of centralization of services (Bercovitz et al., 2001; Debackere and Veugelers 2005; Schoen, van Pottelsberghe de la Potterie and Henkel 2014), and transfer strategies (Friedman and Silberman 2003; Litan, Mitchell and Reedy 2007; Belenzon and Schankerman 2009; Caldera and Debande 2010). Whereas organizational autonomy seems to improve outcomes, the effects of organizational structure and transfer strategies on performance are ambiguous. 2.2 Institutional characteristics
Several characteristics of universities or public research institutes can influence performance. These include owner-ship (public–private), size, the presence of science or medical faculties, research excellence, and business orien-tation (Schartinger, Schibany and Gassler 2001; Thursby, Jensen and Thursby 2001; Thursby and Kemp 2002; Sapsalis et al., 2006; Baldini 2009; Belenzon and Schankerman 2009; Caldera and Debande 2010; Van Looy et al., 2011; Curi, Daraio and Llerena 2012).
2.3 Institutional policies
Research on the effect of policies on performance outcomes is quite heterogeneous, looking at entire strategies or sets of institutional by-laws and practices, as well as at specific rules. Prominent topics in the literature are (1) incentives for faculty and staff, (2) IP policies, and (3) start-up strategies, support infrastructure, and rules. 1) Incentives for faculty and staff. Several studies have found a lack of financial incentives to be an important barrier for knowledge transfer (Siegel, Waldman and Link 2003; Siegel et al., 2004; Woolgar 2007), while the provision of financial incentives has a positive effect on transfer performance in many countries: the USA (e.g. Lach and Schankerman 2004, 2008; Link and Siegel 2005), Italy (Baldini 2010), Spain (Caldera and Debande 2010), or Japan (Woolgar 2007). Providing a share of revenues to the inventor’s department is positively related to licence income (Markman, Gianiodis and Phan 2009), unrelated to start-ups (Markman et al., 2004), and negatively related to licences executed (Friedman and Silberman 2003).
Other types of financial incentives, as well as non-finan-cial benefits which do not consist of direct and personal payments to the inventor, such as social rewards, add-itional R&D funds, or the inclusion of transfer successes in promotion and career decisions have not been examined.
2) IP policies. In some countries, IP ownership rules and other relevant regulations are determined nationally and can influence the performance of individual universities or public research institutes (Colyvas et al., 2002; Goldfarb and Henrekson 2003; Valentin and Jensen 2007; Conti and Gaule 2011; Geuna and Rossi 2011). University by-laws on IP can act as a stimulus to promote patenting (Baldini, Grimaldi and Sobrero 2006; Baldini 2010), whereas these by-laws have not been found to affect licencing agreements (Gonza´lez-Pernı´a et al., 2013). Wright et al. (2008) find that the use of identical patent policies across institutions can help to attract the R&D activities of larger companies. Conversely, Okamuro and Nishimura (2013), in a study of Japanese companies, find that university IP policies which flexibly meet firms’ needs have a positive effect on the number of patents and new products produced by univer-sity–industry collaborations.
Little research has been conducted on the effect of rules that complement knowledge transfer. A study of Spanish universities found that rules on conflicts of interest are correlated with a higher number of university–industry R&D contracts, income from such contracts, licences executed, income from licences, and the number of start-ups (Caldera and Debande 2010). Conversely, the same study finds that rules on R&D contracts that stipulate the participation of the institution in any benefits from commercialization reduce the number of contracts.
3) Start-up strategies, support infrastructure, and rules. The literature on institutional start-up policies covers a wide number of issues. The existence of a start-up programme, not surprisingly, correlates with a higher number of start-ups (Caldera and Debande 2010). Other research finds that different institutional start-up models generate different numbers and types of start-ups (Clarysse et al., 2005). The ‘low selective model’ creates internally an entrepre-neurial climate and reduces institutional barriers, but it offers little support and survival is left to market forces. The ‘supportive model’ gives extensive support to academic entrepreneurs in the pre–start-up phase, while in the ‘incubator model’ companies are spun off in a late stage after receiving support from the institution to prepare them for this step. Such spin-off policies have been found to affect the growth potential of ventures (Degroof and Roberts 2004; Clarysse et al., 2005).
A few studies examined the effect of supporting infra-structure and rules. The presence of an incubator did not raise the number of start-ups from American universities (Di Gregorio and Shane 2003), but it correlated positively with spin-offs in a Spanish study (Gonza´lez-Pernı´a, Kuechle and Pen˜a-Legazkue 2013). Rules on spin-off involvement that grant temporary leave to academics are positively correlated with the number of spin-offs (Caldera and Debande 2010). Lerner (2004) argues that too vigorous conflict-of-interest regulations can have a chilling effect on entrepreneurial activity. The possibility to take equity stakes can increase start-up rates (Di Gregorio and Shane 2003).
2.4 Main focus of this research
This article focuses on the effects of three sets of policies: financial and non-financial incentives to faculty and staff to become involved in knowledge transfer, codifying policies by developing written documents and streamlining IP management and transfer practice, and the influence of publishing policies and raising transparency.
Based on the literature review, we test five hypotheses: H1. Financial incentives have a positive effect on transfer outcomes.
H2. Non-financial incentives have a positive effect on transfer outcomes.
H3. Codified transfer policies for internal staff and faculty have a positive effect on transfer outcomes.
H4. Publishing transfer policies so that they are available to businesses has a positive effect on transfer outcomes which are close to research.
H5. Publishing transfer policies has a negative effect on transfer outcomes which are close to the market.
H1 is strongly suggested by previous research. H2 is open to discussion, but we would expect that non-financial incentives could also increase commitment to knowledge transfer. The latter could have a stronger impact on
transfer outcomes that are closer to research, as non-financial incentives are more closely related to the Mertonian norms of science (Merton 1996) than to com-mercialization. For other reasons we might get a similar result for H3: codifying policies will raise internal aware-ness of IP and transfer issues and ensure greater efficiency through the development of consistent practices. H4 follows from H3 by improving client expectations. With regard to H5, we point to Okamuro and Nishimura (2013): publishing policies might limit the flexibility in dealing with external clients.
3. Methodology
3.1 Data collection
Data were collected through two separate surveys in 2011 and 2012. Each survey referred to the preceding year (2010 and 2011). The European Knowledge Transfer Indicator Survey (EKTIS) collected data on the characteristics of KTOs (number of employees, age, etc), a few characteris-tics of the affiliated university or public research institute, who owns the IP for discoveries, and data on performance outcomes for 2010 and 2011.
The surveys focused on the leading research-intensive universities and research institutes in 39 countries including the 27 EU member states and 12 associate countries. The response rate for the EKTIS survey was 57.0% in 2011 and 55.9% in 2012. The second survey used a subsample of EKTIS respondents to collect infor-mation on institutional and national policies for know-ledge transfer and attained a response rate of 50.0% in 2011 and 39.8% in 2012. Full details on the survey meth-odology plus copies of the two questionnaires are provided by Arundel et al. (2013).
The two sets of survey data were then linked. The number of cases for analysis is increased by including all respondents for at least one of the two surveys. If a respondent replied to both surveys, the results for the most recent year (2011) are used. Since economic condi-tions, research funding, and knowledge transfer policies in Europe did not change notably between 2010 and 2011, any biases due to combining years should be minor. The linked data set includes 170 cases for which 2011 data are available and 118 cases for which only 2010 data are available.
3.2 Variables
There are four dependent variables for performance: the number of patent applications and three variables that measure the potential for transferring commercially valuable knowledge to private firms, the number of research agreements with firms, the number of licences, and the number of start-ups established. These perform-ance measures have been widely used in previous research.
Although a patent is not required for knowledge transfer, the number of patent applications is included in the out-put variables because of previous research showing a strong link for European universities between licencing and patented inventions (Arundel and Bordoy, 2009). Research agreements can be further from commercia-lization than licencing or start-ups, but they can also involve solving specific problems with existing products or processes and they have been neglected in previous work (with the exception of Caldera and Debande 2010; Van Looy et al., 2011).
The data are based on the awareness of KTO managers of the transfer of knowledge owned and commercialized by their office. As some organizations or countries permit the assignment of IP rights to inventors, this will underesti-mate the total knowledge transfer output of a university or research institute to the extent that some inventor-owned IP is commercialized through the assistance of organizations other than the responsible KTO (Lissoni et al., 2008). Consequently the results of this study only apply to institutional knowledge transfer via the KTO. In our database, 61.5% report that only the institution or ‘companies that fund research conducted by your insti-tution’ owns the IP, 9% report that only the inventor or ‘others’ own the IP, and 29.5% report that IP can be owned by the inventor, the institution, companies, or others. We use this information to control for the possibil-ity that inventors or others own the IP generated at the institution. The variable OWNERSHIP equals 1 if only the institution or funders own the IP and 0 if inventors/ others have the right to IP as well or exclusively. Company ownership is combined with institutional ownership because the KTO is highly likely to be aware of the research outputs of company-funded research, since KTOs normally draw up the governing legal agreements.
Although data are available for licence income, we do not provide regression results for this variable because of a lack of data over a sufficiently long period. The amount of income earned in 2010 or 2011 can depend on inventions that were made long before the survey reference year, when the values of the independent policy variables may have been very different from their values in 2010 or 2011.
The independent variables of interest include four types of COP policy variables.
The first policy variable consists of who owns the IP from a discovery made at the institution. The variable ‘IPR owned by the inventor’ equals 1 when the inventor owns the IP and 0 otherwise.
The second type of policy variable concerns the avail-ability of written rules to prevent potential conflicts. The variable ‘Rules on IP ownership’ equals 1 when the insti-tution has rules for who owns the IP and 0 otherwise. The second variable, ‘Rules for conflicts of interest’ equals 1 when there are rules to manage conflicts of interest and 0 otherwise.
The third type of policy variable concerns the availabil-ity of written and published rules on IP, licencing policy, and start-up policies. The variables for a ‘Written policy’ equal 1 when the institution has a written document for the relevant policy, but it is only available to staff of the institution. The variables for a ‘Published policy’ equal 1 when there is a written policy that is available both to internal staff and externally to the public. The reference category of 0 occurs when no written policy is available. Separate written and published policy variables are provided for IP, licence, and start-up policies.
The final type of policy variable is for incentives for the protection of IP or its exploitation. Four variables cover direct financial benefits to the inventor: ‘Percent of revenues’, ‘Lump-sum payment’, and ‘Higher salary’ (for each 1 if the inventor receives the incentive and 0 otherwise). In addition, the ‘Inventor share’ is the percent-age of revenue from licencing given to the inventor. Three variables cover non-financial benefits to the inventor: ‘Promotion decisions’, referring to taking success in pro-tecting or exploiting IP in promotion and career decisions into account; ‘Social rewards’ in case of awards or publi-city; ‘Funding for research’, if additional funds for the inventors’ R&D are provided. Finally, one variable covers a financial benefit to the inventor’s department: ‘Departmental share’ is the percentage of revenue that is given to the department, institute, or other unit with which the inventor is affiliated.
In addition to IP ownership (see above) we include further control variables which cover the key influences on transfer performance as assessed in the literature. Two KTO variables include the number of employees and KTO age (equal to 1 if the KTO was established before January 2000 and 0 otherwise). The three institu-tional variables include the number of researchers (research output is expected to be closely correlated with this variable), if the institution has a hospital (1 when present and 0 otherwise), and the type of institution (1 when a university and 0 if a public research institute). The variable for the presence of a hospital is included to capture activity in health sciences while the type of insti-tution is an important factor in the use of licencing and start-ups. The full data set shows that the former is more
common in public research institutes and the latter is more common in universities. We do not include a control variable for university ownership status (private or public), as almost all universities in our sample are publicly owned.
3.3 Analytical methods
All independent variables are measured as counts. We tested for overdispersion, i.e. whether the conditional variance equals the conditional mean of the dependent variable, as described in Cameron and Trivedi (1998) and found significant overdispersion for all four dependent variables. This rules out the use of a Poisson model and consequently we chose the Negative Binomial model instead.
As there are large numbers of zero responses for pa-tent applications, licence agreements, and start-ups (see Table 1), we also estimated zero-inflated negative binomial models (ZINB) as part of the sensitivity analysis. The ZINB model assumes that the zero outcomes are due to two different processes (Long and Jeremy 2006). For instance, in our data, the two processes could be that (1) an institution has not participated in one type of formal knowledge transfer activities (and consequently reports 0 output) or (2) that it participated but without success. The two parts of the a zero-inflated model are a binary model, in this case a logit model to model which of the two processes the zero outcome is associated with, and a (negative binomial) count model to model the count process. To differentiate between the two processes an inflation variable is needed which we lack in our cross-sectional data set. We approximated it with invention disclosures (for patent applications) and patent applications (for licence agreements and start-ups) of the same year. The results of the ZINB models do not differ in any meaningful way from the Negative Binomial results provided below, indicating that these results are reason-ably robust.
Due to the cross-sectional nature of the data it is not possible to unambiguously identify cause and effect, for example, whether policies drive performance or whether institutions alter their policies as a result of performance
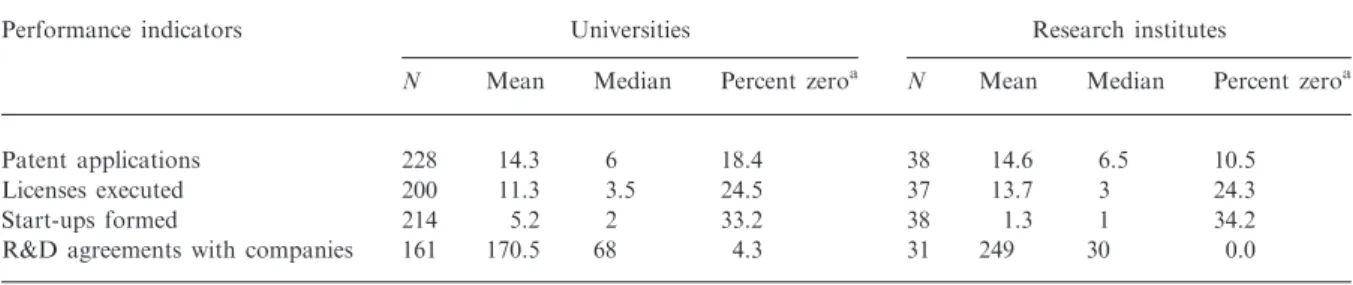
Table 1. Key performance indicators for universities and public research institutes
Performance indicators Universities Research institutes
N Mean Median Percent zeroa N Mean Median Percent zeroa
Patent applications 228 14.3 6 18.4 38 14.6 6.5 10.5
Licenses executed 200 11.3 3.5 24.5 37 13.7 3 24.3
Start-ups formed 214 5.2 2 33.2 38 1.3 1 34.2
R&D agreements with companies 161 170.5 68 4.3 31 249 30 0.0
Source:MERIT, European Knowledge Transfer Indicator Survey 2011 and 2012. a
outcomes. However, the latter is more likely to occur in response to poor performance, which would reduce the ability to identify policies with a positive effect on outcomes.
The regressions were first conducted using a dummy variable for the survey year (2011 versus 2010). The variable had no effect on any of the results except for the number of licences, indicating that licence activity declined in 2011. However, the variable for year had no effect on any of the policy variables and is consequently not included in the final regressions given below.
As we included up to 18 variables in the estimations, we also checked for multicollinearity and calculated the variance inflation factors and condition numbers. These tests indicated that multicollinearity is not a problem for our estimations.
In order to identify the effects of the key variables of interest on our dependent variables, we entered them stepwise into the models. For each dependent variable, the model 1 regressions are limited to the control variables with subsequent models including additional variables. Model 2 adds the policy codification variables, model 3 the transparency rules, models 4 and 5 financial incentives, and model 6 non-financial incentives for the inventor. For the regressions for the number of start-ups, the control variable for KTO age is not included (with one exception) because it was never statistically significant and excluding this variable increased the sample by 18 cases that had not provided this information. Each table includes the Akaike Information Criterion (AIC) value, a goodness-of-fit measure in which smaller values are preferable.
4. Descriptive results
On average, the universities in our sample reported 14.3 patent applications, 11.3 executed licences, 5.2 start-ups, and 170.5 research agreements (see Table 1). The per-formance of research institutes is comparable, except for a
lower average for start-ups and a higher average for research agreements. A large percentage of institutions report zero values for each outcome, particularly for the number of start-ups, with 33.2% of universities reporting no start-ups in the reference year. The median values are considerably lower than the arithmetic means for most indicators, indicating a few institutions with high values, particularly for research agreements.
Tables 2–4 provide the number and percentage of universities and other research institutes that reported specific types of policies. Table 2 provides results for policies to make university knowledge transfer activities clear and transparent to staff or firms. The most common policy consists of rules on who owns the IP, reported by 86.1% of universities. Of interest, far fewer universities and research institutes make their policies publicly available. For example, 69.4% of universities have a written IP policy available for internal staff, compared to only 29.3% who made this policy publicly available. The lowest level of codification is for licencing policies, with only 26.9% of universities providing a written licence policy and only 7.2% making their licence
Table 2. Codification and transparency of knowledge transfer policies of the affiliated institution
Policy variables Universities Research institutes
N Yes Percent N Yes Percent
IP policy includes rules on IP ownership 245 211 86.1 40 36 90.0
IP policy includes rules for conflict management 245 123 50.2 40 20 50.0
Institution has a written IP policy 232 161 69.4 38 22 57.9
Institution has published the IP policy 232 68 29.3 38 4 10.5
Institution has a written licence policy 223 60 26.9 36 9 25.0
Institution has published the licence policy 223 16 7.2 36 1 2.8
Institution has a written start-up policy 228 89 39.0 37 22 59.5
Institution has published the start-up policy 228 39 17.1 37 4 10.8
Source:FHNW, European Knowledge Transfer Practice Surveys 2011 and 2012. Written policies are only available for internal staff, while published policies are publicly available.
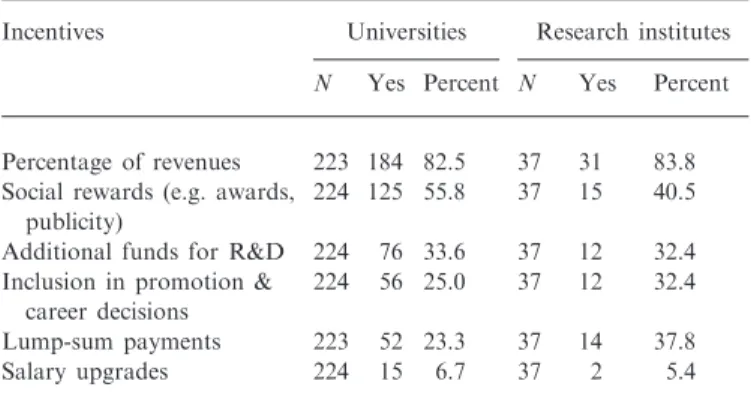
Table 3. Provision of incentives for researchers and students to protect and exploit IP
Incentives Universities Research institutes N Yes Percent N Yes Percent
Percentage of revenues 223 184 82.5 37 31 83.8 Social rewards (e.g. awards,
publicity)
224 125 55.8 37 15 40.5 Additional funds for R&D 224 76 33.6 37 12 32.4 Inclusion in promotion &
career decisions
224 56 25.0 37 12 32.4
Lump-sum payments 223 52 23.3 37 14 37.8
Salary upgrades 224 15 6.7 37 2 5.4
policy publicly available. Start-up policies are written down in almost 4 out of 10 institutions, but only published by 17.1%.
Table 3 provides the percentage of universities and research institutes that provide incentives for researchers and students to protect and exploit IP, while Table 4 gives the average distribution of licence revenues. As shown in Table 3, the most common incentive, reported by 82.5% of universities, is to provide researchers with a percentage of the revenues. Salary upgrades are reported by only 6.7% of universities.
Table 4 provides the average distribution of knowledge transfer revenues by the type of recipient. On average, the inventor and other researchers at universities obtain 42.8% of the revenues, with the KTO receiving slightly below 7%.
5. Regression results
5.1 Research agreements
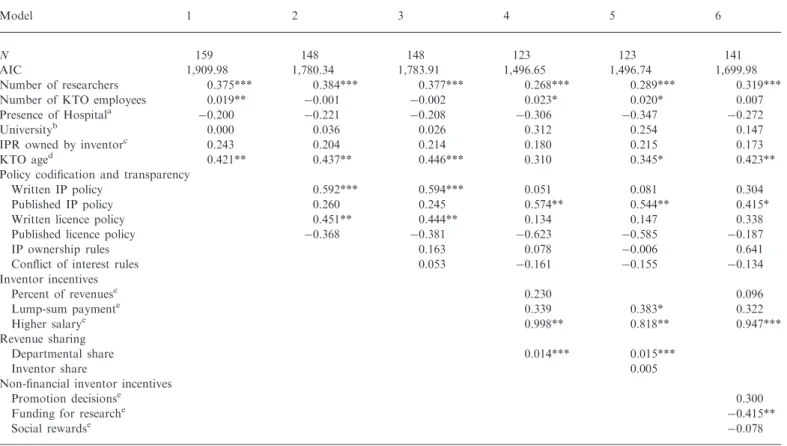
Table 5 gives regression results for the number of research agreements. The variation in the number of cases is due to missing responses, which is greatest for the interval level variables for revenue sharing. The control variables show strong positive effects for the number of researchers and founding date of the KTO, a small effect for KTO size, no effects for the presence of a hospital, ownership by the inventor, and type of institution (university or research institute).
Several methods to increase the transparency of IP and licencing policies have no effect, including rules for IP ownership and conflicts of interest and a published licence policy. A written IP policy and a written licencing policy have positive effects; however, they are no longer significant once the incentive variables are added in the re-gressions. Conversely, publishing the IP policy is positive and weakly significant only when incentives are included (models 4–6).
The only incentive that always increases the number of research agreements is to provide a higher salary to inventors that protect or exploit IP. A higher departmental share of revenues also improves performance, but the inventor share has no effect. Of note, these incentives refer to licence income. Only a minority of research agree-ments are likely to lead to licence income in the future, which may explain why the security of higher staff salaries is the most effective incentive for inventors. Of the non-financial incentives, funding for the inventor’s research is negative—possibly because it reduces the need to enter into research agreements (model 6).
5.2 Number of patent applications
Table 6 gives results for the number of patent applications. The number of researchers has a consistent positive effect. The number of KTO employees is also positive and signifi-cant (except in model 3). When the IP is owned by the inventor the coefficient is positive but only significant when we include variables on incentives as well. The founding date is positive, indicating more applications by older KTOs, but only significant in two models. The exist-ence of a hospital and the type of institution are insignificant.
Policy codification and transparency tends to increase the number of patent applications. The variable for a written IP policy is positive and statistically significant in models 2 and 3. Publishing the IP policy is positive and statistically significant in models 4 and 5. Rules for IP ownership and conflicts of interest are consistently positive, but rarely significant.
Similar to the results for research agreements, a higher salary to inventors consistently increases the number of patent applications. A lump-sum payment for inventors is significant in models 4 and 5. Giving the inventor a share of the revenues is positive in model 6, but the actual size of the inventor share (measured as continuous variable) has no effect (see model 5). There are no signifi-cant results for the departmental share of licence income and all non-financial incentives.
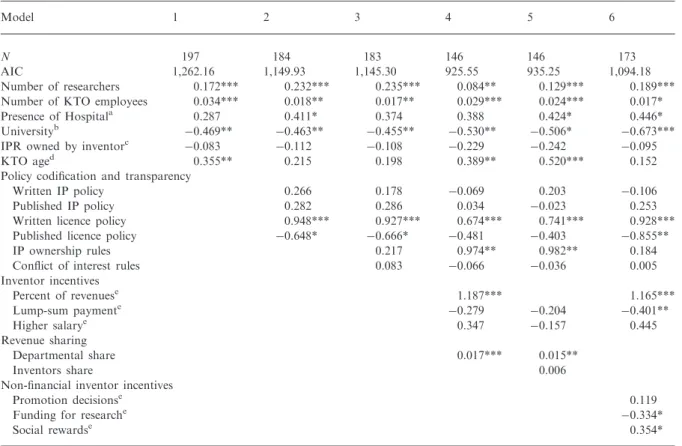
5.3 Number of licences
Table 7 gives results for the number of licences. The vari-ables for the number of researchers and the size of the KTO are positive and statistically significant. Universities have significantly fewer licences than the reference category of research institutes. The ownership of IP has no significant effect, but the age of the KTO and the presence of a hospital have significant and positive effects in several models.
The variable for IP ownership rules is positive and sig-nificant in models 4 and 5 which also include variables for financial incentives. A written or published IP policy has no effect in any of the models, but a written licence policy
Table 4. Average shares of revenues from IP by recipient
Recipients of revenue from IP
Universities Research institutes
N Percent N Percent
Inventors or researchers from the institution
184 42.8 36 26.3
Institution 184 28.5 36 48.1
Department, institute, or other institutional subunits
184 19.0 36 21.5
KTO or other intermediariesa 157 6.8 33 3.6
Other beneficiaries 184 2.9 36 0.5
Total 100.0 100.0
Source:FHNW, European Knowledge Transfer Practice Surveys 2011 and 2012. a
has strong positive effects in all models. Of interest, making the licence policy publicly available has a negative effect in several estimations, particularly in model 6, which includes non-financial incentives. The greater importance of an internally transparent versus an externally transparent licencing policy could reflect the need for flexibility in negotiations with firms. A published licence policy could indicate less flexibility in licencing negotiations, leading to fewer licence contracts. Semi-structured interviews with companies and transfer offices suggest that companies back off if universities’ ideas in licence contract negotiations are incompatible with their own views (Arundel et al., 2013).
In contrast to the results for the number of research agreements and patent applications, a higher inventor salary has no effect on the number of licences while a lump-sum payment has a significant negative effect, but only in model 6 when non-monetary incentives are included. The existence of a rule that reserves a percentage of the revenues for the inventor is strongly positive, but the actual size of the inventor share (measured as a continuous variable) has no effect (see model 5). Conversely, the
departmental share is positive and statistically significant. For the non-financial incentives we only find a weak negative effect for giving more research funds to the inventors as a premium for being involved in transfers (model 6).
5.4 Number of start-ups established
Table 8 gives the results for the number of start-ups estab-lished in the previous year. The variables for the number of researchers and KTO employees are positive and signifi-cant. The variable for university is positive, indicating that universities produce more start-ups than research institutes (5.2 compared to 1.3, see Table 1 above). When the IP is owned by the inventor, the coefficient is consistently negative and significant in several models. This could suggest that owning inventors are less interested in estab-lishing start-ups, perhaps preferring to licence inventions. Though there is no effect for this variable on the number of licences in Table 7, this explanation is still possible, as Table 7 covers licence agreements of the institution, whereas we would have to look at licence contracts of
Table 5. Number of research agreements
Model 1 2 3 4 5 6
N 159 148 148 123 123 141
AIC 1,909.98 1,780.34 1,783.91 1,496.65 1,496.74 1,699.98
Number of researchers 0.375*** 0.384*** 0.377*** 0.268*** 0.289*** 0.319***
Number of KTO employees 0.019** 0.001 0.002 0.023* 0.020* 0.007
Presence of Hospitala 0.200 0.221 0.208 0.306 0.347 0.272
Universityb 0.000 0.036 0.026 0.312 0.254 0.147
IPR owned by inventorc 0.243 0.204 0.214 0.180 0.215 0.173
KTO aged 0.421** 0.437** 0.446*** 0.310 0.345* 0.423**
Policy codification and transparency
Written IP policy 0.592*** 0.594*** 0.051 0.081 0.304
Published IP policy 0.260 0.245 0.574** 0.544** 0.415*
Written licence policy 0.451** 0.444** 0.134 0.147 0.338
Published licence policy 0.368 0.381 0.623 0.585 0.187
IP ownership rules 0.163 0.078 0.006 0.641
Conflict of interest rules 0.053 0.161 0.155 0.134
Inventor incentives Percent of revenuese 0.230 0.096 Lump-sum paymente 0.339 0.383* 0.322 Higher salarye 0.998** 0.818** 0.947*** Revenue sharing Departmental share 0.014*** 0.015*** Inventor share 0.005
Non-financial inventor incentives
Promotion decisionse 0.300
Funding for researche 0.415**
Social rewardse 0.078
*P < 0.10, **P < 0.05, ***P < 0.01. a
Reference category is no hospital. b
Reference category is a research institute. c
Reference category is IP owned by the institute or by firms. d
Reference category is establishment after 2000. e
inventors (not available) to properly evaluate the argument. However, another explanation could be that our survey respondents (the KTOs) are not fully aware of all start-ups, particularly if inventors own the IP and establish start-ups outside the purview of the KTO.
With the exception of IP ownership rules, policy codifi-cation and transparency reduces the number of start-ups. The variable for a published IP policy is consistently negative and statistically significant. Neither a written nor published start-up policy has any effect. Rules for conflicts of interest are consistently negative, suggesting that these dampen the interest of university staff in participating in start-ups.
A higher salary has strong negative effects in models 4 and 5, possibly because an increase in salary reduces inventor interest in supporting a start-up. Giving the inventors a share of the revenue raises the number of start-ups as well (model 6) and the size of this share also seems to matter (model 5). The departmental share is not significantly correlated with the number of start-ups. Similar to the results for licence agreements, social rewards to the inventors have a statistically significant and positive effect on the number of start-ups. The social award effect could be due to the prestige of establishing
a company. However, funding for the inventor’s research has a negative effect, suggesting that it reduces the incentives for inventors to establish a start-up or provide support for an independent start-up that uses the in-ventor’s IP.
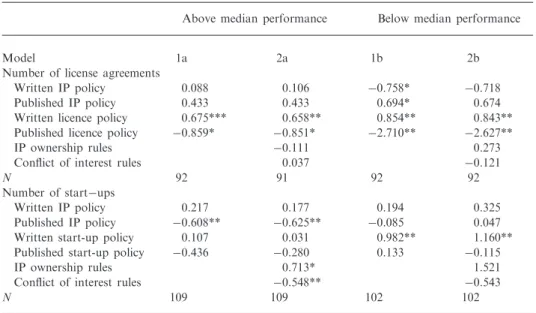
5.5 Does policy drive performance or vice versa? For both licences and start-ups, publishing the licence and start-up policies either reduces the number of outcomes (as for licences) or has no effect (for start-up policies). A possible explanation for these results is that poorly per-forming KTOs try to improve their performance by imple-menting publication policies, perhaps as part of marketing transfer opportunities. This hypothesis is difficult to test with the available cross-sectional data. One option is to conduct separate regressions for KTOs that perform below and above the median in terms of the number of licences or start-ups per 1,000 researchers. If publishing a policy reduces outcomes for both groups, then it is unlikely that the cause is due to a change in policy by poor performers to improve their performance. However, if publishing a policy has a negative statistical effect in the poor performing group and a positive effect in the high
Table 6. Number of patent applications
Model 1 2 3 4 5 6
N 213 203 202 158 158 191
AIC 1,494.15 1,419.63 1,409.69 1,101.42 1,101.53 1,345.64
Number of researchers 0.255*** 0.277*** 0.291*** 0.163*** 0.170** 0.245***
Number of KTO employees 0.023*** 0.017** 0.013 0.024*** 0.023** 0.014*
Presence of Hospitala 0.045 0.010 0.084 0.278 0.317 0.123
Universityb 0.031 0.065 0.057 0.133 0.074 0.088
IPR Owned by inventorc 0.238 0.243 0.259 0.326* 0.350* 0.306*
KTO aged 0.245 0.270* 0.224 0.299 0.377** 0.233
Policy codification and transparency
Written IP policy 0.581*** 0.451** 0.176 0.234 0.166
Published IP policy 0.086 0.090 0.424** 0.397* 0.276
IP ownership rules 0.244 0.303 0.356 0.173
Conflict of interest rules 0.333** 0.266 0.266 0.231
Inventor incentives Percent of revenuese 0.255 0.500** Lump-sum paymente 0.429** 0.479** 0.244 Higher salarye 1.346*** 1.189*** 0.737** Revenue sharing Departmental share 0.002 0.001 Inventor share 0.005
Non-financial inventor incentives
Promotion decisionse 0.101
Funding for researche 0.096
Social rewardse 0.184
*P < 0.10, **P < 0.05, ***P < 0.01. a
Reference category is no hospital. b
Reference category is a research institute. c
Reference category is IP owned by the institute or by firms. d
Reference category is establishment after 2000. e
performing group, then the poor performers could be implementing publication policies to improve their performance.
Table 9 provides summary results for a test of this hypothesis (the estimations include the control variables, but for simplicity they are excluded from Table 9). The results in the first half of Table 9 show that publishing the licence policy has a significant negative effect on the number of licences for both the poor and good performing groups, while the coefficients for publishing the IP policy are consistently positive, but only statistically significant for the below median group. The second half of Table 9 gives the results for KTOs that perform below and above the median for start-ups. The results show that pub-lishing the IP policy is significantly negative for the group above the median but not for the group below the median. Publishing the start-up policy is not statistically significant in both groups, but the effect is negative in all but one model. These results do not suggest that poor performing KTOs publish their policies to improve their performance.
6. Discussion and conclusions
This article uses survey data to examine the correlation between policies that are expected to support knowledge transfer and four knowledge transfer outcomes for leading European universities and public research institutes. The four outcomes are the number of patent applications, research agreements, licences, and start-ups established in the year preceding the survey. The patent application outcome is the furthest from the market, but is a key goal for many universities and research institutes because of the positive link between patenting activity and licence income. Research agreements can produce discoveries that can be quickly commercialized, or they may produce results that will take a long time, if ever, to be commer-cially valuable. In contrast, licences and start-ups are much closer to the market. Firms will not licence a discovery without an expectation of future commercial opportunities, and private investors will similarly expect a future return from ups, even though many start-ups will fail.
Table 7. Number of licenses
Model 1 2 3 4 5 6
N 197 184 183 146 146 173
AIC 1,262.16 1,149.93 1,145.30 925.55 935.25 1,094.18
Number of researchers 0.172*** 0.232*** 0.235*** 0.084** 0.129*** 0.189***
Number of KTO employees 0.034*** 0.018** 0.017** 0.029*** 0.024*** 0.017*
Presence of Hospitala 0.287 0.411* 0.374 0.388 0.424* 0.446*
Universityb 0.469** 0.463** 0.455** 0.530** 0.506* 0.673***
IPR owned by inventorc 0.083 0.112 0.108 0.229 0.242 0.095
KTO aged 0.355** 0.215 0.198 0.389** 0.520*** 0.152
Policy codification and transparency
Written IP policy 0.266 0.178 0.069 0.203 0.106
Published IP policy 0.282 0.286 0.034 0.023 0.253
Written licence policy 0.948*** 0.927*** 0.674*** 0.741*** 0.928***
Published licence policy 0.648* 0.666* 0.481 0.403 0.855**
IP ownership rules 0.217 0.974** 0.982** 0.184
Conflict of interest rules 0.083 0.066 0.036 0.005
Inventor incentives Percent of revenuese 1.187*** 1.165*** Lump-sum paymente 0.279 0.204 0.401** Higher salarye 0.347 0.157 0.445 Revenue sharing Departmental share 0.017*** 0.015** Inventors share 0.006
Non-financial inventor incentives
Promotion decisionse 0.119
Funding for researche 0.334*
Social rewardse 0.354*
*P < 0.10, **P < 0.05, ***P < 0.01. a
Reference category is no hospital. b
Reference category is a research institute. c
Reference category is IP owned by the institute or by firms. d
Reference category is establishment after 2000. e
Table 8. Number of start-ups established
Model 1 2 3 4 5 6
N 207 211 211 161 161 198
AIC 918.22 1,062.93 1,057.40 813.11 801.37 993.91
Number of researchers 0.173*** 0.158*** 0.176*** 0.146*** 0.202*** 0.190***
Number of KTO employees 0.011 0.025*** 0.026*** 0.030*** 0.019* 0.027***
Presence of hospitala 0.394* 0.540** 0.644*** 0.596** 0.474* 0.724**
Universityb 1.102*** 1.493*** 1.474*** 1.287*** 1.040*** 1.450***
IPR owned by inventorc 0.291 0.310* 0.302* 0.350* 0.211 0.157
KTO aged 0.094
Policy codification and transparency
Written IP policy 0.112 0.058 0.165 0.503* 0.348
Published IP policy 0.605*** 0.604*** 0.593** 0.816*** 0.426*
Written start-up policy 0.202 0.168 0.090 0.030 0.073
Published start-up policy 0.181 0.121 0.067 0.090 0.072
IP ownership rules 0.752** 0.956** 1.038** 0.694*
Rules for conflict of interest 0.414** 0.385** 0.204 0.559***
Inventor incentives Percent of revenuese 0.198 0.895*** Lump-sum paymente 0.085 0.210 0.033 Higher salarye 0.745* 1.103** 0.196 Revenue sharing Departmental share 0.005 0.003 Inventors share 0.023*** Non-financial incentives Promotion decisionse 0.093
Funding for researche 0.510***
Social rewardse 0.763***
*P < 0.10, **P < 0.05, ***P < 0.01. a
Reference category is no hospital. b
Reference category is a research institute. c
Reference category is IP owned by the institute or by firms. d
Reference category is establishment after 2000. e
Binary variables where 1 = use of incentive.
Table 9. Number of licenses and start-ups by group performance
Above median performance Below median performance
Model 1a 2a 1b 2b
Number of license agreements
Written IP policy 0.088 0.106 0.758* 0.718
Published IP policy 0.433 0.433 0.694* 0.674
Written licence policy 0.675*** 0.658** 0.854** 0.843**
Published licence policy 0.859* 0.851* 2.710** 2.627**
IP ownership rules 0.111 0.273
Conflict of interest rules 0.037 0.121
N 92 91 92 92
Number of start ups
Written IP policy 0.217 0.177 0.194 0.325
Published IP policy 0.608** 0.625** 0.085 0.047
Written start-up policy 0.107 0.031 0.982** 1.160**
Published start-up policy 0.436 0.280 0.133 0.115
IP ownership rules 0.713* 1.521
Conflict of interest rules 0.548** 0.543
N 109 109 102 102
*P < 0.10, **P < 0.05, ***P < 0.01.
The median is 2.5 per 1,000 researchers for license agreements and 0.96 per 1,000 researchers for start-ups. The drop in cases is due to unreported values for the independent variables.
6.1 Codifying and publishing IP and transfer policies The European Commission’s (2008) principles for know-ledge transfer policies stress the value of specific policies, examined in this study, for supporting knowledge transfer outcomes that lead to commercialization. These include clear IP ownership and conflict of interest rules to minimize disputes, the codification and publication of policies for IP, licencing and start-ups, and incentives that encourage inventors to protect IP and support its exploitation by firms. After controlling for several charac-teristics of the KTO and the number of researchers in the university or research institute, we find that none of these policies have a consistently positive correlation with all four outcomes. A few policies tend to show more negative than positive effects, while the benefits of other policies vary by the type of outcome. The fact that we are unable to detect generalizable (across all outcomes) and positive effects suggests that (1) more research is needed on institutional policies and their effects and (2) that the COP should be implemented carefully until we have better understanding of how policies affect performance.
Clear rules on IP ownership have positive benefits for the two outcomes that are closest to commercialization, possibly because they make it easier to determine who is to receive a share of future revenue from licencing or start-ups. In contrast, conflict of interest rules have no effect on licencing but a strong negative effect on the number of start-ups (as suggested by Lerner 2004). We do not know the reasons behind this, but possibly such rules dis-courage engagement in start-ups or are a proxy for an unfavourable institutional environment for academic entrepreneurship. This result conflicts with Caldera and Debande (2010), who find that rules for conflicts of interest have a positive effect on both the number of licences and the number of start-ups. The difference in results could be due to the smaller sample size in the Caldera and Debande study, which limited the analyses to one policy variable per regression, whereas our analyses simultaneously control for the effects of multiple policies.
The goal of providing codified, written policies on IP, licencing and start-ups to the staff of university or research institutes is to ensure that all staff understands the potential benefits of commercialization and to contribute to consistent management of different projects. Yet the effects of written policies are inconsistent, such that hy-pothesis H3 is only partly confirmed. Written IP policies only have a positive effect for early stage outcomes (research agreements and patent applications), but this effect is lost once policies for incentives are included in the models. Inventors that respond to incentives may not need a written IP policy, but the implication is that the policy has little effect on researchers that have not yet participated in protecting or exploiting their IP. A written start-up policy has no effect on the number of start-ups.
The only consistent and positive written policy is for licencing, which generally has a positive effect on the number of research agreements and a large and positive effect on the number of licences.
The next step is to publish policies to make them avail-able to potential transfer clients. The results show that publishing the IP policy has a positive effect on the number of research agreements and patent applications once incentives are also included in the model, but has no effect on the number of licences and tends to have a negative effect on the number of start-ups. In respect to publishing the licence policy, there is no effect for research agreements, but a strong negative effect for licences, while a published start-up policy has no effect on the number of start-ups. These results confirm H5 and partially H4 and point to a complex relationship between policy content, transparency, and transfer success. A possible explanation for the negative effects of published policies is that they reduce room for negotiations between universities or research institutes and private firms, or at worst scare away potential private sector investors. This supports Okamuro and Nishimura’s (2013) findings that companies appreciate flexible IP policies, at least to some extent. The alternative explanation that poorly performing KTOs introduce publication policies in order to improve their performance is unlikely, given the results of Table 9 that show that publication policies do not improve the per-formance of institutions with above average perper-formance for licencing and start-ups.
In sum, these results suggest that universities and research institutes should carefully consider what rules their transfer policies include and what they publish, as the effects will vary between transfer performance measures. For instance, an institution that aims to raise its licence agreements should ensure that it is clear who owns the IP of R&D conducted at the institution and lay down the rules for licencing in writing; but it should keep some flexibility with regard to negotiating licence contracts with outside parties. An institution that focuses on entre-preneurship and aims to create more start-ups should also clarify IP ownership, but at the same time avoid crushing entrepreneurial initiative by too much bureau-cracy, i.e. regulations, restrictions, and requirements which complicate the start-up process and demand time and resources which early entrepreneurs may lack. 6.2 Providing financial and non-financial incentives to faculty and staff
The European Commission’s (2008) guidelines stress the provision of incentives, including non-monetary incentives such as considering transfer activities in promotion decisions.
The results for non-financial incentives vary by outcome measure. Using the IP and exploitation achievements of staff in promotion decisions has no effect on any of the
outcomes. Rewarding transfer commitment and success with additional funding for the inventor’s research has negative effects on research agreements, licence agree-ments, and start-ups. Such funding is seemingly not suitable to keep alive scholars’ commitment to technology transfer and their interest in cooperation with the private sector. The provision of social rewards has a positive effect on the number of licence agreements and a strong positive effect on the number of start-ups, possibly because of the prestige involved with participating in or setting up a business. In general, hypothesis H2 is rejected, except for social rewards with regard to licences and start-ups which are therefore the only non-financial incentive supported by the results of this study as improving transfer performance. The impact of a research premium for transfer contribu-tions is even negative. The relevant recommendation of the COP to support these types of rewards and in particular include IP and knowledge transfer aspects in appraisal procedures does not seem to be justified.
Financial incentives have disparate effects depending on the outcomes.
First, a higher salary has a significant positive effect on the number of research agreements and patent applica-tions, no effect on the number of licences, and some indication of a negative effect on the number of start-ups. This result could be linked to a preference among researchers to continue working within a university or research institute environment if there is adequate financial compensation.
Conversely, earning a share of revenues has a positive effect on the number of licences and on the number of start-ups. In contrast to Link and Siegel’s (2005) results for the USA, using the actual share instead of a binary variable for an undefined share in the regressions, is not significant for licencing, although it is positive and signifi-cant for start-ups. This could be because the actual income earned from a licence is not correlated with the share, since the income will depend on the size of the potential market for the invention. In this case, the existence of a revenue-sharing agreement could be positive, while the actual share could have no effect.
Third, the negative effect of a lump-sum payment for licence agreements also suggests a strong preference for revenue-sharing agreements. We also find that lump-sum payments interact with non-monetary incentives for three out of four outcome measures. Lump-sum payments raise the number of R&D agreements and patent applications when non-monetary incentives are excluded and they do not significantly affect licence agreements. When non-monetary incentives are included, there is no effect with regard to R&D agreements and patent applications, but a negative and highly significant effect on licence agree-ments. This indicates that lump-sum payments, like higher salaries, are only effective for raising engagement in research and IP protection, but do not raise commit-ment to their subsequent commercialization. In addition,
even though it is a monetary incentive, it seems to have above all a symbolic value that is less effective if non-financial incentives are also in place.
The results tend to confirm hypothesis H1. A focus on monetary rewards might be adequate, with benefits in terms of higher salaries more effective when there is no immediate prospect of licence income and a revenue-sharing agreement more effective for licencing and start-ups.
Of interest, the departmental share of licence income correlates positively with the number of research agree-ments and licences but not the other outcome measures. The departmental share is the only incentive included in this analysis that does not focus on benefits to the individ-ual, but to a collective. The result could suggest that stressing collective benefits of involvement in knowledge transfer strengthens transfer channels that require collect-ive transfer commitment (like R&D or licence contracts) but is not effective for channels requiring (mainly) individ-ual involvement (such as setting up a start-up company). 6.3 Limitations
Our results show that institutional by-laws and practices can affect transfer performance. However, in order to pin down cause and effect conclusively, longitudinal data are required that can track the effect of a change in policy over time; qualitative data from different stakeholders of know-ledge and technology transfer on how and why policies and incentives have an impact would contribute to drawing the right conclusions. European professional knowledge transfer organizations would be in a good position to collect such data over time from a panel of academic organizations in Europe. Professional knowledge transfer associations should also ensure that academic organizations know about good practices in IP manage-ment and transfer and that they are aware of the effects that different rules and practices will have on different steps of the transfer process.
In addition to the limitations due to the cross-sectional nature of the data, another limitation of this study is that it does not cover the full range of knowledge transfer activities between universities or public research institutes and private firms. Informal channels such as personal com-munications between scientists and engineers, gleaning knowledge from academic publications, or the participa-tion of people from industry in academic events are not covered as this would require surveying university re-searchers or companies. This leads to a bias in our results against research areas where knowledge transfer occurs without the use of formal channels such as patent-ing, licencpatent-ing, or start-ups. Research areas that are likely to be under represented include the social sciences, humanities, and some fields within natural sciences and engineering, such as mathematics, which makes little use of formal IP mechanisms such as patents. In addition,
asking faculty about their transfer performance and assess-ment of institutional transfer regulations would have the benefit of learning directly about the impact of such regulations. However, the sampling for such a survey is certainly demanding, as we would expect a self-selection bias and limited knowledge of the regulatory details from faculty not involved in the transfer business.
Funding
This work was supported by the European Commission, Directorate General for Research & Innovation, under contract RTD/DirC/C2/2010/SI2.569045.
Conflict of interest statement. None declared.
References
Arundel, A. and Bordoy, C. (2009), ‘Final results for the ASTP survey for Fiscal Year 2008, UNU-MERIT report to the ASTP’. Maastricht: UNU-MERIT.
Arundel, A. et al. (2013), ‘Knowledge Transfer Study 2010 – 2012. Final Report’. Brussels: European Commission, DG Research & Innovation. <http://ec.europa.eu/research/ innovation-union/pdf/knowledge_transfer_2010-2012_report. pdf> accessed 28 Aug 2014.
Baldini, N. (2009) ‘Implementing Bayh-Dole-like Laws: Faculty Problems and their Impact on University Patenting Activity’, Research Policy, 38/8: 1217–24.
——. (2010) ‘Do Royalties Really Foster University Patenting Activity? An Answer from Italy’, Technovation, 30/2: 109–16. Baldini, N., Grimaldi, R. and Sobrero, M. (2006) ‘Institutional Changes and the Commercialization of Academic Knowledge: A Study of Italian Universities’ Patenting Activities Between 1965 and 2002’, Research Policy, 35/4: 518–32.
Belenzon, S. and Schankerman, M. (2009) ‘University Knowledge Transfer: Private Ownership, Incentives, and Local Development Objectives’, Journal of Law & Economics, 52: 111–44.
Bercovitz, J. et al. (2001) ‘Organizational Structure as a Determinant of Academic Patent and Licensing Behavior: An Exploratory Study of Duke, Johns Hopkins, and Pennsylvania State Universities’, The Journal of Technology Transfer, 26/1: 21–35.
Caldera, A. and Debande, O. (2010) ‘Performance of Spanish Universities in Technology Transfer: An Empirical Analysis’, Research Policy, 39/9: 1160–73.
Cameron, A. C. and Trivedi, P. K. (1998) Regression Analysis of Count Data. Cambridge: Cambridge University Press. Chapple, W. et al. (2005) ‘Assessing the Relative Performance
of U.K. University Technology Transfer Offices: Parametric and Non-parametric Evidence’, Research Policy, 34/3: 369–84.
Clarysse, B. et al. (2005) ‘Spinning Out New Ventures: A Typology of Incubation Strategies from European Research Institutions’, Journal of Business Venturing, 20/2: 183–216. Colyvas, J. et al. (2002) ‘How do University Inventions Get Into
Practice?’, Management Science, 48/1: 61–72.
Conti, A. and Gaule, P. (2011) ‘Is the US outperforming Europe in University Technology Licensing? A New Perspective on the European Paradox’, Research Policy, 40/1: 123–35.
Curi, C., Daraio, C. and Llerena, P. (2012) ‘University Technology Transfer: How (in)efficient are French Universities?’, Cambridge Journal of Economics, 36/3: 629–54. Debackere, K. and Veugelers, R. (2005) ‘The Role of Academic Technology Transfer Organizations in Improving Industry Science Links’, Research Policy, 34/3: 321–42.
Degroof, J. J. and Roberts, E. B. (2004) ‘Overcoming Weak Entrepreneurial Infrastructures for Academic Spin-Off Ventures’, The Journal of Technology Transfer, 29/3: 327–52. Di Gregorio, D. and Shane, S. (2003) ‘Why do Some Universities Generate More Start-ups than Others?’, Research Policy, 32/2: 209–27.
European Commission. (2008), ‘Recommendation on the Management of Intellectual Property in Knowledge Transfer Activities and Code of Practice for Universities and Other Public Research Organisations’. Luxembourg: Office for Official Publications of the European Communities. <http://ec.europa.eu/invest-in-research/pdf/ download_en/ip_recommendation.pdf> accessed 28 Aug 2014.
——. (2013), ‘The EU Framework programme for research and Innovation Horizon 2020’, Multi-beneficiary General Model Grant Agreement. Version 1.0. 11 December 2013’. <http:// ec.europa.eu/research/participants/data/ref/h2020/mga/gga/ h2020-mga-gga-multi_en.pdf> accessed 20 May 2014. Friedman, J. and Silberman, J. (2003) ‘University Technology
Transfer: Do Incentives, Management, and Location Matter?’, The Journal of Technology Transfer, 28/1: 17–30. Geuna, A. and Rossi, F. (2011) ‘Changes to University IPR
Regulations in Europe and the Impact on Academic Patenting’, Research Policy, 40/8: 1068–76.
Goldfarb, B. and Henrekson, M. (2003) ‘Bottom-up versus Top-down Policies Towards the Commercialization of University Intellectual Property’, Research Policy, 32/4: 639–58.
Gonza´lez-Pernı´a, J. L., Kuechle, G. and Pen˜a-Legazkue, I. (2013) ‘An Assessment of the Determinants of University Technology Transfer’, Economic Development Quarterly, 27/1: 6–17.
Hewitt-Dundas, N. (2012) ‘Research Intensity and Knowledge Transfer Activity in UK Universities’, Research Policy, 41/2: 262–275.
Lach, S. and Schankerman, M. (2004) ‘Royalty Sharing and Technology Licensing in Universities’, Journal of the European Economic Association, 2/2–3: 252–64.
——. (2008) ‘Incentives and Invention in Universities’, The RAND Journal of Economics, 39/2: 403–33.
Lerner, J. (2004) ‘The University and the Start-Up:Lessons from the Past Two Decades’, The Journal of Technology Transfer, 30/1: 49–56.
Link, A. N. and Siegel, D. S. (2005) ‘Generating Science-Based Growth: An Econometric Analysis of the Impact of Organizational Incentives on University–Industry Technology Transfer’, The European Journal of Finance, 11/3: 169–81.
Lissoni, F. et al. (2008) ‘Academic Patenting in Europe: New Evidence from the KEINS Database’, Research Evaluation, 17: 87–102.
Litan, R. E., Mitchell, L. and Reedy, E. J. (2007), ‘Commercializing University Innovations: A Better Way’, NBER Working Paper. <http://sites.kauffman.org/pdf/nber_ 0407.pdf> accessed 3 May 2012.
Long, J. S. and Jeremy, F. (2006) Regression Models for Categorical Dependent Variables Using Stata (Second Edition). College Station, TX: Stata Press.
Markman, G. D., Gianiodis, P. T. and Phan, P. H. (2009) ‘Supply-Side Innovation and Technology
Commercialization’, Journal of Management Studies, 46/4: 625–49.
Markman, G. D. et al. (2004) ‘Entrepreneurship from the Ivory Tower: Do Incentive Systems Matter?’, The Journal of Technology Transfer, 29/3: 353–64.
Merton, R. K. (1996) ‘The Normative Structure of Science’. In: Nowotny, H. and Taschwer, K. (eds) The Sociology of Sciences, Volume 1, pp. 38–49. Cheltenham: Edward Elgar; Brookfield.
Okamuro, H. and Nishimura, J. (2013) ‘Impact of University Intellectual Property Policy on the Performance of University-Industry Research Collaboration’, The Journal of Technology Transfer, 38/3: 273–301.
Owen-Smith, J. and Powell, W. W. (2001) ‘To Patent or Not: Faculty Decisions and Institutional Success at Technology Transfer’, The Journal of Technology Transfer, 26/1: 99–114. Rogers, E. M., Yin, J. and Hoffmann, J. (2000) ‘Assessing the Effectiveness of Technology Transfer Offices at U.S. Research Universities’, Journal of the Association of University Technology Managers, 12: 47–80.
Sapsalis, E. et al. (2006), ‘Antecedents of Patenting Activity of European Universities’. Universite´ Libre de Bruxelles – Solvay Business School. <https://dipot.ulb.ac.be:8443/ dspace/bitstream/2013/53904/1/RePEc_sol_wpaper_05-005. pdf> accessed 10 Nov 2010.
Schartinger, D., Schibany, A. and Gassler, H. (2001) ‘Interactive Relations Between Universities and Firms: Empirical Evidence for Austria’, Journal of Technology Transfer, 26: 255–68.
Schoen, A., van Pottelsberghe de la Potterie, B. and Henkel, J. (2014) ‘Governance Typology of Universities’ Technology Transfer Processes’, The Journal of Technology Transfer, 39/3: 435–53.
Siegel, D. S., Waldman, D. and Link, A. (2003) ‘Assessing the Impact of Organizational Practices on the Relative Productivity of University Technology Transfer Offices: An Exploratory Study’, Research Policy, 32/1: 27–48.
Siegel, D. S. et al. (2003) ‘Commercial Knowledge Transfers from Universities to Firms: Improving the Effectiveness of University-industry Collaboration’, The Journal of High Technology Management Research, 14/1: 111–33.
——. (2004) ‘Toward a Model of the Effective Transfer of Scientific Knowledge from Academicians to Practitioners: Qualitative Evidence from the Commercialization of University Technologies’, Journal of Engineering and Technology Management, 21/1-2: 115–42.
Thursby, J. G., Jensen, R. and Thursby, M. C. (2001) ‘Objectives, Characteristics and Outcomes of University Licensing: A Survey of Major U.S. Universities’, Journal of Technology Transfer, 26: 59–72.
Thursby, J. G. and Kemp, S. (2002) ‘Growth and Productive Efficiency of University Intellectual Property Licensing’, Research Policy, 31/1: 109–24.
Valentin, F. and Jensen, R. (2007) ‘Effects on Academia-Industry Collaboration of Extending University Property Rights’, The Journal of Technology Transfer, 32/3: 251–76. Van Looy, B. et al. (2011) Entrepreneurial Effectiveness of
European Universities: An Empirical Assessment of Antecedents and Trade-offs’, Research Policy, 40/4: 553–64. Woolgar, L. (2007) ‘New Institutional Policies for
University–Industry Links in Japan’, Research Policy, 36/8: 1261–74.
Wright, M. et al. (2008) ‘Mid-Range Universities’ Linkages with Industry: Knowledge types and the Role of Intermediaries’, Research Policy, 37/8: 1205–23.