Testate Amoebae Examined by Confocal and
Two-Photon Microscopy: Implications for
Taxonomy and Ecophysiology
Zuzana Burdíková,1,2,* Martin Cˇ apek,1,3Pavel Ostasˇov,1 Jirˇí Machacˇ,4 Radek Pelc,1 Edward A.D. Mitchell,5 and Lucie Kubínová1
1Institute of Physiology, Academy of Sciences of the Czech Republic, v.v.i., Vídenˇská 1083,
CZ-14220 Prague 4, Czech Republic
2Institute of Geology and Paleontology, Faculty of Science, Charles University, Albertov 6,
CZ-12843 Prague 2, Czech Republic
3Faculty of Biomedical Engineering, Czech Technical University in Prague, nám. Sítná 3105,
CZ-27201 Kladno, Czech Republic
4Institute of Botany, Academy of Sciences of the Czech Republic, v.v.i., Zámek 1,
CZ-25243 Pru˚honice, Czech Republic
5Laboratory of Soil Biology, University of Neuchâtel, Rue Emile-Argand 11, CH-2000 Neuchâtel, Switzerland
Abstract: Testate amoebae ~TA! are a group of free-living protozoa, important in ecology and paleoecology.
Testate amoebae taxonomy is mainly based on the morphological features of the shell, as examined by means of light microscopy or ~environmental! scanning electron microscopy ~SEM/ESEM!. We explored the potential applications of confocal laser scanning microscopy ~CLSM!, two photon excitation microscopy ~TPEM!, phase contrast, differential interference contrast ~DIC Nomarski!, and polarization microscopy to visualize TA shells and inner structures of living cells, which is not possible by SEM or environmental SEM. Images captured by CLSM and TPEM were utilized to create three-dimensional ~3D! visualizations and to evaluate biovolume inside the shell by stereological methods, to assess the function of TA in ecosystems. This approach broadens the understanding of TA cell and shell morphology, and inner structures including organelles and endosymbionts, with potential implications in taxonomy and ecophysiology.
Key words: testate amoebae, confocal microscopy, environmental scanning electron microscopy, taxonomy,
ecophysiology
I
NTR ODUCTIONTestate amoebae ~TA! belong to a polyphyletic group of unicellular eucaryotes ~ca. 10–400 mm! protected by a shell ~test!. The shell enclosing the cell plasma usually has a single aperture ~operculum! for the pseudopodia, rarely two apertures. A proteinaceous organic matrix is the basic shell component ~Meisterfeld, 2002a, 2002b!. There are four main shell types: proteinaceous only, calcareous, siliceous ~species secreting their own regular siliceous shell plates, so-called idiosomes!, and agglutinated ~species incorporat-ing extraneous mineral particles, so-called xenosomes, into their shells! ~Wanner, 1999!. Despite the presence of an opaque shell, some testate amoeba species have photosyn-thetic endosymbionts and are thus mixotrophic ~Meister-feld, 2002a, 2002b!.
Testate amoebae are commonly used as model organ-isms in population ecology, ecotoxicology, ecology, paleoecology, and evolutionary biology. They are useful bioindicators of natural ecological gradients, environmental stress, or pollution in both aquatic and terrestrial ecosys-tems ~Patterson et al., 1996, 2002; Foissner, 1997, 1999; Booth, 2002; Mitchell et al., 2008a, 2008b!. In most aquatic and terrestrial ecosystems, TA also play an important role in the cycling of nutrients, especially C, N, and Si ~Schönborn, 1983, 1992; Schröter et al., 2003; Aoki et al., 2007; Wilkin-son, 2008; Vohník et al., 2009!.
A prerequisite for the use of TA in ecological and paleoecological studies is a sound taxonomy. TA taxonomy is mainly based on the shell structure ~Ogden & Hedley, 1980!. Indeed, in a number of taxa the cytoplasm, the nuclei and types of pseudopodia have not been observed yet ~Meisterfeld, 2002a, 2002b!. Recent studies combining mor-phological and molecular data have revealed an unexpected diversity among the testate amoebae, thus illustrating their role as a model group to study evolutionary processes such Received April 26, 2010; accepted August 22, 2010
*Corresponding author. E-mail: [email protected].
M
icroanalysis
as marine-terrestrial transitions. Subtle morphological fea-tures that are typically invisible under light microscopy were shown be of taxonomical significance ~Todorov et al., 2009; Heger et al., 2010!.
Ecological studies aiming to establish the contribution of TA to biomass or nutrient cycling require a reliable estimate of cell volume ~e.g., Gilbert et al., 1998; Mitchell et al., 2003; Schröter et al., 2003!. The volume of biomass inside the shells can be calculated by applying an appropri-ate conversion factor ~Madrid & Felice, 2005! or by assum-ing that the TA shells can be approximated by simple geometrical shapes ~Gilbert et al., 1998!. The accuracy of these approaches is limited ~Charrière et al., 2006!.
There has been a growing demand to revise the taxon-omy of testate amoebae and to develop new optical methods for their reliable identification ~Mitchell & Gilbert, 2010!. Apart from scanning electron microscopy ~SEM! as the most common technique, the ideal imaging setup should distin-guish the relevant morphological features without requiring an excessively complex preparation and handling. To some extent, the optical contrasting modalities such as phase con-trast, differential interference contrast ~DIC! ~Murphy, 2001! or digital holographic microscopy, a modern adaptation of interference microscopy ~Charrière et al., 2006! can be uti-lized, as demonstrated in TA ~Beyens & Meisterfeld, 2001; Charrière et al., 2006!. If biovolume estimations and/or three-dimensional ~3D! reconstructions are required confocal or two-photon microscopy represent a convenient solution.
The aim of the present study is to explore the potential of confocal laser scanning microscopy ~CLSM! and two-photon excitation microscopy ~TPEM! together with 3D reconstructions and stereological measurements for the study of testate amoebae morphology.
M
ATERIALS ANDM
ETHODSSpecimens
Samples of TA were collected from four pools of Komorˇany ponds near Vltava river, 1–2 m from the river, in Prague, Czech Republic. TA from Komorˇany pools were studied with-out fixation and stored in their natural environment ~water! for not more than 4 h before image acquisition. Samples from the Alps and Jura Mountains ~Switzerland! and from
Sphag-num moss areas of the Sˇumava Mountains ~Czech Republic!
were studied both before and after a paraformaldehyde fixa-tion. A list of all examined species is shown in Table 1.
The fixation was performed by a gentle centrifugation followed by replacing the resulting supernatant by 4% para-formaldehyde ~45 min at room temperature!. After fixation the specimen was centrifuged again and supernatant re-placed by filtered water ~0.2 mm mesh! obtained from the place of sampling.
For DAPI, Hoechst 34580, propidium iodide, and Alexa-Fluor 633 phalloidin staining, the TA were fixed and treated
with 0.1% Triton X-100 ~5 min at room temperature! to per-meabilize the plasma membrane. The samples were then cen-trifuged, Triton X-100 aspired, and the samples suspended in water. Triton X-100 was not used when identifying dead/ living cells by propidium iodide staining ~Table 1, Fig. 3h!.
The TA samples were stained as specified in Table 2, centrifuged in Eppendorf tubes ~12,100 rpm for 45 s, RCF ca. 9,000 g!, supernatant removed and replaced with filtered water ~0.2 mm mesh! from the place of sampling. The centrifugation was performed three times to remove any excessive probe. Afterwards, the TA suspension in water was mounted between a microscope slide and a cover slip sealed together with nail varnish.
Optical Contrasting
All images shown in Figure 1 were acquired with an Olym-pus DP70 digital camera fitted to an OlymOlym-pus BX60 upright microscope equipped with U-UCD8 universal condenser ~NA 0.90 in a dry “TLD” mode!.
Conventional phase contrast with no special modifica-tions was employed. Polarization microscopy was per-formed in a simple way, with the specimen placed between crossed or nearly crossed polarizers. Differential interfer-ence contrast ~DIC Nomarski! images were optimized by adjusting the position of the Wollaston prism in a DIC slider ~U-DICT type!, thus setting an optimal bias retarda-tion, depending on the optical thickness of the object ~testate amoeba!. Two objective lenses were used: UPlanFl 40x/0.75 Ph2 ~Fig. 1b! and UPlanFl 20x/0.50 ~all other images!.
Except for Figures 1f,h, all images shown in Figure 1 are processed ones obtained from raw images acquired at a series of focal planes, by employing a DeepFocus module of QuickPHOTO Micro software.
Scanning and Environmental Scanning
Electron Microscopy
A scanning electron microscope FEI Quanta 200 was used as described in ~Michels & Schnack-Schiel, 2005!, either in SEM or environmental SEM ~ESEM! mode.
For the SEM ~high-vacuum! mode, the fixed shells were critical point dried or partially dried, mounted on metal stubs with a double-sided adhesive conductive ~carbon! tape and coated with gold ~4 min at 20 mA in a vacuum of about 10 Pa, with argon present! using a sputter coater. The stubs were then affixed by the carbon tape to a microscope stage. The gold-coated TA shells were examined at 20–30 kV in a high vacuum mode, using an Everhart-Thornley second-ary electron detector.
For the ESEM mode, the fixed shells were washed in distilled water to remove the fixatives, partially dried, and placed on a Peltier-cooled stage ~JT Manufacturing, Hud-son, NH, USA!. To prevent the stub from drifting, it was previously covered with the same double-sided adhesive conductive ~carbon! tape as used in SEM. The TA shells were observed at 20–30 kV, 200–400 Pa, and sample
temper-ature of ⫺148C to ⫺48C. Alternatively, the pressure was raised up to 1 kPa with no cooling applied. A gaseous secondary electron detector was used.
Confocal Laser Scanning Microscopy
Two confocal laser scanning microscope systems were used: ~1! Leica TCS SPE based on Leica DM 2500 CSQ V-VIS fluorescence microscope and equipped with four solid state lasers, 405 nm ~25 mW!, 488 nm ~15 mW!, 532 nm ~15 mW!, 635 nm ~15 mW!; ~2! Leica TCS SP2 AOBS based on Leica DM IRE2 inverted microscope and equipped with continu-ous lasers; Ar: 458 nm ~5 mW!, 476 nm ~5 mW!, 488 ~20 mW!, 514 nm ~20 mW!; HeNe: 543 nm ~1.2 mW!, 633 nm ~10 mW!.
The laser power and detector offset and gain were manually adjusted prior to image stack collection, so that
the best combination of black background and avoidance of black pixels and oversaturation in the structures of interest was achieved. The image stacks were obtained by collecting optical sections throughout the entire thickness of the spec-imen. The images ~optical sections! were acquired using scan rates and frame averaging settings to yield the best signal-to-noise ratio within a reasonable collection time. In most cases water immersion planapochromat objectives HC PL APO 20x/0.70 IMM CORR CS and HCX PL APO 63x/1.20 W CORR CS were used.
Due to attenuation of the light arising from deeper parts of the sample, the images in the acquired stack were enhanced by two methods: ~1! online method—an intensity compensation feature of Leica Confocal Software ~version 2.61, Leica Microsystems GmbH, Heidelberg, Germany! in a “linear-by-gain” mode, adjusting the photomultiplier tube gain according to the z-coordinate of the current image and Table 1. A List of Observed Testate Amoebae Species and Tested Fluorescent Probes.~*!
Species Probe/Number of Examined TA
Number of All/Living Cells ~P and B Probes Combined!
Arcella vulgaris Ehrenberg Arcella discoides Ehrenberg
A/3, B/2, C/3, D/1, M/2, P/5, TR/2 55/7
Archerella flavum ~Archer! A/3
Assulina muscorum Greeff Assulina seminulum Penard
A/10, B/10, D/10, DI/10, F/10, PH/10, S/1
Centropyxis aculeata ~Ehrenberg! Stein Centropyxis aerophila Deflandre
Centropyxis constricta ~Ehrenberg! Penard
A/5, AB/3, B/45, D/7, P/6, T/5, TR/8 66/18
Corythion dubium Taranek B/1
Cyclopyxis eurystoma Deflandre Cyclopyxis kahli Deflandre
B/4, T/7
Cyphoderia ampulla Ehrenberg 1/1
Difflugia oblonga Ehrenberg B/3, D/4, H/3, P/3, T/8 21/4
Euglypha ciliata Ehrenberg Euglypha compressa Carter Euglypha strigosa Ehrenberg
B/5, C/3, D/2, E/5, H/2, L/5, M/10, P/6, S/1, T/3 31/10
Hyalosphenia papilio Leidy A/10, B/10, D/10, DI/10, F/10, PH/10, S/3, T/4
Nebela bohemica Taranek A/10, B/10, C/3, D/10, DI/10, F/10, PH/10
Nebela tincta Leidy
Tracheleuglypha dentata Penard A/3, B/5, D/4, P/3, T/6 21/5
Trinema complanatum Penard A/10, B/28, D/11, H/3, P/6, T/20, TR/6 68/8
Trinema enchelys Ehrenberg Trinema lineare Penard
Trigonopyxis arcula Penard AB/4
~*!The following notation was used: A ~Acid Fuchsin!, AB ~Aniline Blue!, B ~BCECF-AM!, C ~CellTracker Green CMFDA!, D ~DAPI!, DI
~DiOC3~3!!, E ~Er-Tracker Blue-White DPX!, F ~FITC!, H ~Hoechst 34580!, L ~LysoTracker Red DND-99!, M ~MitoTracker Deep Red
FM!, P ~propidium iodide!, PH ~AlexaFluor 633 phalloidin!, S ~SYTO 16!, T ~TMRE!, TR ~Texas Red C2-maleimide!. The third column
indicates the number of all individuals in a combined propidium iodide and BCECF-AM staining experiment ~before slash! and the number of individuals identified as alive by this method ~after slash!.
maintaining the best signal-to-noise ratio throughout the sample; ~2! offline method—a custom plug-in for the
El-lipse modular software package ~ViDiTo, Slovakia; www.
vidito.com!, adjusting the brightness and contrast in an image series ~stack! so that the effect of light attenuation is minimized ~Cˇ apek et al., 2006!.
Autofluorescence was recorded at an excitation/detection wavelength of 633/650–710 nm.
Two-Photon Excitation Microscopy
An above-mentioned confocal microscope ~Leica TCS SP2 AOBS! was used in concert with a Ti:Sapphire Chameleon Ultra family femtosecond laser Mira 900 ~Coherent, Santa Clara, CA, USA! tunable from 690 to 1,040 nm. A two-photon fluorescence signal was collected by an internal detector placed in the scanning head of the confocal micro-scope ~descanned, backscattering geometry!. The detected wavelength was adjusted by applying lambda scans to max-imize the fluorescence signal of the sample. The average laser power on the sample was in the order of milliwatts.
3D Visualization
CLSM and TPEM provided a series of perfectly aligned optical sections of TA cells. To visualize them as 3D objects, we used the Ellipse software package ~ViDiTo Systems, Ko-sˇice, Slovakia! adapted to work with a specialized Volume-Pro 1000 board ~www.terarecon.com!, performing volume rendering of digital scalar data in real time ~Cˇ apek et al., 2009!.
Stereological Measurement
The biovolume inside TA shells was determined by the stereological “Fakir” method from images acquired by CLSM or TPEM ~Cruz-Orive, 1997; Kubínová & Janácˇek, 2001; Kubínová et al., 2002!. The fakir probe ~Cruz-Orive, 1997! is a systematic probe consisting of parallel test lines ~re-sembling nails of a fakir’s bed and piercing its surface!. We applied a highly efficient spatial grid consisting of three mutually perpendicular half-period shifted fakir probes ~Kubínová & Janácˇek, 1998, 2001; Difato et al., 2004!. The TA biovolume ~V ! was estimated by the following formula:
estV⫽ 3 1
⫺{u2{~L
1⫹ L2⫹ L3!,
where Li ~i ⫽ 1,2,3! is the total length of object-to-probe
intercepts ~i ’th fakir probe!, the object being the biomass boundary; u is the grid constant, i.e., the smallest distance between neighboring parallel lines of the fakir probe. The position of the spatial grid was random ~Weibel, 1979!.
R
ESULTSBasic Morphology
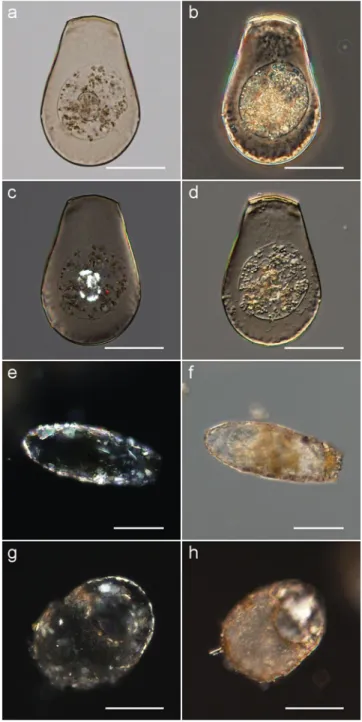
The testate amoeba architecture was visualized by employ-ing complementary optical contrastemploy-ing modalities such as phase contrast ~Fig. 1b!, polarization ~Fig. 1c,e,g!, and DIC Nomarski ~Fig. 1d,f,h! microscopy in unstained cells/shells. The origin of the optically active objects highlighted in Table 2. Excitation and Emission Wavelengths, Staining Protocols, and Targets of Applied Fluorescent Probes.
Fluorescent Probe~*1! Excitation/Detection Wavelength~*2! ~nm! Final Concentration Staining Time ~min! Targets~*3!
Acid Fuchsin ~84600! 543/600–650 170 mM 10 Chitin, vacuoles, cytoplasm
AlexaFluor 633 phalloidin ~A22284! 633/650–700 130 nM 120 Actin
Aniline Blue ~ANIL01600! 405/500–550 135 mM 10 Chitin
BCECF–AM ~B8806! 458 and 488/500–550 2 mM 25 Cytoplasm, pH
CellTracker Green CMFDA ~C7025! 488/500–580 4 mM 30 Cytoplasm, only metabolically active cells
DAPI ~D1306! 405/450–520 300 mM 20 Nucleic acids
DiOC3~3! ~43580! 488~1P!, 950 ~2P!/500–650~*4! 13.6 mM, 4.5 mM 20–25 Membranes
Er-Tracker Blue-White DPX ~E12353! 405 ~1P!, 790 ~2P!/430–640~*4! 2 mM 120 Endoplasmic reticulum
FITC ~46952! 488 ~1P!, 950 ~2P!/500–580~*4! 1 mM 20 General staining, aminogroups
Hoechst 34580 ~H21486! 405/430–490 1.8 mM 30 Nucleic acids
LysoTracker Red DND-99 ~L7528! 543/580–620 200 nM 120 Lysosomes
MitoTracker Deep Red FM ~M22426! 633/640–650 1 mM 120 Mitochondria
Propidium Iodide ~70335! 532/600–670 7.5 mM 25 Nucleic acids
SYTO 16 ~S7578! 488/500–530 10 mM 90 Nucleic acids
Texas Red C2-maleimide ~T6008! 532/600–650 14 nM 40 General staining
TMRE ~T669! 532/560–590 1 mM 20 Mitochondria
~*1!ID codes ~shown in brackets!: Sigma-Aldrich ~numerical and B8806!, Fluka ~ANIL01600!, or Invitrogen ~other alfanumerical!. ~*2!Values actually used in the present study.
~*3!Manufacturers’ data.
Figure 1c is unclear and requires further elucidation. Test scales and/or sand grains adsorbed on the test surface are also highlighted by polarization microscopy ~Fig. 1e,g!. The cyst architecture is best visualized by DIC Nomarski imag-ing ~Fig. 1d! while its outline is better rendered by phase contrast ~Fig. 1b!. A bright-field image ~no optical contrast-ing! is shown for comparison ~Fig. 1a!.
Surface Structures
SEM and ESEM were used to visualize the surface of TA shells at high resolution. It is possible to observe the shell coated with sand grains, its structure, and typical morpho-logical characteristics ~Fig. 2c,d,e!.
As ESEM does not require the samples to be metal-coated, frequent artifacts caused by the coating procedure are eliminated. The only requirement is to avoid mechanical or chemical impurities, such as various particles or surface films. ESEM microscopy often yields better quality images of the shell, plus details just under the shell surface ~Fig. 2e!, in comparison to SEM. However, SEM or ESEM cannot be applied to visualize living TA.
Cellular Compartments
Labeling of the TA shell with acid fuchsin let us observe secreted scales, or organic or mineral xenosomes used as building blocks of the shell ~Figs. 2a, 3m, 4a!. In some cases, the SEM and CLSM images nicely complement each other ~Fig. 2!. Acid fuchsin also reveals the internal structure of the cell ~Fig. 2a,b,f,g!, and such data can be combined with autofluorescence observations of chlorophyll present in en-dosymbionts ~Fig. 3a,b!.
Fluorescein derivative BCECF-AM labeled the cyto-plasm in living TA individuals only ~Fig. 3c,e!, including a protoplast, most likely of another organism, inside an other-wise empty shell ~Fig. 4e! or even cell nuclei during mitosis ~Fig. 4f!. In living TA, BCECF-AM also stains the shell ~Fig. 3e! and its architecture can be observed in great detail ~Fig. 4c!. However, the image is not as sharp as in the case of acid fuchsin. BCECF-AM can also be used to determine cytosolic pH ~Fig. 4h!.
Propidium iodide stains nucleic acids in dead individu-als ~Fig. 3h!. DiOC3~3! stains membranes, including those of organelles within the cell ~Fig. 3i,j!. Mitochondria can be specifically labeled by MitoTracker Deep Red FM ~Fig. 3k! and TMRE ~Fig. 3l!. Aniline blue visualizes some compo-nents of TA shells and appears to be complementary to acid fuchsin ~Fig. 3m!. CellTracker Green CMFDA also labels living TA ~Fig. 3n!. Er-Tracker Blue White DPX stains the endoplasmic reticulum of TA ~Fig. 3o!. FITC binds to proteins within the cell ~Figs. 3p, 5a,b!. The vacuoles of
Hyalosphenia papilio labeled by FITC ~Figs. 3f,p, 5a! were
visualized using a single laser line wavelength ~488 nm!. Staining by Hoechst 34580, DAPI, LysoTracker Red DND-99, AlexaFluor 633 phalloidin, SYTO 16, and Texas Red C2-maleimide was unsuccessful ~data not shown!. Other results are summarized in Table 3.
Endosymbiotic Algae
Autofluorescence was recorded in Archerella flavum ~Fig. 3a! and Hyalosphenia papilio ~Figs. 3b,f,i,j,l,p, 4f!. Both of them are mixotrophic species ~i.e., TA containing endosymbiotic Figure 1. Optical contrasting of unstained testate amoebae:
~a–d! Hyalosphenia papilio ~cyst!, ~e,f ! Difflugia oblonga ~living
cell!, and ~g,h! Centropyxis sp. ~two similar but different cells!. Note the complementary nature of ~a! bright field, ~b! phase contrast, ~c,e,g! polarization, and ~d,f,h! DIC Nomarski imaging. Scale bar in all images, 50 mm.
algae with chlorophyll that exhibits autofluorescence!. This phenomenon could be useful in studies of symbionts inside mixotrophic TA species. No autofluorescence was found in heterotrophic species.
Identification of Living and Dead Amoebae
A combination of BCECF-AM and propidium iodide fluo-rescent probes, commonly used to assess cell vitality ~King,
2000!, can be successfully applied to separate dead and living TA ~Table 1!. While propidium iodide stained nucleic acids in dead cells with permeable membrane ~Fig. 3h!, fluorescence of BCECF-AM could only be observed in liv-ing cells with an intact membrane ~Fig. 3c,e!, owliv-ing to enzymatic processes that activate the fluorescent probe ~see Discussion for details!. Amoebae shown in Fig. 3c,e,h were subjected to the combined two-probe staining.
Figure 2. Shell ~test! shapes and surface structures visualized by CLSM, SEM, and ESEM. a,b: Nebela tincta in CLSM
~acid fuchsin staining!; ~a! maximum intensity projection, scale bar 20 mm, ~b! serial optical sections ~overlay with bright field!. c: Nebela tincta in ESEM, scale bar 20 mm. d: Centropyxis aculeata in SEM, details of aperture, scale bar 20 mm. e: Trigonopyxis arcula in ESEM, scale bar 20 mm. f,g: Centropyxis aculeata in CLSM ~acid fuchsin staining!, cyst inside the test, scale bar 50 mm; ~f ! serial optical sections, ~g! overlay of bright field and maximum intensity projection of image f.
Table 3. Suitability of Fluorescent Probes for Visualization of Various Compartments and Endosymbionts of Testate Amoebae ~⫺ Unsuccessful, ⫹ Poor, ⫹⫹ Successful, ⫹⫹⫹ Excellent Labeling!.
Targets of Fluorescent Probes Fluorescent Probe
Nucleolus,
Nucleus Cytoplasm Membranes Shell
Specific
Organelles Symbionts
Acid Fuchsin ⫺ ⫹⫹⫹ ⫺ ⫹⫹⫹ ⫺ ⫺
Aniline Blue ⫺ ⫺ ⫺ ⫹ ⫺ ⫺
BCECF-AM ⫺ ⫹⫹ ⫹ ⫹ ⫺ ⫺
CellTracker Green CMFDA ⫺ ⫹ ⫺ ⫺ ⫹⫹⫹~*! ⫺
DiOC3~3! ⫺ ⫺ ⫹⫹⫹ ⫹ ⫺ ⫺
Er-Tracker Blue-White DPX ⫺ ⫺ ⫺ ⫺ ⫹⫹ ⫺
FITC ⫺ ⫹⫹⫹ ⫺ ⫹ ⫺ ⫺
MitoTracker Deep Red FM ⫺ ⫺ ⫺ ⫺ ⫹⫹ ⫹⫹⫹
Propidium Iodide ⫹ ⫺ ⫺ ⫺ ⫺ ⫺
TMRE ⫺ ⫺ ⫺ ⫺ ⫹⫹⫹ ⫺
Figure 3. Testate amoebae in CLSM as stained by various fluorescent probes. a: Archerella flavum, cytoplasm
and nucleolus ~green, acid fuchsin! and endosymbionts’ chlorophyll-a ~red, autofluorescence!, maximum intensity projection; yellow color is due to overlaying red and green channels. b: Hyalosphenia papilio, cytoplasm ~green, acid fuchsin! and endosymbionts’ chlorophyll ~red, autofluorescence!. c: Difflugia oblonga, cytoplasm of living TA ~green, BCECF-AM!. d: Difflugia oblonga, bright-field image of c. e: Euglypha sp., cytoplasm and test ~green, BCECF-AM!, maximum intensity projection; uneven cytoplasm staining may be attributed to a varying esterase activity across cellular compartments. f: Hyalosphenia papilio, generic staining, preferentially of amine and sulfhydryl groups on protein molecules ~green, FITC! and endosymbionts’ chlorophyll ~red, autofluorescence!, maximum intensity projection. g: Hyalosphenia papilio, bright-field image of f. h: Difflugia oblonga, nucleus ~nucleic acids! in dead TA ~red, propidium iodide!, overlay with bright field. i,j: Hyalosphenia papilio, membranes of living TA @green, DiOC3~3!#
and endosymbionts’ chlorophyll ~red, autofluorescence!; ~ j! overlay of maximum intensity projection and bright field.
k: Euglypha sp., mitochondria ~red, MitoTracker Deep Red FM!, overlay of maximum intensity projection and bright
field. l: Hyalosphenia papilio, mitochondria ~yellow, TMRE!, endosymbionts’ chlorophyll ~red, autofluorescence!, overlay with bright field. m: Trigonopyxis arcula, test ~blue, aniline blue; red, acid fuchsin!, maximum intensity projection.
n: Nebela bohemica, generic staining ~green, CellTracker Green CMFDA!, overlay with bright field. o: Euglypha sp.,
endoplasmatic reticulum ~cyan, Er-Tracker Blue-White DPX!, overlay with bright field. p: Hyalosphenia papilio, cyst, generic staining ~green, FITC! and endosymbionts’ chlorophyll ~red, autofluorescence!. Scale bar in all images, 30 mm.
Rose Bengal ~rB! is also commonly used to identify dead and living TA individuals ~Patterson et al., 2002!. However, no living specimens were detected by rB in our samples from the same locality and time. This may be attributed to generic problems with rB staining as described
by Bernhard ~2000!. Thus, we recommend the BCECF-AM⫹ propidium iodide method over rB staining alone to identify dead/living TA individuals. Separating dead and living TA individuals is important in ecological studies ~Nguyen-Viet et al., 2008!. Moreover, propidium iodide also Figure 4. Advantages of CLSM imaging of testate amoebae. a: Tracheleuglypha dentata in CLSM, empty test ~red,
acid fuchsin!, maximum intensity projection, scale bar 10 mm. b: Trinema sp. in ESEM, test surface, scale bar 10 mm.
c,d: Nebela bohemica in CLSM, detail of the test structure ~green, BCECF-AM!; ~c! maximum intensity projection,
~d! bright field, scale bar 10 mm. e: Euglypha sp. in CLSM, protoplast inside the test ~green, BCECF-AM!, overlay with
bright field, scale bar 10 mm. f: Hyalosphenia papilio in CLSM, cell nucleus in mitosis and cytoplasm ~green, BCECF-AM! and endosymbionts’ chlorophyll ~red, autofluorescence!, scale bar 30 mm. g: Corythion dubium in CLSM, cytoplasm and test ~green, BCECF-AM! with lateral views ~optical sections along the white lines are more visible in the online version!, scale bar 10 mm. h: Euglypha sp., pH distribution determined by BCECF-AM ~ratiometric probe, pH-to-color not as-signed, pseudocolor image!, scale bar 10 mm.
Figure 5. Comparison of CLSM and TPEM in terms of penetrating depth ~shown in lateral views! in Hyalosphenia papilio. Organic components ~green, FITC! and endosymbionts’ chlorophyll ~red, autofluorescence!; ~a! CLSM,
allows counting of nuclei, which is important in taxonomy ~Meisterfeld, 2002a, 2002b!.
Opaque/Large Amoebae
In small TA species ~10–100 mm! with translucent shells, standard CLSM yields satisfactory results ~Fig. 4g!. Prob-lems occur with larger ~thicker! species and those that build opaque shells ~typically made of agglutinated organic or mineral particles!. Since both emission and excitation light is strongly absorbed by the shell and the amoeba itself, CLSM typically makes it possible to acquire TA images from depths up to 20 mm only ~Fig. 5a!. In deeper layers the images suffer from low signal-to-noise ratio.
These problems are partly solved by TPEM whose excitation light is in the infrared range capable of penetrat-ing deeper into most biological objects ~Fig. 5b!, up to 70 mm in TA. This is sufficient for the vast majority of TA species and enables biovolume estimation of the amoeba inside the shell, and 3D reconstructions.
3D and Biovolume Data
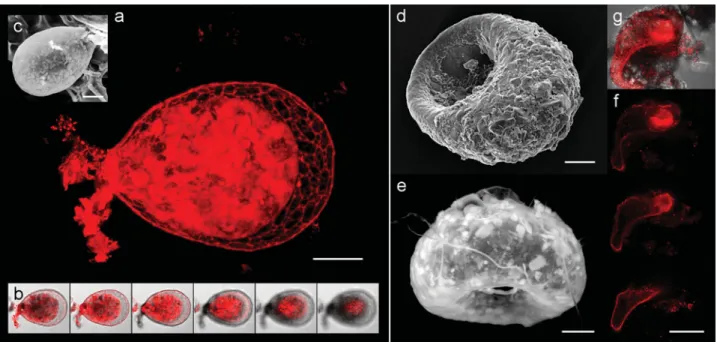
3D visualizations based on CLSM and TPEM images ~ac-quired from one direction only! make it possible to examine the object from any angle ~Fig. 6!. Owing to the 3D data, it is possible to precisely localize in the amoeba chlorophyll ~Fig. 6a–d!, the activity of nonspecific esterases ~Fig. 6e–h! or any other fluorescent structure of interest.
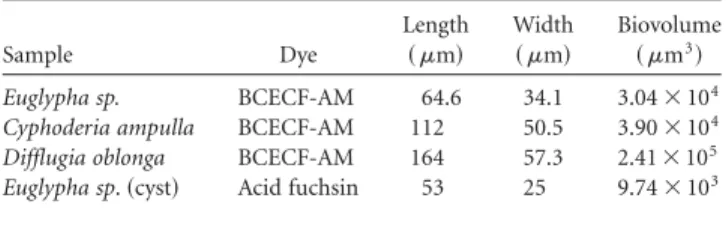
The results of stereological biovolume measurement in four TA specimens are summarized in Table 4. By using the “Fakir” method, we were able to evaluate biovolumes with sufficient accuracy while keeping the image acquisition time reasonably short ~tens of minutes per one image stack!.
D
ISCUSSIONFuture progress in testate amoeba taxonomy and ecology requires a detailed morphological characterization of their shells and cells, as it helps to select the criteria for distin-guishing closely related, morphologically similar species. A detailed examination of cell content, e.g., quantification of
organelles and ~in mixotrophic species! endosymbionts, or biovolume estimation yields information about the physio-logical state of the amoeba, with implications in ecophysiol-ogy and ecotoxicolecophysiol-ogy. Likewise, it is important to reliably recognize living and dead individuals.
The relatively simple optical contrasting modalities such as phase contrast, DIC-Nomarski, or Hoffman modulation contrast reveal the variations of a refractive index within the specimen and are akin to the digital holographic micros-copy mentioned toward the end of Discussion. They are particularly suitable for examining nonabsorbing objects such as unstained living cells ~Murphy, 2001!. The structure of the TA shell can often be visualized by a simple polariza-tion microscopy at a negligible cost, owing to the shell’s ~bio!mineralized nature ~Fig. 1e,g!. In this context, such modes are complementary with CLSM better capable of visualizing cell components stained with specific fluorescent probes. For example, BCECF-AM binds to the organic part of the TA shell only ~Fig. 4c!.
SEM and ESEM are frequently used for taxonomical descriptions of testate amoebae, and less often in ecological studies. They make it possible to examine the surface fea-tures of TA at high resolution and a very reasonable depth of field, and to perform quantitative elemental analyses of shell structures ~Ogden & Hedley, 1980; Todorov et al., 2009!. However, SEM and ESEM cannot be used to examine living TA or the inner architecture of the amoeba or the shell. Conventional SEM can only operate in a high-vacuum mode, which dictates the rather complex specimen prepara-tion protocol, itself a source of a number of artifacts. ESEM and some of its alternatives, such as variable pressure SEM ~VP-SEM!, allow the examination of specimens under a wide range of gaseous conditions. These permit an investi-gation of the biological samples, usually only nonliving ones, in a closer-to-natural ~uncoated! state, and are appli-cable to practically any TA shell type. The drawback is a lower image contrast of the uncoated sample.
The fluorescent probes required in CLSM can penetrate into the amoeba only through the shell operculum and some of them thus require a longer loading/staining time. The reproducibility of the labeling protocols is often prob-lematic. For example, Acanthamoeba castellanii was success-fully labeled by rhodamine tagged phalloidin complex to visualize actin ~González-Robles et al., 2008!. However, we failed to stain TA with this probe.
It is more difficult to stain shell-enclosed TA than naked amoebae or animal cells. The same applies to foram-inifera that also build their shells with an operculum. Bernhard et al. ~2004! successfully stained foraminifera by calcein, which we have not tested in TA. Instead, we experimented with fluorescein derivative BCECF-AM, a similar type of fluorescent probe. In many cases a trial-and-error approach had to be applied to optimize the labeling protocols in terms of photodamage, toxicity, and photo-bleaching, and ten fluorescent probes were successfully used.
Table 4. Biovolume of Testate Amoeba Inside Their Shells Eval-uated by the Stereological Fakir Method.
Sample Dye Length ~ mm! Width ~ mm! Biovolume ~ mm3! Euglypha sp. BCECF-AM 64.6 34.1 3.04⫻ 104
Cyphoderia ampulla BCECF-AM 112 50.5 3.90⫻ 104
Difflugia oblonga BCECF-AM 164 57.3 2.41⫻ 105
Rose Bengal ~rB! is the most commonly used probe to distinguish live/dead shell-enclosed TA or foraminifera cells. rB is a biological dye that is supposed to bind to cytosolic proteins, rendering the cytoplasm in a rose color ~Walton, 1952!. The main advantages of rB are quick staining and a relatively low price. However, necrotic as well as healthy cytoplasm is stained in foraminifera. It has been shown that rB reacts even weeks or months after individu-al’s death. Moreover, even specimens known to contain dead cells do not always become rB stained ~Martin & Steinker, 1973; Lutze & Altenbach, 1991!. Generally, rB
should not be used as the only dye to detect live/dead cells ~Bernhard, 2000!. Sudan black ~a lipophilic stain! is yet another probe that is often used to distinguish live/dead foraminifera and suffers from similar drawbacks as rB— staining opaque specimens may yield ambiguous results ~Bernhard, 2000!.
These problems are absent if a combination of BCECF-AM and propidium iodide is used; live/dead TA are clearly distinguished. BCECF-AM probe is nonfluorescent and membrane-permeable in its basic state. Upon cleavage by nonspecific esterases, it becomes fluorescent but also mem-Figure 6. 3D reconstructions of testate amoebae. a–d: Hyalosphenia papilio test ~ca. 150 mm in length!, membranes and
shells @green, DiOC3~3!# and endosymbionts’ chlorophyll ~red, autofluorescence! in CLSM ~the surface layer lines
represent the amoebae outline in individual optical sections used in the reconstructions!; ~a! VolumePro 1000 rendering board, ~b–d! OpenGL-based volume rendering; the same cell is shown in images a and d. e,f: Euglypha sp. test ~75 mm in length, original image in Fig. 3e!, shells and enzymatic activity of cytoplasm ~green, BCECF-AM! in CLSM, maximum intensity projection; ~e! front view, ~f ! rear view. g,h: Corythion dubium test ~35 mm in length, original image in Fig. 4g!, shells and enzymatic activity in cytoplasm ~green, BCECF-AM! in CLSM, maximum intensity projection; ~g! front view, ~h! rear view.
brane impermeable, so it gets trapped in living cells but quickly disappears from dead or membrane-damaged cells. Surprisingly, we observed fluorescence not only inside the living cells, but also in the shells of living amoebae ~between idiosomes!, perhaps due to nonspecific esterases that may be part of the organic ~proteinaceous! matrix sustaining the shell. This notion is supported by the fact that the fluores-cence was detected in the shells of living TA only.
In mammalian tissues, mitochondria are among the first organelles that exhibit distinct structural alterations during necrosis ~Raffray & Cohen, 1997!. If intact mitochon-dria are observed in TA, one may conclude that the cell is alive at the time of staining. In our samples differences were encountered in spatial distribution of mitochondria be-tween Euglypha sp. ~a heterotrophic species! labeled by MitoTracker Deep Red FM ~Fig. 3k! and Hyalosphenia papilio ~a mixotrophic species! labeled by TMRE ~Fig. 3l!. It is premature yet to draw any conclusions about the two nutri-tion strategies but both of these probes are known to accumulate in active mitochondria only.
To determine the biomass inside the shell, an optical diffraction tomography technique based on digital holo-graphic microscopy ~DHM! can be utilized. This method, essentially an adaptation of an interference-phase micros-copy utilizing coherent light, enables a tomographic recon-struction of the microscopic object with a resolution of ca. 1.5 mm in all three directions ~Charrière et al., 2006!. Very small objects such as organelles or endosymbionts are better modeled by CLSM owing to its optical sectioning capability and better lateral/axial resolution ~Diaspro, 2002; Matsu-moto, 2002; Pawley, 2006! although in larger specimens such as Hyalosphenia papilio, the laser light cannot penetrate suffi-ciently deep into the amoeba, and TPEM ~Denk et al., 1990; Diaspro, 2002! would have to be employed instead. In DHM, this problem is mitigated simply by rotating the sample.
Nguyen-Viet et al. ~2008! evaluated TA biovolumes by assuming they are of regular geometrical shapes. Obviously, this methodology enables fast volume measurements at the expense of accuracy.
C
ONCLUSIONThe present study highlights the advantages and limitations of various specialized microscopic imaging modalities, as applied to testate amoeba morphology. The CLSM and TPEM data are the first of its kind obtained in testate amoebae. Jointly with associated 3D reconstructions and stereological analyses, the multimodal imaging is of potential interest, e.g., in taxonomy, ecophysiology, or ecotoxicology.
A
CKNOWLEDGMENTSThe authors are grateful to Prof. Jaromír Plásˇek ~Charles University in Prague! and Dr. Martin Vohník ~Institute
of Botany! for providing some of the fluorescence probes, and to Mr. Jan Klepetárˇ ~Institue of Physiology! and Mr. Zdeneˇk Sˇvindrych ~Charles University in Prague! for a fruitful discussion. The presented study was supported by the Academy of Sciences of the Czech Republic ~Grants No. AV0Z50110509 and No. AV0Z60050516!, Ministry of Edu-cation, Youth, and Sports of the Czech Republic ~research programs LC06063 and MSM6840770012!, Czech Science Foundation ~Grant No. 102/08/069!, and the Swiss National Science Foundation ~Grants No. 205321-109709/1 and No. 205321-109709/2!.
R
EFER ENCESAoki, Y., Hoshino, M. & Matsubara, T. ~2007!. Silica and testate amoebae in a soil under pine-oak forest. Geoderma 142, 29–35.
Bernhard, J.M. ~2000!. Distinguishing live from dead foraminif-era: Methods review and proper applications.
Micropaleontol-ogy 46~S1!, 38–46.
Bernhard, J.M., Blanks, J.K., Hintz, Ch.J. & Chandler, G.T. ~2004!. Use of the fluorescent calcite marker calcein to label foraminiferal tests. J Foraminiferal Res 34, 96–101.
Beyens, L. & Meisterfeld, R. ~2001!. Protozoa: Testate amoebae. In Tracking Environmental Change Using Lake Sediments:
Vol-ume 3: Terrestrial, Algal, and Siliceous Indicators, Smol, J.P.,
Birks, H.J.B. & Last, W.M. ~Eds.!, pp. 121–153. Dordrecht, Netherlands: Kluwer Academic Publishers.
Booth, R.K. ~2002!. Testate amoebae as paleoindicators of surface-moisture changes on Michigan peatlands: Modern ecology and hydrological calibration. J Paleolimn 28, 329–348.
Cˇ apek, M., Bru˚zˇa, P., Janácˇek, J., Karen, P., Kubínová, L. & Vágnerová, R. ~2009!. Volume reconstruction of large tissue specimens from serial physical sections using confocal micros-copy and correction of cutting deformations by elastic registra-tion. Microsc Res Tech 72, 110–119.
Cˇ apek, M., Janácˇek, J. & Kubínová, L. ~2006!. Methods for compensation of the light attenuation with depth of images captured by a confocal microscope. Microsc Res Tech 69, 624–635. Charrière, F., Pavillon, N., Colomb, T., Depeursinge, Ch., Heger, T.J., Mitchell, E.A.D, Marquet, P. & Rappaz, B. ~2006!. Living specimen tomography by digital holographic microscopy: Morfometry of testate amoeba. Opt Express 14, 7005–7013.
Cruz-Orive, L.M. ~1997!. Stereology of single objects. J Microsc
(Oxford, U.K.) 186, 93–107.
Denk, W., Strickler, J.H. & Webb, W.W. ~1990!. Two-photon laser scanning fluorescence microscopy. Science 248, 73–76. Diaspro, A. ~2002!. Confocal and Two-Photon Microscopy:
Founda-tions, ApplicaFounda-tions, and Advances. New York: Wiley-Liss.
Difato, F., Mazzone, F., Scaglione, S., Fato, M., Beltrame, F., Kubínová, L., Janácˇek, J., Ramoino, P., Vicidomini, G. & Diaspro, A. ~2004!. Improvement in volume estimation from confocal sections after image deconvolution. Microsc Res Tech
64, 151–155.
Foissner, W. ~1997!. Protozoa as bioindicators in agroecosystems, with emphasis on farming practices, biocides, and biodiversity.
Foissner, W. ~1999!. Soil protozoa as bioindicators: Pros and cons, methods, diversity, representative examples. Agric Ecosyst
Envi-ron 74, 95–112.
Gilbert, D., Amblard, C., Boudier, G. & Frances, A.J. ~1998!. The microbial loop at the surface of a peatland: Structure, function and impact of nutrient input. Microb Ecol 35, 83–93. González-Robles, A., Castañón, G., Hernández-Ramírez,
V.I., Salazar-Villatoro, L., González-Lázaro, M., Omaña-Molina, M., Talamás-Rohana, P. & Martínez-Palomo, A. ~2008!. Acanthamoeba castellanii: Identification and distribu-tion of actin cytoskeleton. Exp Parasitol 119, 411–417. Heger, T.J., Mitchell, E.A.D., Todorov, M., Golemansky, V.,
Lara, E. & Pawlowski, J. ~2010!. Molecular phylogeny of euglyphid testate amoebae ~Cercozoa: Euglyphida! suggest tran-sitions between marine supralittoral and freshwater/terrestrial environments are infrequent. Mol Phylogenet Evol 55, 113–122. King, M.A. ~2000!. Detection of dead cells and measurement of cell killing by flow cytometry. J Immunol Methods 234, 155–166. Kubínová, L. & Janácˇek, J. ~1998!. Estimating surface area by the isotropic fakir method from thick slices cut in an arbitrary direction. J Microsc (Oxford, U.K.) 191, 201–211.
Kubínová, L. & Janácˇek, J. ~2001!. Confocal microscopy and stereology: Estimating volume, number, surface area and length by virtual test probes applied to three-dimensional images.
Microsc Res Tech 53, 425–435.
Kubínová, L., Janácˇek, J. & Krekule, I. ~2002!. Stereological methods for estimating geometrical parameters of microscopic structure by three dimensional imaging. In Confocal and Two
Photon Microscopy: Foundations, Applications, and Advances,
Diaspro, A. ~Ed.!, pp. 299–332. New York: Wiley-Liss.
Lutze, G.F. & Altenbach, A.V. ~1991!. Technik und Signifikanz der Lebenfärbung der benthischer Foraminiferen mit Bengal-rot. Geol Jahr A128, 251–265 ~with English abstract!.
Madrid, R.E. & Felice, C.J. ~2005!. Microbial biomass estimation.
Crit Rev Biotechnol 25, 97–112.
Martin, R.E. & Steinker, D.C. ~1973!. Evaluation of techniques for recognition of living foraminifera. Compass Sigma Gamma
Epsilon 50, 26–30.
Matsumoto, B. ~2002!. Cell Biological Applications of Confocal
Microscopy. San Diego, CA: Academic Press.
Meisterfeld, R. ~2002a!. Order Arcellinida Kent, 1880. In An
Illustrated Guide to the Protozoa, 2nd ed., Lee, J.J., Leedale, G.F.
& Bradbury, P. ~Eds.!, vol. 2, pp. 827–860. Lawrence, KS: Society of Protozoologists.
Meisterfeld, R. ~2002b!. Testate amoebae with filopodia. In An
Illustrated Guide to the Protozoa, 2nd ed., Lee, J.J., Leedale, G.F.
& Bradbury, P. ~Eds.!, vol. 2, pp. 1054–1084. Lawrence, KS: Society of Protozoologists.
Michels, J. & Schnack-Schiel, S.B. ~2005!. Feeding in dominant Antarctic copepods—Does the morphology of the mandibular gnathobases relate to diet? Mar Biol (Heidelberg, Ger.) 146, 483–495.
Mitchell, E.A.D., Charman, D.J. & Warner, B.G. ~2008a!. Testate amoebae analysis in ecological and paleoecological studies of wetlands: Past, present and future. Biodiver Conserv
17, 2115–2137.
Mitchell, E.A.D. & Gilbert, D. ~2010!. Present status of testate amoeba research, knowledge gaps and research priorities.
Meet-ing Report: 5th International Symposium on Testate Amoebae
(ISTA-5), Montbéliard, France, September 14–17, 2009. Protist 161, 337–341.
Mitchell, E.A.D., Gilbert, D., Buttler, A., Amblard, C., Gros-vernier, P. & Gobat, J.M. ~2003!. Structure of microbial communities in Sphagnum peatlands and effect of atmospheric carbon dioxide enrichment. Microb Ecol 46, 187–199.
Mitchell, E.A.D., Payne, R.J. & Lamentowicz, M. ~2008b!. Potential implications of differential preservation of testate amoeba shells for paleoenvironmental reconstruction in peat-lands. J Paleolimn 40, 603–618.
Murphy, D.B. ~2001!. Fundamentals of Light Microscopy and
Elec-tronic Imaging. New-York: Wiley-Liss.
Nguyen-Viet, H., Bernard, N., Mitchell, E.A.D., Badot, P.M. & Gilbert, D. ~2008!. Effect of lead pollution on testate amoebae communities living in Sphagnum fallax: An experimen-tal study. Ecotoxicol Environ Safe 69, 130–138.
Ogden, C.G. & Hedley, R.H. ~1980!. An Atlas of Freshwater Testate
Amoebae. New-York: Oxford University Press.
Patterson, R.T., Barker, T. & Burbidge, S.M. ~1996!. Arcel-laceans ~thecamoebians! as proxies of arsenic and mercury contamination in northeastern Ontario lakes. J Foraminiferal
Res 26, 172–183.
Patterson, R.T., Dalby, A., Kumar, A., Henderson, L.A. & Bou-dreau, R.E.A. ~2002!. Arcellaceans ~thecamoebians! as indicators of land-use change: Settlement history of the Swan Lake area, Ontario as a case study. J Paleolimn 28, 297–316. Pawley, J.B. ~2006!. Handbook of Biological Confocal Microscopy.
New York: Springer.
Raffray, M. & Cohen, G.M. ~1997!. Apoptosis and necrosis in toxicology: A continuum or district modes of cell death?
Phar-macol Ther 75, 153–177.
Schönborn, W. ~1983!. Relationships between production, mortal-ity and abundance in Testacean ~Protozoa! communities in soil.
Pedobiologia 25, 403–412.
Schönborn, W. ~1992!. The role of protozoan communities in freshwater and soil ecosystems. Acta Protozool 31, 11–18. Schröter, D., Wolters, V. & De Ruiter, P.C. ~2003!. C and N
mineralisation in the decomposer food webs of a European forest transect. Oikos 102, 294–308.
Todorov, M., Golemanski, V., Mitchell, E.A.D. & Heger, T.J. ~2009!. Morphology, biometry, and taxonomy of freshwater and marine interstitial Cyphoderia ~Cercozoa: Euglyphida!. J
Eukaryotic Microbiol 56, 279–289.
Vohník, M., Burdíková, Z., Albrechtová, J. & Vosátka, M. ~2009!. Testate amoebae ~Arcellinida and Euglyphida! vs. eri-coid mycorrhizal and DSE fungi: A possible novel interaction in the mycorrhizosphere of Ericaceous plants? Microb Ecol 57, 203–214.
Walton, W.R. ~1952!. Techniques for recognition of living foram-inifera. Contributions from the Cushman Foundation for
Foram-iniferal Research 3, 56–60.
Wanner, M. ~1999!. A review on the variability of testate amoe-bae: Methodological approaches, environmental influences and taxonomical implications. Acta Protozool 38, 15–29.
Weibel, E.R. (1979). Stereological Methods, Vol. 1: Practical Methods
for Biological Morphometry. London: Academic Press.
Wilkinson, D.M. ~2008!. Testate amoebae and nutrient cycling: Peering into the black box of soil ecology. Trends Ecol Evol 23, 596–599.