DOI 10.1515/hf-2013-0183 Holzforschung 2014; 68(6): 727–730
Short Note
Mark Schubert*, Chris Stührk, Matthias J. Fuhr and Francis W.M.R. Schwarze
Imaging hyphal growth of Physisporinus vitreus
in Norway spruce wood by means of confocal laser
scanning microscopy (CLSM)
Abstract: Light microscopy and electron microscopy are
the most common methods for analyzing wood-decay
fungi. However, the 3D visualization and quantification
of the filamentous structure of fungi in wood is difficult
to realize by means of these traditional techniques. In the
present work, confocal laser scanning microscopy (CLSM)
was further developed for the quantitative imaging of the
3D microscopic hyphal growth of Physisporinus vitreus, a
versatile fungus for engineering value-added wood
prod-ucts. To this purpose, the fungus was stained with a
fluo-rescent dye Alexa Fluor. The 3D information obtained by
CLSM has a high potential as a basis for the development
of mathematical models for a more precise observation of
the growth behavior of wood-decay fungi.
Keywords: confocal laser scanning microscopy,
filamen-tous mycelium, fluorescence dye, hyphal growth indices,
Physisporinus vitreus
*Corresponding author: Dr. Mark Schubert, Empa, Swiss Federal Laboratories for Materials Science and Technology, Laboratory for Applied Wood Materials, Lerchenfeldstrasse 5, CH-9014 St. Gallen, Switzerland, e-mail: mark.schubert@empa.ch
Chris Stührk and Francis W.M.R. Schwarze: Empa, Swiss Federal Laboratories for Materials Science and Technology, Laboratory for Applied Wood Materials, Lerchenfeldstrasse 5, CH-9014 St. Gallen, Switzerland
Matthias J. Fuhr: ETH Zurich, Institute for Building
Materials, Computational Physics for Engineering Materials, Schafmattstrasse 6, HIF E18, CH-8093 Zurich, Switzerland
Introduction
Physisporinus vitreus is a selective white-rot fungus
that degrades mainly bordered pit membranes without
causing significant wood strength losses. A treatment
with P. vitreus enhances the uptake of preservatives
and other modification substances in refractory wood
species (“bioincising”) (Schwarze and Landmesser 2000;
Lehringer et al. 2011a,b; Schwarze and Schubert 2011;
Schwarze et al. 2006). A fungal growth model was
develo-ped for P. vitreus for an optimized engineering strategy
(Fuhr et al. 2011). Mathematical modeling in this context is
very helpful. To this purpose, qualitative and quantitative
data concerning the 3D hyphal growth within the wood
are required. Light microscopy and electron microscopy
in combination with specific staining techniques are very
useful (Schwarze 2007), but they provide limited
infor-mation for the development of 3D images. Confocal laser
scanning microscopy (CLSM) allows the imaging of
micro-organisms in a 3D environment and opens new avenues
in biological science. For instance, it has been applied
in various areas of wood research (Kim and Singh 1999;
Speranza et al. 2009; Taguchi et al. 2010).
A seldom-applied opportunity is to visualize fungal
hyphae by CLSM. As wood is transparent for CLSM up to
200 μm (Mannes et al. 2009), the visualization of
individ-ual hyphae is possible, but preferably the fungus should
be stained by a fluorescent dye (Xiao et al. 1999, 2000).
The purpose of the present work is the development of a
CLSM-based quantitative analysis of the 3D filamentous
growth of P. vitreus in Norway spruce wood by application
of a fluorescent compound.
Materials and methods
Specimens were obtained from the heartwood of living 40- to 50-year-old Norway spruce trees (Picea abies L. Karst.). Their respec-tive dimensions were 10 × 1–2 × 1–2 mm3 (l × t × r). The side in focus of the
specimen was left free and the other sides were sealed with a topcoat (Nuvovern ACR Emaillack, Walter Mäder AG, Killwangen, Switzer-land) by brushing. After 24 h, this procedure was repeated to ensure a complete sealing. Before incubation with P. vitreus, wood specimens were sterilized at 121°C, 20 min, and 2 bar vapor pressure.
Physisporinus vitreus Empa strain 642 was precultivated in 9 cm Petri dishes on 2% malt-extract agar (MEA) for 1 week at 22°C and 70% relative humidity (RH). Wood specimens were placed on the
728
M. Schubert et al.: CLSM imaging of P. vitreus growth colonized Petri dishes sealed with parafilm and incubated at 22°C and 70% RH. After the incubation time (from 1 week up to 2 months), thin sections (10 × 3 × 0.3 mm3) were processed from the specimens with a
sledge microtome (Bauknecht, Germany). For labeling the hyphae, the sections were stained for 10 to 15 min with the fluorescence dye Alexa Fluor (2.5-5 μg ml-1 distilled H
2O2) conjugated with wheat germ
agglutinin (WGA) (Lubio Science, Switzerland). The analysis of the sections was carried out at the Light Microscopy Centre (ETH Höng-gerberg, Zurich, Switzerland) with a CLSM (Leica SP2-AOBS). Excita-tion occurred simultaneously at a wavelength of 405 nm (UV-diode laser at 25%) for wood autofluorescence and 633 nm (HeNe laser at 75%) for Alexa Fluor fluorescence. The distinct fluorescence of wood at approximately 400 nm and Alexa Fluor at approximately 630 nm enables the separation of the signal into two channels. Thus, an indi-vidual TIFF image for each radius of interest (ROI) for wood and the fungus is recorded. The pixels of such a grayscale image represent the fluorescence intensity of a material (i.e., wood, fungus, or air).
The grayscale image is transformed to a binary image (image of pixels with two possible values of 0 = air or 1 = material) by means of “thresholding.” Each grayscale pixel is allocated to a specific thresh-old, which is low intensity (no material) or high intensity (pixel “occupied” by material). Based on such a binary image, quantita-tive analysis can be performed, that is, the mycelium density can be calculated by counting the number of “occupied” pixels in a defined area.
Objective magnification was 10-fold. Voxel size was 1.4648 × 1.4648 × 1.7910 μm with overall 1024 × 1024 pixels. 3D optical sections (tomograms) with x-y plane of approximately 2 mm2 and
thickness (z-plane) of approximately 150 μm were generated ( Claxton et al. 2005). Stacks of optical sections were stitched by XuvTools (Emmenlauer et al. 2009) and further processed with Imaris V 7.0 (Bitplane, Scientific Software, Switzerland) for virtual reality imag-ing, which rendered hyphal structures (Xiao et al. 1999, 2000).
Results and discussion
The CLSM images are clear and the filamentous mycelia
of P. vitreus could be distinguished, segmented, and
ana-lyzed (Figure 1). The prerequisites for high-quality images
with fully resolved structures at the submicron level are
blur-free basic images with high signal-to-noise ratio (S/N
ratio; which means high fluorescent signals compared to
the noise from the surrounding background). Stitching
(co-adding) of several optical sections increases the
com-puting time strongly. Furthermore, it may lead to faults,
which influence the analysis negatively. Nevertheless,
the stitching of the optical sections with XuvTools
( Emmenlauer et al. 2009) turned out to be useful to
analyze wood sections not only at the microscopic but
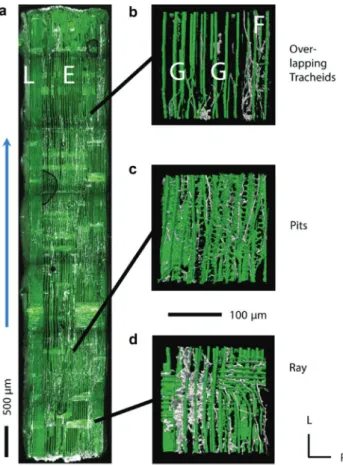
also at the mesoscopic scale (Figure 2). P. vitreus shows a
dendritic filamentous growth pattern with a single hyphal
mean diameter of approximately 2 μm. Generally, there
is much higher fungal activity in earlywood and
transi-tion wood than in latewood with regard to the amount of
mycelium (density allocation), growth front, and number
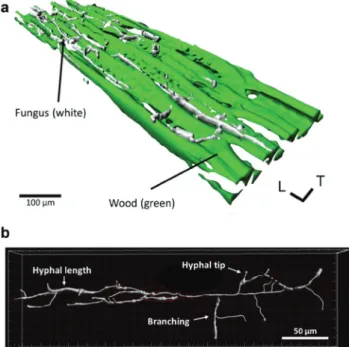
Figure 1 (a) CLSM image of a transverse section of Norway spruce heartwood (green) colonized by hyphae (white) of P. vitreus. Hyphae are stained with Alexa Fluor 633+WGA. Wood shows autofluores-cence at approximately 405 nm and is transparent for CLSM up to a range of 200 μm. Wood and hyphae are visualized and rendered via isosurfaces. (b) Segmentation of the hyphal structure of P. vitreus in wood. The principle directions of wood are usually termed as longitudinal, radial, and tangential. L, longitudinal direction; T, tangential direction.
of degraded pits membranes (Figure 3). With CLSM, the
following hyphal growth indices could be analyzed and
quantified: hyphae diameter, hyphal length, branching,
tips, biomass of the mycelium, density allocation of the
mycelium, and the hyphal growth unit (HGU). The HGU
is the ratio between the total length of mycelium and
the total number of tips (Plomley 1958). At this point,
one should mention that the outcome of the analysis of
the HGU might be influenced by the adjustments of the
software (e.g., point spread function) and the chosen
thresholds. Although the quantification might be only an
approximation, these data are valuable information of
hyphal growth in wood and enhance the knowledge about
underlying processes of fungi-wood interactions. Results
from the visualization can be directly incorporated into a
mathematical growth model (Fuhr et al. 2011).
The advantages of confocal microscopy include the
ability to control depth of field, elimination or reduction
of background information from layers above and below
the focal plane (which leads to image distortion), and
par-ticularly the capability to collect serial optical sections
from thick specimens (Claxton et al., 2005). CLSM requires
M. Schubert et al.: CLSM imaging of P. vitreus growth
729
staining of the microorganisms with fluorescent stains. In
the present work, the labeling of the hyphae with Alexa
Fluor 633+WGA enabled easy visualization of the fungal
hyphae and good contrast of the filamentous mycelia to
the wood autofluorescence.
Cell wall damages were not clearly visible with the
CLSM because of the weak autofluorescence of wood.
Therefore, to combine the fungal growth with its impact
on the cell wall structure, Fuhr et al. (2012) developed
a computer-based method for the quantification of the
impact of the wood-decay fungus P. vitreus by means of
high-resolution X-ray computed tomographic microscopy.
Based on these quantitative data, the use of P. vitreus can
be optimized by linking the microscopic growth behavior
with macroscopic wood properties.
Figure 2 (a) Hyphal colonization of the white-rot fungus P. vitreus (white) into a longitudinal-tangential section of Norway spruce heartwood (green) visualized by CLSM (blue arrow indicates the direction from which wood samples were colonized). The terms E and L denote earlywood and latewood. (b)–(d) An overlapping region, hyphal activity at the pits, and a xylem ray, respectively. The terms F and G denote blocked and growing leading hyphae, respec-tively. L, longitudinal direction; R, radial direction.
16
c
b
a
× 105 14 T R 12 10Sum of gray values
(-) 8 6 4 2 0 200 400 600
Distance in radial direction (pixels)
800 1000
Figure 3 Density allocation of the mycelium of P. vitreus in Norway spruce heartwood.
The blue arrow indicates the direction from which wood samples were colonized. (a) Overlapping of the two CLSM channels, that is, mycelium (white; excitation at 405 nm) and wood (green; excitation at 633 nm). (b) Segmentation of the mycelium (white; excitation at 405 nm) using a threshold (i.e., a pixel is occupied by fungus if its gray values is above a specific threshold). (c) Quanti-fication of the density allocation by adding up the gray values of each pixel in tangential and longitudinal direction. R, radial direc-tion; T, tangential direction.
730
M. Schubert et al.: CLSM imaging of P. vitreus growth
Conclusions
The application of the CLSM provides 3D images of the
fil-amentous mycelium of P. vitreus in Norway spruce wood.
Relevant hyphal growth indices can be quantified by this
method. The method is also suited for live-cell imaging
and time-lapse experiments in the course of wood
coloni-zation and degradation by fungi.
Acknowledgments: The authors gratefully acknowledge
J. Hehl (ETH Light Microscopy Center) for helpful
discus-sions on image processing and express their gratitude to
the Swiss National Science Foundation (SNF No.
205321-121701) for its financial support.
Received September 18, 2013; accepted November 29, 2013
References
Claxton, N.S., Fellers, T.J., Davidson, M.W. Laser Scanning Confocal Microscopy. Department of Optical Microscopy and Digital Imaging, National High Magnetic Field Laboratory, Florida State University, 2005, p. 37. Available at: http://www.olympus-fluoview.com/theory/LSCMIntro.pdf.
Emmenlauer, M., Ronneberger, O., Ponti, A., Schwarb, P., Griffa, A., Filippi, A., Nitschke, R., Driever, W., Burkhardt, H. (2009) XuvTools: free, fast and reliable stitching of large 3D datasets. J. Microsc. 233:42–60.
Fuhr, M.J., Schubert, M., Schwarze, F.W.M.R., Herrmann, H.J. (2011) Modelling the hyphal growth of the wood-decay fungus Physisporinus vitreus. Fungal Biol. 115:919–932.
Fuhr, M.J, Stührk, C., Münch, B., Schwarze, F., Schubert, M. (2012) Automated quantification of the impact of the wood-decay fungus Physisporinus vitreus on the cell wall structure of Norway spruce by tomographic microscopy. Wood Sci. Technol. 46:769–779. Kim, Y.S., Singh, A.P. (1999) Micromorphological characteristics of
compression wood degradation in waterlogged archaeological pine wood. Holzforschung 53:381–385.
Lehringer, C., Koch, G., Adusumalli, R.-B., Mook, W.M., Richter, K., Militz, H. (2011a) Effect of Physisporinus vitreus on wood properties of Norway spruce. Part 1: aspects of delignification and surface hardness. Holzforschung 65:711–719.
Lehringer, C., Saake, B., Živković, V., Richter, K., Militz, H. (2011b) Effect of Physisporinus vitreus on wood properties of Norway spruce. Part 2: aspects of microtensile strength and chemical changes. Holzforschung 65:721–727.
Mannes, D., Marone, F., Lehmann, E., Stampanoni, M., Niemz, P. (2009) Application areas of synchrotron radiation tomographic microscopy for wood research. Wood Sci. Technol. 44:67–84.
Plomley, N.J.B. (1958) Formation of the colony in the fungus Chaetomium. Aust. J. Biol. Sci. 12:53–64.
Schwarze, F.W.M.R. (2007) Wood decay under the microscope. Fungal Biol. Rev. 21:133–170.
Schwarze, F.W.M.R., Landmesser, H. (2000) Preferential degradation of pit membranes within tracheids by the basidiomycete Physisporinus vitreus. Holzforschung 54:461–462.
Schwarze, F., Schubert, M. (2011) Physisporinus vitreus: a versatile white rot fungus for engineering value-added wood products. Appl. Microbiol. Biotechnol. 92:431–440.
Schwarze, F.W.M.R., Landmesser, H., Zgraggen, B., Heeb, M. (2006) Permeability changes in heartwood of Picea abies and Abies alba induced by incubation with Physisporinus vitreus. Holzforschung 60:450–454.
Speranza, M., Gutiérrez, A., del Río, J.C., Bettucci, L., Martínez, À.T., Martínez, M.J. (2009) Sterols and lignin in Eucalyptus globulus Labill. wood: spatial distribution and fungal removal as revealed by microscopy and chemical analyses. Holzforschung 63:362–370.
Taguchi, A., Murata, K., Nakano, T. (2010) Observation of cell shapes in wood cross-sections during water adsorption by confocal laser-scanning microscopy (CLSM). Holzforschung 64:627–631.
Xiao, Y., Kreber, B., Breuil, C. (1999) Localisation of fungal hyphae in wood using immunofluorescence labelling and confocal laser scanning microscopy. Int. Biodeter. Biodegr. 44:185–190. Xiao, Y., Wakeling, R.N., Singh, A.P. (2000) Use of confocal
microscopy in examining fungi and bacteria in wood. Biofouling 15:231–239.