Tmprss3 loss of function impairs cochlear inner
hair cell Kcnma1 channel membrane expression
Laurence Molina
1,{, Lydie Fasquelle
2,3,{, Re´gis Nouvian
2,3, Nicolas Salvetat
1, Hamish S. Scott
4,5,
Michel Guipponi
6, Franck Molina
1, Jean-Luc Puel
2,3and Benjamin Delprat
2,3,∗1
SysDiag UMR 3145 CNRS/Bio-Rad, Cap Delta/Parc Eurome´decine, 1682 rue de la Valsie`re, CS 61003, Cedex 4, Montpellier 34184, France,2Inserm U 1051, Institut des Neurosciences de Montpellier, Hoˆpital Saint Eloi, Montpellier 34091, France, 3Universite´ de Montpellier, Montpellier 34091, France,4Department of Molecular Pathology,
The Centre for Cancer Biology, SA Pathology and Box 14 Rundle Mall Post Office, Adelaide, South Australia 5000, Australia,5The Schools of Medicine and Molecular and Biomedical Science, The University of Adelaide, Adeliade, South Australia 5005, Australia and6Department of Genetic Medicine and Development, University of Geneva Medical School and University Hospitals of Geneva, 4 Geneva 1211, Switzerland
Received October 25, 2012; Revised and Accepted December 12, 2012
Before acquiring their mature state, cochlear hair cells undergo a series of changes in expression of ion channels. How this complex mechanism is achieved is not fully understood. Tmprss3, a type II serine prote-ase expressed in hair cells, is required for their proper functioning at the onset of hearing. To unravel the role of Tmprss3 in the acquisition of mature K1currents, we compared their function by patch-clamp technique in wild-type Tmprss3WTand Tmprss3Y260X-mutant mice. Interestingly, only outward K1currents were altered in Tmprss3Y260X-mutant mice. To determine by which mechanism this occurred, we compared the protein net-work of Tmprss3WTand Tmprss3Y260X-mutant mice using proteomic analysis. This led to the identification of a pathway related to potassium Kcnma1 channels. This pathway was validated by immunohistochemistry, fo-cusing on the most downregulated protein that was identified as a cochlear Kcnma1-associated protein, APOA1. Finally, we show that, in contrast to Tmprss3WT, Kcnma1 channels were absent at the neck of inner hair cells (IHCs) in Tmprss3Y260X-mutant mice. In conclusion, our data suggest that lack of Tmprss3 leads to a decrease in Kcnma1 potassium channels expression in (IHCs).
INTRODUCTION
The perception of sound relies on the proper functioning of the cochlea, the peripheral auditory organ. In mammalian cochlea, inner hair cells (IHCs) translate sound stimulation into graded receptor potentials. At the onset of hearing (P10-P12 in mice), IHCs undergo massive changes in their electrical properties (1,2), and notably, the maturation of hair cells correlates with the expression of large outward-rectifying potassium cur-rents, IK,f, carried by Kcnma1 channels (3). The fast activation kinetics of these channels shape the time course and amplitude of the hair cell receptor potential (4), indicating that Kcnma1 channels in hair cells are critical for high-fidelity sound encod-ing. At the same time IK,ncurrent is expressed to set the resting
potential of IHCs (5,6). This current is generated by KCNQ4 whose mutations are responsible for DFNA2 human deafness (7). Finally, a classical delayed-rectifier K+current, name IK,s shows slow activation kinetics and represents the slow compo-nent of the K+outward current (3).
Mutations in the TMPRSS3 gene were shown to cause human autosomal recessive non-syndromic deafness (DFNB8/10) (8), characterized by bilateral, severe to profound hearing loss. To address the role of the protein in the cochlear physiology, we generated an ethylnitrosurea (ENU) C3HeB/FeJ-mutant mouse (9). A T to A substitution in exon 7, resulting in a non-sense mutation at tyrosine 260 was identified (Tmprss3Y260X) that would result in the production of a 194 amino acid trun-cated protein, deleted of most of its protease domain (9).
†
These authors contributed equally to this work.
∗To whom correspondence should be addressed at: Inserm U1051, 80 rue Augustin Fliche, Montpellier 34091, France. Tel: +33 499636061;
Fax:+33 499636020; Email: [email protected]
#The Author 2012. Published by Oxford University Press. All rights reserved. For Permissions, please email: [email protected]
The analysis of the Tmprss3Y260X-mutant mice revealed that Tmprss3 is essential for mouse cochlear hair cell survival at the onset of hearing and that Tmprss3 mutations induce deaf-ness in mice (9) and in humans. Indeed, in the Tmprss3Y260X -mutant mice, hair cells degenerate drastically in 2 days (between P12 and P14). Thus, Tmprss3 is expressed in coch-lear hair cells in the developing cochlea and at the onset of hearing, suggesting that Tmprss3 may be a hair cell-autonomous survival factor (9). We also identified a novel, longer Tmprss3 isoform with a 22 amino acid extension at the N-terminal, namely Tmprss3f. This isoform is expressed predominantly in the cochlea in contrast to the shorter isoform that is expressed broadly, suggesting a specific role of Tmprss3f in hair cell functioning and/or survival (9). Finally, the only known substrate of TMPRSS3 that was observed in Xenopus oocytes (10) is the epithelial amiloride-sensitive sodium channel (ENaC).
Because IHC maturation is dependent on a change in ionic conductance expression, and given that Tmprss3 is known to activate ENaC channels in Xenopus oocytes, we would like to determine whether Tmprss3 was able to modulate the func-tion of channels or channel regulatory proteins in IHCs. Using an integrated approach combining the patch-clamp technique, two-dimensional (2D) gels followed by mass spectrometry analysis, bioinformatic functional studies and immunohisto-chemistry, we showed, for the first time, that Tmprss3 loss of function leads to a decrease in the IHCs’ Kcnma1 channel plasma membrane expression. These alterations were associated with the downregulation of ApoA1 in IHCs, which is a protein identified as a Kcnma1 channel interacting partner expressed in IHCs (11).
Our data highlight a novel link between Kcnma1 channels and a serine protease. This unique finding suggests that this original relationship seems highly important for the normal physiology of IHCs and it should be significant for other es-sential body functions, where Kcnma1 channels play a key role, such as neurotransmission (12), blood flow (13), urine flow (14) and immunity (15).
RESULTS
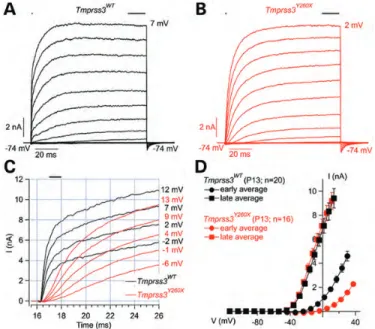
Lack of fast K1conductance in Tmprss3Y260Xmouse IHCs Because ENaC, the only known substrate of Tmprss3, is not expressed in cochlear hair cells (16–18), whole-cell patch-clamp recordings were used to probe the K+ current in P13-old apical IHCs before degenerative changes occurred in this region of the cochlea (9). When depolarized, IHCs from Tmprss3WTshowed an outward K+current with a fast activating outward component, reminiscent of Kcnma1 currents (3,4,19) and a more slowly activating component (Fig.1A). IHCs from Tmprss3Y260X showed a drastic reduction in the amplitude of the outward currents when measured 1 ms after the start of the depolarizing pulses (mostly recruiting Kcnma1 channels activa-tion; 4.6 + 0.4 nA at 30 and 2.27 + 0.15 nA at 37 mV in Tmprss3WTand Tmprss3Y260X, respectively,Fig.1B – D). In con-trast, the magnitudes of the currents at the end of the depolariz-ing pulses were comparable between the genotypes (Fig.1D). The difference of K+ outward current observed between the Tmprss3WTand Tmprss3Y260Xcould be explained by a delayed
maturation. However, exocytosis triggered by Ca2+ currents was similar between Tmprss3WT and Tmprss3Y260X in P9-P11-old IHCs (Data not shown), suggesting normal hair cell de-velopment (20). Current-clamp recordings (Iinj¼ 0 pA) indicated no difference in the resting membrane potential of the IHCs between both genotypes (269.4 + 1.3 mV and 267.9 + 2.1 mV for Tmprss3WTand Tmprss3Y260XIHCs, respectively).
Differential proteomics
To identify proteins that could regulate the expression of IHC K+ channels and that are linked to Tmprss3, P10 mouse cochlea extracts from Tmprss3WTand Tmprss3Y260Xwere ana-lyzed by a proteomic approach using 2D-gel electrophoresis (2D-GE). We chose P10 because it represents a good com-promise between the presumed absence of the apoptosis-related proteins that may be present in cochlear extracts at P12 due to the beginning of hair cell degeneration, and the presence of mature K+currents that begin to appear at P10. After image analysis, more than 2000 spots were detected from cochlea extracts with a wide range of molecular weights (15 – 150 kDa) and isoelectric points (3 – 10 pI). To compare the Tmprss3WTand Tmprss3Y260X proteomes, it was
Figure 1. IHCs K+current analysis of Tmprss3WTand Tmprss3Y260Xmice. (A and B) Representative outward currents recorded from P13 Tmprss3WT (A, black) and Tmprss3Y260X (B, red) IHCs. K+ currents were evoked by 100 ms long-step depolarizations from 2114 mV to the indicated potentials (voltage increments of 10 mV, holding potential of 274 mV). (C) First 10 ms of these outward currents recordings on an expanded time scale. Tmprss3WT (black) and Tmprss3Y260X (red). (D) Mean I/V relationships for Tmprss3WT(black) and Tmprss3Y260X(red) IHCs obtained by averaging cur-rents 1 ms after the start of the depolarizing pulses over 1 ms (filled circles, early average) and over the last 15 ms of depolarization steps (filled squares, late average). The mean series resistance of Tmprss3WT (black) and Tmprss3Y260X(red) IHCs was 3.4 + 0.1 MV and 3.8 + 0.1 MV, respectively, after Rs compensation, and data were corrected offline for the remaining voltage error and liquid junction potential (24 mV). Resting membrane capaci-tance of Tmprss3WT(black) and Tmprss3Y260X(red) was 9.4 + 0.1 pF and 8.1 + 0.2 pF, respectively (n ¼ 20 for Tmprss3WT, n ¼ 16 for Tmprss3Y260X). The dif-ference is statistically significant (two sample t-test, P , 0.05).
important to firstly assess the consistency of our dataset after 2D-GE separation. To this end, we used a dispersion tree ap-proach (20), and the 10 2D-GE experiments were dispersed homogeneously on the 10 branches of the tree, which formed a circle (Supplementary Material, Fig. S1A). The homogeneity of the data was also confirmed by three other
statistical methods: the Mahalanobis distance, principal component analysis and Pearson correlation (Supplementary Material, Fig. S1B – D).
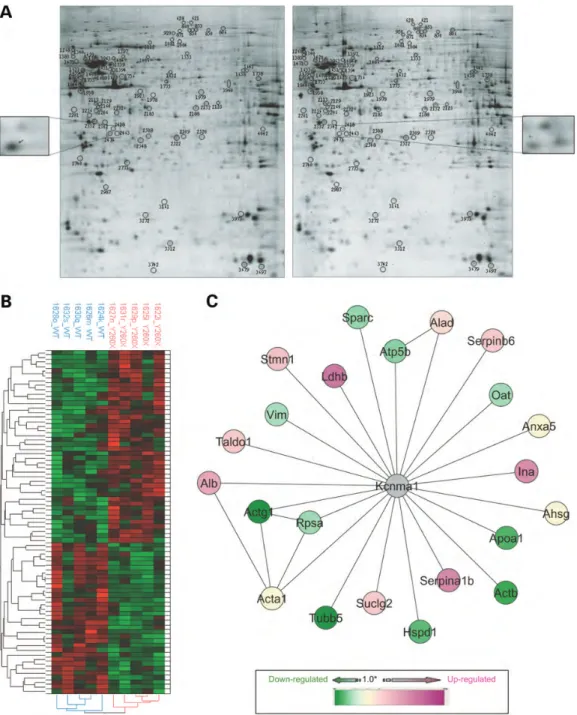
In the comparative analysis of all protein spots between Tmprss3WT and Tmprss3Y260X, 77 distinct protein spots were differentially expressed (Fig. 2A). To visualize these protein
Figure 2. Proteomic analysis and altered pathway in Tmprss3Y260X-mutant mice. (A) 2D-GE of proteins extracted from Tmprss3WTcochleae (left gel) and Tmprss3Y260Xcochleae (right gel). Seventy-seven protein spots were differentially expressed, and protein spots were up or downregulated (example of spot regu-lation in the side inset). The proteins of interest identified by LC-MS/MS are shown on the gels by a circle. (B) Heat map and HAC of the 77 protein spots present in all cochlea 2D-GE. The intensity levels of the protein spots p were visualized by a heat map and HAC analysis using the JMP v8 software. Each column represents the data from one 2D-GE experiment. Rows represent individual spots. Raw data were mean centered, and the graduated scale color codes from green (low level of intensity) to red (high level of intensity). (C) Network of identified proteins connected to Kcnma1. Nodes and edges are represented by gray circles and black lines, respectively. Identified proteins differentially expressed between Tmprss3WTand Tmprss3Y260Xwere highlighted using a graduated scale from green (downregulated) to pink (upregulated) according to their fold ratio. Proteins that were both up and downregulated in different protein spots were represented by a ratio of 1 (yellow). Some edges may represent a set of different PPIs found in the database. View of the merged network imported from Cytoscape using the IntAct and BioGRID databases.
spots further, we clustered the high-confidence dataset of 77 proteins spots. The dataset was then subjected to hierarchical clustering analysis generating the heat map and the dendogram shown in Figure2B. Two main clusters of protein spots were clearly detected and differentially regulated. These two clus-ters corresponded to upregulated proteins in the presence of Tmprss3Y260X(high intensity shown in red) and to downregu-lated proteins (low intensity shown in green). Thirty-three protein spots were downregulated and 44 were upregulated in Tmprss3Y260X mice. All the differentially regulated protein spots were identified by liquid chromatography coupled to tandem mass spectrometry (LC-MS/MS) analysis, and the results are summarized in the Supplementary Material, Table S1. One hundred and nineteen independent proteins were identified (after excluding redundant proteins) because of the presence of several spots containing more than one type of identification. Indeed, some proteins were present in full size form and/or in fragment form, such as vimentin and tubulin beta-5, and others were present in different pI forms such as transaldolase 1 and sparc. Moreover, proteins that were upregulated in a spot and downregulated in another one were represented by a fold ratio of one. Less than 1% of proteins identified in our screen are related to apoptosis, suggesting that the altered expression of the proteins is due to a lack of function of Tmprss3, rather than a degenerative process initiated by the IHCs.
Perturbed network identification
To evaluate the potential functional relationships between the set of identified proteins, we carried out a gene ontology (GO) enrichment analysis. We then used the Ontologizer software to perform a statistical analysis of the mapping of the 119 iden-tified proteins over the functional GO terms (Supplementary Material, Table S2). Subsequently, we built a wider network by looking at connected proteins (first-degree neighbors) with our set of 119 identified proteins using the IntAct and BioGRID merge network. The average degree of connectivity of the new network (Supplementary Material, Fig. S2) sup-ported the potential functional relationships between differen-tially expressed proteins found in the Y260X-mutated mouse versus the wild type (WT). This new network (Supplementary Material, Fig. S2) contained 191 proteins connected with 68 identified proteins. In this network, the identified proteins were connected to each other at the most with second-degree neighbors (via a single intermediary). Out of 191 proteins, 160 were present in a main connected subnetwork corresponding to 52 identified proteins, with 23 upregulated, 23 downregu-lated and 6 up and downregudownregu-lated. The other subnetworks, containing at least one identified protein, were composed of a maximum of two to five interactions, or of isolated proteins. In addition, 51 identified proteins did not have any currently documented interaction partners referenced in the IntAct and BioGRID databases. From the main subnetworks (160 pro-teins), only 4 highly connected ‘hub’ proteins were identified. These ‘hubs’ were Ywhab, Ywhaz, Dlh4 and Kcnma1 corre-sponding to the following proteins: 14-3-3 protein beta/alpha (Ywhab), 14-3-3 protein zeta/delta (Ywhaz), disks large homolog 4 (Dlg4/PSD95) and calcium-activated potassium channel sub-unit alpha-1 (Kcnma1) connecting 17, 5, 13 and
22 identified proteins, respectively (Fig.2C and Supplementary Material, Fig. S2). Interestingly, Kcnma1 protein connected the largest number of identified proteins from comparative 2D-GE analysis between Tmprss3WTand Tmprss3Y260X.
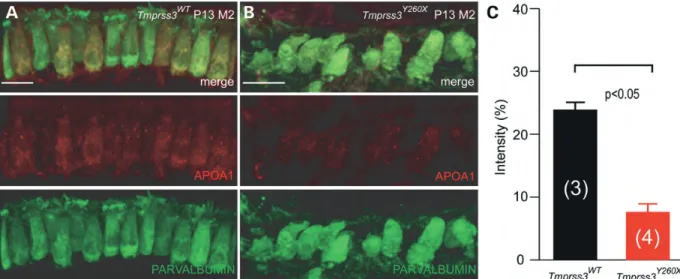
APOA1 is downregulated in Tmprss3Y260X-mutant mice Among the proteins identified by mass spectrophotometry, APOA1 was the most known cochlear interacting protein of Kcnma1, which was downregulated. To validate the APOA1 regulation by Tmprss3, immunohistochemistry was implemen-ted on P13 cochlear explants. Using a polyclonal antibody, APOA1 (red) seemed to be expressed mainly in the IHCs of Tmprss3WTmice labeled with a monoclonal parvalbumin anti-body (green) (Fig.3A). This expression pattern is expected as APOA1 has been shown to be expressed in the cytoplasm of mouse IHC (11). In contrast, APOA1 labeling was fainter in the remaining Tmprss3Y260XIHCs (Fig. 3B). Indeed, the total intensity of the APOA1 signal inside each IHC is greater in Tmprss3WT mice than in Tmprss3Y260X mice (Fig. 3C). Because ApoA1 is known to interact with Kcnma1 channels (11), the downregulation of ApoA1 in Tmprss3Y260Xmice sug-gests that Tmprss3 impairs the Kcnma1 channel’s interactome.
Kcnma1 channels are not clustered in puncta in Tmprss3Y260X mouse IHCs
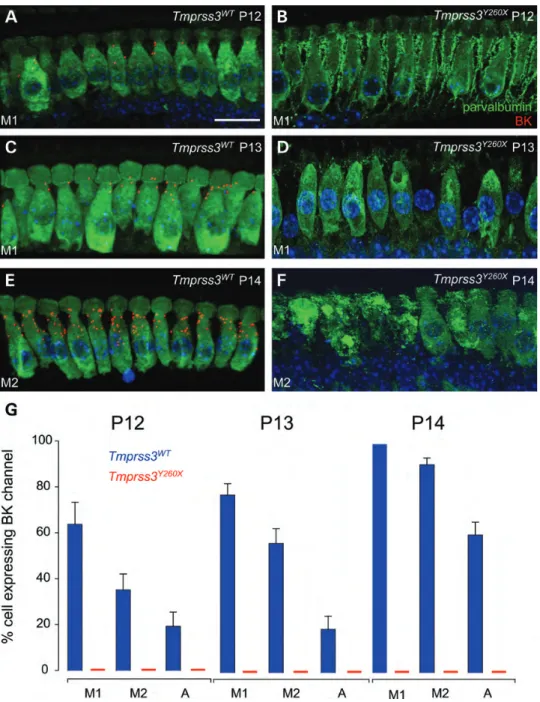
It is well known that Kcnma1 channel immunoreactivity is clustered in puncta in the neck of mammalian IHCs (19). Therefore, it is possible to determine whether Kcnma1 channels are correctly expressed in the IHCs of Tmprss3Y260X-mutant mouse. To address this question, immunohistochemical staining of the Kcnma1 channel using a monoclonal Kcnma1 anti-body was used in the developing Tmprss3WTand Tmprss3Y260X organ of Corti in the same cochlear turn from P12 to P14 (Fig.4). Indeed, as there were no more hair cells from P15 in Tmprss3Y260X-mutant mice, we did not pursue our study further after P14. At P12, the period corresponding to the onset of hearing in mice, some Tmprss3WT IHCs expressed Kcnma1 channels in their neck (Fig. 4A). In contrast, no Tmprss3Y260X IHCs expressed Kcnma1 channels at this stage (Fig.4B). At P13, more Tmprss3WTIHCs expressed Kcnma1 channels, and the number of puncta increased per hair cell (Fig. 4C). As at P12, no P13 Tmprss3Y260X IHCs expressed Kcnma1 channels (Fig.4D), but signs of IHCs that had degen-erated were observed. Finally, at P14, all Tmprss3WT IHCs expressed Kcnma1 channels, and the number of puncta increased (Fig.4E). At P14 in Tmprss3Y260XIHCs, the majority of IHCs had degenerated, but in the persisting IHCs, no Kcnma1 channel expression was observed (Fig.4F). We quantified the number of IHCs expressing Kcnma1 channels in their neck de-pending on the cochlear turn and the age of the animals (see Fig.4G). The number of IHCs expressing Kcnma1 channels is greater in the basal turn of the cochlea than in the apical one and increased from P12 to P14 as previously observed (19).
DISCUSSION
The lack of expression of Kcnma1 channels at the plasma membrane may be due to defects of various cellular processes.
One hypothesis may be that as the hair cells begin to degener-ate, the consequence will be an altered expression of Kcnma1 channels. Our data show that only Kcnma1 channels are lacking—the delayed rectifier K+ channel is still present as is the calcium channel Cav1.3 (this study). However, specific abolition of Kcnma1 channels when cochlear hair cells are de-generating has never been reported to our knowledge. More-over, in Beethoven mutant mice, hair cells still have residual IK,fcurrent just before their degeneration (21). Hence, it is un-likely that the specific lack of Kcnma1 channels is due to the degeneration of cochlear hair cells. Another hypothesis is that Tmprss3Y260X hair cell maturation fails or is delayed as IHCs from Tmprss3Y260X are smaller than WT littermate. Indeed, genetic ablation of the calcium channel Cav1.3 sub-unit (19), and its associated b-2 sub-unit (22), ER transmembrane protein Tmc1 (21), molecular motor Myo6 (23), actin-binding protein (24), or thyroid hormone receptor (25) leads to the absence of IK,fcurrent because of a failure or a delay in coch-lear hair cell maturation. However, transmission electron mi-croscopy observations of Tmprss3Y260X IHCs show normal development until their degeneration [(presence of small numbers of ribbons/IHCs, mature synaptic contacts with only one ribbon/synapse, efferent synaptic contact onto lateral afferent under IHC and direct efferent synaptic contact onto OHC (9)], and normal ICa current amplitude and normal exocytosis were measured in Tmprss3Y260Xwhen compared with Tmprss3WT(this study). All these observations suggest involvement of other mechanisms besides maturation failure or delay.
Observing our differentially expressed protein data, we identified proteins associated with Kcnma1 channels that may modulate the membrane expression of channels and trans-porters. Indeed, 15 out of 119 and 13 out of 119 of the proteins identified in the present screen were identified previously as Kcnma1 channel interacting partners that originated from membrane/cytoskeletal and cytoplasmic fraction, respectively
(26,27). These data suggest that Tmprss3 is a part of Kcnma1 channel pathway and that loss of function of Tmprss3 inter-feres with proper Kcnma1 channel membrane expression. Interestingly, three proteins identified in our screen induce deafness either in humans (g actin and serpinb6) or mice (b actin). ACTG1 (g actin) was identified as the causative gene of DFNA20/26 human deafness (28) and in the syndromic deafness form of Baraitser-Winter Syndrome 2 (29). All DFNB20/26 patients display progressive, bilateral, sensori-neural hearing loss that begins in the high frequencies. As age increases, the degree of hearing loss increases, with threshold shifts seen at all frequencies (28). In contrast, con-genital or late-onset progressive hearing loss is a common feature of Baraitser-Winter syndrome 2. Actg1 is essential for the stereocilia maintenance in mice (30), but not their normal development. However, Tmprss3Y260X-mutant mice have normal stereocilia (9). Interestingly, downregulation of Actg1, which interacts with Kcnma1, decreases Kcnma1 channel membrane expression in transfected CHO cells (27). As Actg1 is downregulated in our screen, it is tempting to speculate that Tmprss3 affects the distribution of Actg1 that in turn affects the proper expression of KcnmA1 channel at the inner hair cell plasma membrane. ACTB (b actin) muta-tions cause Baraitser-Winter Syndrome 2 (29). Actb is also required for stereocilia maintenance, and mutations in mice lead to progressive deafness (30). Like Actg1, Actb interacts with Kcnma1, and its downregulation in podocytes decreases Kcnma1 surface expression (31). As Actb is downregulated in our proteomic screen, this may lead to a decreased expres-sion of Kcnma1 at the inner hair cell surface. Interestingly, Eps8, a protein with actin binding, bundling, and barbed-end capping activities is a novel component of the hair bundle that is localized predominantly at the tip of the stereocilia and is essential for its normal elongation and function (24). Surprisingly, IHCs from Eps8 knockout mice do not develop adult-type ion channels (lack of IK,f conductance linked to
Figure 3. APOA1 is downregulated in IHCs Tmprss3Y260X-mutant mice. Cochlear explants were stained with anti-APOA1 antibody in P13 mice. (A) APOA1 (red) is expressed mainly in IHCs, identified by parvalbumin labeling (green) in Tmprss3WTcochlea. (B) Less staining could be observed in the remaining IHCs of Tmprss3Y260X-mutant mice. (C) Quantification of the intensity of APOA1 labeling in hair cells in Tmprss3WT(24%) and Tmprss3Y260X-mutant mice (7.6%). The percentage corresponds to the percentage of red color (n ¼ 3 for Tmprss3WT, n ¼ 4 for Tmprss3Y260X). The difference is statistically significant (two sample Wilcoxon test, P , 0.05).
Kcnma1 channels) as observed in Tmprss3Y260Xmice, but ICa current and exocytosis fail to mature in Eps8 knockout mice in contrast to Tmprss3Y260X mice. These data suggest that the same phenotype (lack of Kcnma1) is due to two different mechanisms. Finally, SERPINB6-truncating mutation is asso-ciated with DFNB91 deafness (32). Serpinb6 is a proteinase inhibitor of cathepsin G and kallikreins. It has been shown
that Serpinb6 exhibits a prosurvival function in Caenorhabdi-tis elegans (33). In developing and in adult cochlea, Serpinb6 is expressed in cochlear hair cells, suggesting a critical role of the protein in hair cell physiology (32). Nevertheless, Serpinb6 has not yet been identified as a partner of Kcnma1, and no in-formation could be found showing a link between Serpinb6 and surface membrane expression of Kcnma1.
Figure 4. Kcnma1 channels are no longer expressed in the neck of IHCs of Tmprss3Y260X-mutant mice. (A) Cochlear explants were stained with anti-Kcnma1 antibody (red) in P12 mice. IHCs were identified with parvalbumin staining using anti-parvalbumin monoclonal antibody (green), and the nucleus was stained with Hoechst. Kcnma1 channels were expressed in the neck of some IHCs from Tmprss3WT. (B) In contrast, no Kcnma1 expression was found in the IHCs from P12 Tmprss3Y260Xmice. (C) Kcnma1 channels were more expressed in each P13 Tmprss3WTIHC and in more IHCs of the same turn. (D) As for P12, no Kcnma1 labeling was found in Tmprss3Y260XIHCs. (E) Kcnma1 channels were expressed in all P14 Tmprss3WTIHCs of the same turn. (E) Like P13, no Kcnma1 labeling was found in Tmprss3Y260XIHCs. (G) Quantification of Kcnma1 channel expression in the developing organ of Corti from P12 to 14 in three cochlear turns: M1, M2 and A (mid-turn 1, mid-turn 2 and apex). An increase in the number of IHCs expressing Kcnma1 channels was found from P12 to P14 in the Tmprss3WT cochlea (blue vertical bar). The number of IHCs expressing channels was greater in the mid-turn than in the apex at the same developmental stage. In contrast, no Kcnma1 channel immunoreactivity was observed in any Tmprss3Y260XIHCs (red line) (n ¼ 4 for Tmprss3WT, n ¼ 4 for Tmprss3Y260X). The difference is stat-istically significant (two sample t-test, P , 0.05).
The analysis of the proteomic approach underlies 14.3.3 b and 14.3.3 z as potential proteins functionally related to the Tmprss3Y260X mutation. Considering the IHC Kcnma1 channel plasma membrane alteration, it is tempting to specu-late that 14.3.3 proteins may be involved. Indeed, it has been shown that 14.3.3 b, 14.3.3 1, 14.3.3 h, 14.3.3 g, 14.3.3 t and 14.3.3 z interact with Kcnma1 channels and that downregulation of 14.3.3 g induces an increase in Kcnma1 channel membrane expression in CHO cells (27). 14.3.3 b knockdown increases ENaC membrane expression (34), 14.3.3 b mediates forward trafficking to the plasma membrane of KCNK3 (35) and 14.3.3 z mediates trafficking to the plasma membrane of KA2 kainate receptors (36). More-over, 14-3-3 proteins promote the cell surface transport of cor-rectly assembled complexes (37). Interestingly, cleavage of 14-3-3 proteins, which is executed by at least two different mechanisms, probably involves caspase-3 and a still unknown protease beyond the caspase family in an isoform-specific manner (38) that could be Tmprss3. Of course, we cannot rule out the possibility that Tmprss3 directly controls the membrane expression level of Kcnma1 channels, as Tmprss3 and Kcnma1 channels co-localize in the ER of transfected cells.
This novel link between Kcnma1 channels and a type II serine protease may be highly significant in other organs, as Kcnma1 channels are widely expressed in neuronal and non-neuronal tissues, including epithelia, smooth muscle cells and sensory cells, where they couple membrane potential and intracellular Ca2+concentration (39–41). Kcnma1 chan-nels contribute to the repolarization of action potentials (APs) (42), mediate the fast phase after hyperpolarization fol-lowing an AP (43–45), shape the dendritic Ca2+spikes (46) and influence the release of neurotransmitters (47). Achieving a better understanding of the role of Kcnma1 channels is im-portant not only for furthering our knowledge of the involve-ment of these channels in physiologic processes but also for pathophysiologic conditions that have been demonstrated by recent discoveries implicating these channels in neurologic disorders. Indeed, autism and mental retardation have been linked to haploinsufficiency of the Slo1 gene and decreased Kcnma1 channel expression (48). In addition, Kcnma1 channel mutations have been identified through genetic screening of a family with generalized epilepsy and paroxys-mal dyskinesia (14).
In conclusion, our experiments indicate that Tmprss3 defi-ciency causes a selective lack of functional Kcnma1 channels. Future experiments will be required to clarify the exact mechanism by which Tmprss3 regulates the abundance of functional Kcnma1 channels in IHCs. However, the data pre-sented here already strongly suggests that Tmprss3 must be considered as an important factor for the proper functioning of hair cells.
MATERIALS AND METHODS Animal handling
The care and use of animals followed the animal welfare guidelines of the ‘Institut National de la Sante´ et de la Recherche Medicale’ (Inserm), under the approval of the French ‘Ministe`re
de l’Alimentation, de l’Agriculture et de la Peˆche.’ All efforts were made to minimize the number of animals used and their suffering. Tmprss3Y260X mice were described previously by Fasquelle et al. (9).
Preparation of mouse inner ear extracts for proteomics analysis
Cochleae were isolated from 15 10-day-old mice of each geno-type (WT and mutant) in cold PBS, and the bone was removed. The dissected cochleae were rinsed in water and wiped with paper before being placed in a microcentrifuge tube and weighed. The cochleae pellets were then frozen in liquid nitrogen and stored at 2808C. According to their weight, the pellets were resuspended in a defined volume of buffer (100 ml/10 mg of tissue) containing 8M urea, 2M
thio-urea, 4% w/v CHAPS, 65 mM dithioerythritol (DTE), 40 mM
Tris and protease inhibitors (Roche Diagnostics, Meylan, France) and sonicated for 3× 10 s pulses at 20 kHz (Vibracell 72446, Fisher Scientific, Illkirch, France). After solubilization at room temperature (RT) on a rotating wheel for 2 h, the samples were centrifuged at 20 000g for 30 min, and the supernatants were collected and stored at 2808C until use. The amount of protein was estimated using a modified Brad-ford method (49).
2D-GE of proteins
Precast IPG strips (18 cm) with a non-linear immobilized pH 3 – 10 gradient were rehydrated with 70 mg of protein sample in 8M urea, 2M thiourea, 4% w/v CHAPS, 65 mM DTE,
0.0025% v/v bromophenol blue, and 1% v/v IPG buffer (3–
10) overnight (50). Isoelectric focusing (IEF) was carried out on the EttanTMIPGphorTMIEF system at 208C using a
gra-dient mode to a total amount of 50 kVh. After the first dimen-sional run, the proteins were reduced (65 mMDTT in 6Murea,
50 mMTris – HCl, pH 8.8, 30% v/v glycerol, 2% w/v SDS and
0.001 v/v bromophenol blue) and then alkylated for 10 min in a similar buffer containing 135 mM iodoacetamide instead of
DTT. Subsequently, the proteins were separated in the second dimension on homemade 12% SDS-polyacrylamide gels using an ISO-DALT electrophoresis unit at a constant voltage of 120 V at 108C overnight. Analytical gels were stained with a Sypro Ruby fluorescence dye (Bio-Rad, Hercu-les, CA, USA) according to the manufacturer’s instructions. At least five biologic replicates per genotype (Tmprss3WT and Tmprss3Y260X) were performed simultaneously to guarantee re-producible results. Each biologic sample was composed of a pool of six individual cochleae corresponding to three animals.
Image analysis
Gels were digitalized individually with a Typhoon 9400 laser scanner (GE Healthcare Life Sciences, Piscataway, NJ, USA) at 50 mm resolution with a photo multiplier tube voltage adjusted for maximum range without signal saturation. Images were stored as 16-bit gel files and then analyzed using the Progenesis Samespotw
software v3.0 (Nonlinear Dy-namics, Durham, UK). Images were warped for accurate align-ment and spots were then detected automatically. Progenesis
Samespotw
is based on the concept of recursive gel matching, which means that each gel in a matching set is used recursive-ly as ‘reference gel’ once during the matching process. The quality of the automatic match was evaluated critically in each case, and if necessary, corrections were made manually.
Statistics
All statistics and figures were computed using the ‘R/Biocon-ductor’ statistical open source software (51) and the JMP v8 software (SAS Institute, Inc.). The differential intensity levels of protein spots between the Tmprss3WT and Tmprss3Y260X samples were analyzed by the non-parametric Wilcoxon rank sum test (also called the Mann–Whitney U-test). A P-value less than 0.05 was considered statistically significant. The area under the curve (AUC) receiver operating characteristic (ROC) was also calculated with the ROC package, and an AUC ROC value greater than 0.800 was considered significant.
Hierarchical ascendant clustering (HAC) analysis
Hierarchical ascendant clustering (HAC) is a method of cluster analysis based on a pairwise distance matrix, which builds a hierarchy of clusters with sequentially agglomerative and div-isive approaches. We used this method to organize the map and to group the spots according to the nearest level of inten-sity. For this analysis, raw data were mean centered, and the Pearson correlation matrix and average linkage were chosen as parameters.
Protein identification
Spots of interest were excized from preparative gels with a Propic robot (Perkin-Elmer, Wellesley, MA, USA). All sub-sequent steps were done automatically using a Multiprobe II robot (Perkin-Elmer). Spots were first washed with 300 ml of water and then 300 ml of 25 mM NH4HCO3. Destaining was performed twice in the presence of 300 ml of 50% aceto-nitrile in 25 mMNH4HCO3. Gel pieces were then dehydrated twice using 300 ml of 100% CH3CN and finally dried at 378C for 1 h. Eight microliters of a trypsin solution (Sequencing grade modified trypsin, Promega, Madison, USA) at a con-centration of 0.0125 mg/ml in 25 mM NH4HCO3 was added to every spot. Digestion was performed overnight at 378C and stopped by the addition of 2 ml of 2% formic acid. Digests were sonicated in an ultrasonic bath for 10 min, and supernatants were transferred into HPLC polypropylene tubes.
Protein digests were analyzed using a high-capacity ion trap mass spectrometer (Esquire HCT; Bruker Daltonik GmbH, Bremen, Germany) and interfaced with a nano-HPLC Chip-Cube system (Agilent Technologies, Santa Clara, USA). The chips contained both the pre-column and the column (Zorbax 300SB-C18; Agilent Technologies). Samples were first loaded onto the 4 mm enrichment cartridge at a flow rate of 4 ml/min using 0.1% formic acid. After pre-concentration, peptides were separated on the column (75 mm diameter and 43 mm length) at a flow rate of 0.3 ml/min using a 15 min linear gradient from 3 to 80% acetonitrile in 0.1% formic acid and eluted into the mass spectrometer. A capillary voltage of 1.8– 2.1 kV in the positive ion mode was used
together with a dry gas flow rate of 4.5 l/min at 2508C. A first full-scan mass spectrum was measured in the 310–1800 m/z range, followed by a second scan at higher resolution to measure precisely the mass of the three major ions in the previ-ous scan. Finally, a third scan was performed to acquire the collision-induced MS/MS spectra of the selected ions. MS/MS raw data were analyzed using the data analysis software (Bruker Daltonik GmbH, Bremen, Germany) to generate the peak lists. The NCBI non-redundant database (NCBInr, release 20101018) was queried locally using the Mascot search engine (v. 2.2.04; Matrix Science, London, UK) with the following parameters: Mus for the taxonomy, trypsin as the enzyme, one missed cleavage allowed, carbamidomethyla-tion of Cysteine as a fixed modificacarbamidomethyla-tion, oxidacarbamidomethyla-tion of Methio-nine as a variable modification, and 0.6 Da mass accuracy in both MS and MS/MS. Under these conditions, individual ion scores above 38 indicated identity or extensive homology (P , 0.05), and proteins were validated once they showed at least 1 peptide over this threshold.
Protein interaction data and network visualization The gene names of the identified proteins were used to perform GO enrichment analysis using the Ontologizer soft-ware. This Java Web Start application allows the statistical analysis of sets of proteins or genes of interest mapped onto GO terms (http://compbio.charite.de/ontologizer) (52). GO an-notation files (gene_association.wb and gene_ontology_edi-t.obo) were downloaded from www.geneontology.org in October 2011. The ontologizer was run using the following parameters: biologic process, parent – child union and the Ben-jamini – Hochberg statistical test. Biologic processes showing P-values below 0.05 were considered statistically significant. The ontologizer allows visualization of data as a directed acyclic graph highlighting all significantly enriched GO terms, in turn linked to the genes/proteins of interest.
PPI data were combined with our set of identified proteins to build a functional network. Full PPI datasets were avail-able from two different open source literature-curated protein interaction databases: IntAct (http://www.ebi.ac.uk/ intact/site/index.jsf; dated March 28 2011) and the Biological General Repository for Interaction Datasets (BioGRID; http://thebiogrid.org/; version 3.1.74). PPI networks were generated using Cytoscape (53), an open source software (http://www.cytoscape.org/; version 2.8.1). The gene names of all identified proteins were imported into IntAct via its Cytoscape plug-in. BioGRID datasets from Mus musculus (file BIOGRID-ORGANISM-Mus_musculus-3.1.74.tab) were imported into Cytoscape via the BioGRID plug-in (Bio-gridPlugin2). Proteins were represented by nodes and the inter-actions by edges. Then, for each of identified proteins, the direct interacting neighbors were identified (length ¼ 1). Finally, the PPI networks from the IntAct and BioGRID databases were merged with an advanced merge network plug-in and displayed with Cytoscape using the edge-unweighted spring embedded style. The selection of subnetworks was based on the degree of connectivity of a significant number of identified proteins. Highly connected proteins were named ‘hubs proteins.’
Immunohistochemistry and confocal imaging
Cochleae were extracted from the temporal bones of 12-, 13-or 14-day-old mice and fixed in cold 4% paraf13-ormaldehyde f13-or 1 h with shaking. After several washes in PBS, organs of Corti were isolated from the stria vascularis and modiolus and incu-bated in a goat serum dilution buffer (GSDB) (16% normal goat serum, 450 mM NaCl, 0.3% Triton X-100, and 20 mM
phosphate buffer, pH 7.4) at RT for 1 h. Anti-Kcnma1 rabbit antibody (Sigma Aldrich, St. Louis, MO, USA), anti-APOA1 goat antibody (Novus Biologicals, Cambridge, UK) that was successfully used in mouse (54,55) and anti-parvalbumin mouse antibody (Swant, Marly, Switzerland) were diluted in GSDB at 1/2000, 1/500 and 1/750, respectively and applied overnight at 48C with shaking. After washing with washing buffer (450 mM NaCl, 20 mM phosphate buffer pH 7.4 and
0.3% Triton X-100) (6x 10 min with shaking), the organs of Corti were incubated with goat anti-rabbit and goat anti-mouse antibodies, respectively, coupled with Alexa Fluor-594 and -488 (Jackson ImmunoResearch Laboratories, Suffolk, UK) diluted at 1/3000 in GSDB for 1 h 30 at RT with shaking and protection from light. A 5 min supplementary incubation was carried out after the addition of Hoechst (FluoProbes, Interchim, Montluc¸on, France) at 1/200. After three 10 min washes each in a washing buffer, the organs of Corti were washed for 10 min in 5 mMphosphate buffer, pH 7.4, placed
onto a glass microscope slide in a DaKo fluorescent mounting medium (DakoCytomation, Trappes, France) and covered with a thin glass coverslip. Confocal images were acquired using a laser scanning confocal microscope LSM 510 (Zeiss, LE PECQ, France) with argon and helium – neon lasers for excita-tion. Oil immersion objectives with a magnification of 63× were used, and Z-stacks were acquired using a step size of 1.5 mm. Three-dimensional reconstruction images were made using the Imaris software. No immunoreactivity was detected in the absence of the primary antibodies.
The intensity of APOA1 immunolabeling was quantified from red green blue confocal images using custom-made program written in MATLAB (The Mathworks). The APOA1-labeled voxels (red channel) localized in IHC cytoplasm (green channel) were (i) isolated using parvalbumin immuno-labeling as a mask and (ii) used to calculate the mean inten-sity. Mean intensities were calculated in Tmprss3WT (n ¼ 3) and Tmprss3Y260X animals (n ¼ 4) and compared with Mann – Whitney – Wilcoxon test. These numbers correspond to the number of measurements. Each measurement contains at least five hair cells.
As mouse cochlea length has been found to average 6 mm (56), including the basal (3 mm), the middle (2 mm) and the apical (1 mm) coils, and as the IHCs have already degenerated at P12, the counting of the number of IHCs expressing Kcnma1 channels was achieved in middle turn (separated into two, M1 and M2) and in the apical turn (A).
Patch-clamp recordings
After cervical dislocation of the Tmprss3WTand Tmprss3Y260X mice (postnatal day 13, P13), IHCs of the apical coil of freshly dissected organs of Corti were patch clamped at RT in whole-cell configuration. The pipette solution contained (in mM) 135
KCl, 10 Hepes buffer, 1 MgCl2, 2 Mg-ATP, 0.3 Na-GTP and 5 ethyleneglycol-bis(b-aminoethyl ether)-N,N,N′,N′-tetraacetic acid. The extracellular solution contained (in mM) 144
NaCl, 5.8 KCl, 0.9 MgCl2, 10 HEPES, 1.3 CaCl2 and 10
D-glucose. The solutions were adjusted to pH 7.2 with
osmo-larities between 290 and 310 mOsmol/l. All chemicals were obtained from Sigma (Sigma Aldrich). The EPC-10 amplifier (HEKA, Lambrecht, Germany), controlled by the Patchmaster software (HEKA), was used for recording measurements. For K+currents, series resistance (Rs) compensation was applied to 60%. The voltage was corrected offline for the voltage drop across uncompensated series resistance. Currents were low-pass filtered at 5 kHz and sampled at 50 kHz. All voltages were corrected for liquid junction potentials calculated between the pipette and the bath (4 mV). Currents were leak corrected using a p/10 protocol (usually 10 leak pulses with amplitudes of 20% of the original pulse from a holding potential of 2104 mV). Cells that displayed a membrane current exceeding 250 pA at 274 mV were discarded from the analysis.
AUTHORS’ CONTRIBUTIONS
B.D. designed research; L.M., L.F., R.N. and N.S. performed research; L.M., L.F., R.N. and N.S. analyzed the data; M.G. and H.S.S. contributed new reagents; and L.M., R.N., F.M., M.G., H.S.S., J.L.P. and B.D. wrote this paper.
SUPPLEMENTARY MATERIAL
Supplementary Material is available at HMG online.
ACKNOWLEDGEMENTS
We thank the Cellular Imaging Facility especially Chamroeun Sar and the Animal Facility of the INM. We thank Je´roˆme Bourien for the immunohistochemistry quantification of APOA1 and Fre´de´ric Marmige`re, Ce´dric Raoul and Alain Garce`s for their critical review of the manuscript and for helpful discussions. The MS and MS/MS analyses were per-formed in the Proteomics Pole of Montpellier supported by the Re´gion Languedoc-Roussillon and IBISA.
Conflict of Interest statement. None declared.
FUNDING
This work was supported by grants from the Swiss National Science Foundation (3100A0-114077-1 to M.G.); the National Health and Medical Research Council of Australia (257501, 215305, 71601 and 461204 to H.S.S.); and the Re´gion Languedoc-Roussillon (Chercheur d’Avenir to B.D.).
REFERENCES
1. Housley, G.D., Marcotti, W., Navaratnam, D. and Yamoah, E.N. (2006) Hair cells – beyond the transducer. J. Membr. Biol., 209, 89 – 118. 2. Kros, C.J. (2007) How to build an inner hair cell: challenges for
3. Kros, C.J., Ruppersberg, J.P. and Rusch, A. (1998) Expression of a potassium current in inner hair cells during development of hearing in mice. Nature, 394, 281 – 284.
4. Oliver, D., Taberner, A.M., Thurm, H., Sausbier, M., Arntz, C., Ruth, P., Fakler, B. and Liberman, M.C. (2006) The role of BKCa channels in electrical signal encoding in the mammalian auditory periphery. J. Neurosci., 26, 6181– 6189.
5. Marcotti, W., Johnson, S.L., Holley, M.C. and Kros, C.J. (2003) Developmental changes in the expression of potassium currents of embryonic, neonatal and mature mouse inner hair cells. The J. Physiol., 548, 383 – 400.
6. Oliver, D., Knipper, M., Derst, C. and Fakler, B. (2003) Resting potential and submembrane calcium concentration of inner hair cells in the isolated mouse cochlea are set by KCNQ-type potassium channels. J. Neurosci., 23, 2141 – 2149.
7. Kubisch, C., Schroeder, B.C., Friedrich, T., Lutjohann, B., El-Amraoui, A., Marlin, S., Petit, C. and Jentsch, T.J. (1999) KCNQ4, a novel potassium channel expressed in sensory outer hair cells, is mutated in dominant deafness. Cell, 96, 437 – 446.
8. Scott, H.S., Kudoh, J., Wattenhofer, M., Shibuya, K., Berry, A., Chrast, R., Guipponi, M., Wang, J., Kawasaki, K., Asakawa, S. et al. (2001) Insertion of beta-satellite repeats identifies a transmembrane protease causing both congenital and childhood onset autosomal recessive deafness. Nat. Genet., 27, 59 – 63.
9. Fasquelle, L., Scott, H.S., Lenoir, M., Wang, J., Rebillard, G., Gaboyard, S., Venteo, S., Francois, F., Mausset-Bonnefont, A.L., Antonarakis, S.E. et al. (2011) Tmprss3, a transmembrane serine protease deficient in human DFNB8/10 deafness, is critical for cochlear hair cell survival at the onset of hearing. J. Biol. Chem., 286, 17383 – 17397.
10. Guipponi, M., Vuagniaux, G., Wattenhofer, M., Shibuya, K., Vazquez, M., Dougherty, L., Scamuffa, N., Guida, E., Okui, M., Rossier, C. et al. (2002) The transmembrane serine protease (TMPRSS3) mutated in deafness DFNB8/10 activates the epithelial sodium channel (ENaC) in vitro. Hum. Mol. Genet., 11, 2829 – 2836.
11. Sokolowski, B., Duncan, R.K., Chen, S., Karolat, J., Kathiresan, T. and Harvey, M. (2009) The large-conductance Ca(2+)-activated K(+) channel interacts with the apolipoprotein ApoA1. Biochem. Biophy. Res. Commun., 387, 671 – 675.
12. Robitaille, R., Garcia, M.L., Kaczorowski, G.J. and Charlton, M.P. (1993) Functional colocalization of calcium and calcium-gated potassium channels in control of transmitter release. Neuron, 11, 645 – 655. 13. Brayden, J.E. and Nelson, M.T. (1992) Regulation of arterial tone by
activation of calcium-dependent potassium channels. Science, 256, 532 – 535.
14. Burdyga, T. and Wray, S. (2005) Action potential refractory period in ureter smooth muscle is set by Ca sparks and BK channels. Nature, 436, 559 – 562.
15. Ahluwalia, J., Tinker, A., Clapp, L.H., Duchen, M.R., Abramov, A.Y., Pope, S., Nobles, M. and Segal, A.W. (2004) The large-conductance Ca2+-activated K+ channel is essential for innate immunity. Nature, 427, 853 – 858.
16. Couloigner, V., Fay, M., Djelidi, S., Farman, N., Escoubet, B., Runembert, I., Sterkers, O., Friedlander, G. and Ferrary, E. (2001) Location and function of the epithelial Na channel in the cochlea. Am. J. Physiol., 280, F214 – F222.
17. Grunder, S., Muller, A. and Ruppersberg, J.P. (2001) Developmental and cellular expression pattern of epithelial sodium channel alpha, beta and gamma subunits in the inner ear of the rat. The Eur. J. Neurosci., 13, 641 – 648.
18. Zhong, S.X. and Liu, Z.H. (2004) Immunohistochemical localization of the epithelial sodium channel in the rat inner ear. Hear. Res., 193, 1 – 8. 19. Pyott, S.J., Glowatzki, E., Trimmer, J.S. and Aldrich, R.W. (2004)
Extrasynaptic localization of inactivating calcium-activated potassium channels in mouse inner hair cells. J. Neurosci., 24, 9469– 9474. 20. Brandt, A., Striessnig, J. and Moser, T. (2003) CaV1.3 channels are
essential for development and presynaptic activity of cochlear inner hair cells. J. Neurosci., 23, 10832 – 10840.
21. Marcotti, W., Erven, A., Johnson, S.L., Steel, K.P. and Kros, C.J. (2006) Tmc1 is necessary for normal functional maturation and survival of inner and outer hair cells in the mouse cochlea. J. Physiol., 574, 677 – 698. 22. Neef, J., Gehrt, A., Bulankina, A.V., Meyer, A.C., Riedel, D., Gregg,
R.G., Strenzke, N. and Moser, T. (2009) The Ca2+ channel subunit beta2
regulates Ca2+ channel abundance and function in inner hair cells and is required for hearing. J. Neurosci., 29, 10730 – 10740.
23. Roux, I., Hosie, S., Johnson, S.L., Bahloul, A., Cayet, N., Nouaille, S., Kros, C.J., Petit, C. and Safieddine, S. (2009) Myosin VI is required for the proper maturation and function of inner hair cell ribbon synapses. Hum. Mol. Genet., 18, 4615– 4628.
24. Zampini, V., Ruttiger, L., Johnson, S.L., Franz, C., Furness, D.N., Waldhaus, J., Xiong, H., Hackney, C.M., Holley, M.C., Offenhauser, N. et al. (2011) Eps8 regulates hair bundle length and functional maturation of mammalian auditory hair cells. PLoS Biol., 9, e1001048.
25. Rusch, A., Ng, L., Goodyear, R., Oliver, D., Lisoukov, I., Vennstrom, B., Richardson, G., Kelley, M.W. and Forrest, D. (2001) Retardation of cochlear maturation and impaired hair cell function caused by deletion of all known thyroid hormone receptors. J. Neurosci., 21, 9792 – 9800. 26. Kathiresan, T., Harvey, M., Orchard, S., Sakai, Y. and Sokolowski, B.
(2009) A protein interaction network for the large conductance Ca(2+)-activated K(+) channel in the mouse cochlea. Mol. Cell. Proteomics, 8, 1972 – 1987.
27. Sokolowski, B., Orchard, S., Harvey, M., Sridhar, S. and Sakai, Y. (2011) Conserved BK channel-protein interactions reveal signals relevant to cell death and survival. PloS One, 6, e28532.
28. Zhu, M., Yang, T., Wei, S., DeWan, A.T., Morell, R.J., Elfenbein, J.L., Fisher, R.A., Leal, S.M., Smith, R.J. and Friderici, K.H. (2003) Mutations in the gamma-actin gene (ACTG1) are associated with dominant progressive deafness (DFNA20/26). Am. J. Hum. Genet., 73, 1082 – 1091. 29. Riviere, J.B., van Bon, B.W., Hoischen, A., Kholmanskikh, S.S., O’Roak,
B.J., Gilissen, C., Gijsen, S., Sullivan, C.T., Christian, S.L.,
Abdul-Rahman, O.A. et al. (2012) De novo mutations in the actin genes ACTB and ACTG1 cause Baraitser-Winter syndrome. Nat. Genet., 44, 440 – 444, S441 – 442.
30. Perrin, B.J., Sonnemann, K.J. and Ervasti, J.M. (2010) beta-actin and gamma-actin are each dispensable for auditory hair cell development but required for Stereocilia maintenance. PLoS Genet., 6, e1001158. 31. Kim, E.Y., Suh, J.M., Chiu, Y.H. and Dryer, S.E. (2010) Regulation of
podocyte BK(Ca) channels by synaptopodin, Rho, and actin microfilaments. Am. J. Physiol., 299, F594 – F604.
32. Sirmaci, A., Erbek, S., Price, J., Huang, M., Duman, D., Cengiz, F.B., Bademci, G., Tokgoz-Yilmaz, S., Hismi, B., Ozdag, H. et al. (2010) A truncating mutation in SERPINB6 is associated with autosomal-recessive nonsyndromic sensorineural hearing loss. Am. J. Hum. Genet., 86, 797 – 804.
33. Luke, C.J., Pak, S.C., Askew, Y.S., Naviglia, T.L., Askew, D.J., Nobar, S.M., Vetica, A.C., Long, O.S., Watkins, S.C., Stolz, D.B. et al. (2007) An intracellular serpin regulates necrosis by inhibiting the induction and sequelae of lysosomal injury. Cell, 130, 1108 – 1119.
34. Liang, X., Butterworth, M.B., Peters, K.W., Walker, W.H. and Frizzell, R.A. (2008) An obligatory heterodimer of 14 – 3-3beta and 14-3-3epsilon is required for aldosterone regulation of the epithelial sodium channel. J. Biol. Chem., 283, 27418 – 27425.
35. O’Kelly, I., Butler, M.H., Zilberberg, N. and Goldstein, S.A. (2002) Forward transport. 14-3-3 binding overcomes retention in endoplasmic reticulum by dibasic signals. Cell, 111, 577 – 588.
36. Vivithanaporn, P., Yan, S. and Swanson, G.T. (2006) Intracellular trafficking of KA2 kainate receptors mediated by interactions with coatomer protein complex I (COPI) and 14-3-3 chaperone systems. J. Biol. Chem., 281, 15475 – 15484.
37. Heusser, K., Yuan, H., Neagoe, I., Tarasov, A.I., Ashcroft, F.M. and Schwappach, B. (2006) Scavenging of 14-3-3 proteins reveals their involvement in the cell-surface transport of ATP-sensitive K+ channels. J. Cell Sci., 119, 4353 – 4363.
38. Kuzelova, K., Grebenova, D., Pluskalova, M., Kavan, D., Halada, P. and Hrkal, Z. (2009) Isoform-specific cleavage of 14-3-3 proteins in apoptotic JURL-MK1 cells. J. Cell. Biochem., 106, 673 – 681.
39. Fettiplace, R. and Fuchs, P.A. (1999) Mechanisms of hair cell tuning. Ann. Rev. Physiol., 61, 809 – 834.
40. Petersen, O.H. and Maruyama, Y. (1984) Calcium-activated potassium channels and their role in secretion. Nature, 307, 693 – 696.
41. Vergara, C., Latorre, R., Marrion, N.V. and Adelman, J.P. (1998) Calcium-activated potassium channels. Curr. Opin. Neurobiol., 8, 321 – 329.
42. Storm, J.F. (1987) Action potential repolarization and a fast
after-hyperpolarization in rat hippocampal pyramidal cells. J. Physiol., 385, 733 – 759.
43. Coling, D.E., Ding, D., Young, R., Lis, M., Stofko, E., Blumenthal, K.M. and Salvi, R.J. (2007) Proteomic analysis of cisplatin-induced cochlear damage: methods and early changes in protein expression. Hear. Res., 226, 140 – 156.
44. Lancaster, B. and Nicoll, R.A. (1987) Properties of two calcium-activated hyperpolarizations in rat hippocampal neurones. J. Physiol., 389, 187 – 203.
45. Womack, M.D. and Khodakhah, K. (2002) Characterization of large conductance Ca2+-activated K+ channels in cerebellar Purkinje neurons. Eur. J. Neurosci., 16, 1214– 1222.
46. Golding, N.L., Jung, H.Y., Mickus, T. and Spruston, N. (1999) Dendritic calcium spike initiation and repolarization are controlled by distinct potassium channel subtypes in CA1 pyramidal neurons. J. Neurosci., 19, 8789 – 8798.
47. Yazejian, B., Sun, X.P. and Grinnell, A.D. (2000) Tracking presynaptic Ca2+ dynamics during neurotransmitter release with Ca2+-activated K+ channels. Nat. Neurosci., 3, 566–571.
48. Laumonnier, F., Roger, S., Guerin, P., Molinari, F., M’Rad, R., Cahard, D., Belhadj, A., Halayem, M., Persico, A.M., Elia, M. et al. (2006) Association of a functional deficit of the BKCa channel, a synaptic regulator of neuronal excitability, with autism and mental retardation. Am. J. Psychiatry, 163, 1622– 1629.
49. Weekes, J., Wheeler, C.H., Yan, J.X., Weil, J., Eschenhagen, T., Scholtysik, G. and Dunn, M.J. (1999) Bovine dilated cardiomyopathy: proteomic analysis of an animal model of human dilated cardiomyopathy. Electrophoresis, 20, 898 – 906.
50. Molina, L., Grimaldi, M., Robert-Hebmann, V., Espert, L., Varbanov, M., Devaux, C., Granier, C. and Biard-Piechaczyk, M. (2007) Proteomic analysis of the cellular responses induced in uninfected immune cells by cell-expressed X4 HIV-1 envelope. Proteomics, 7, 3116 – 3130. 51. Gentleman, R.C., Carey, V.J., Bates, D.M., Bolstad, B., Dettling, M.,
Dudoit, S., Ellis, B., Gautier, L., Ge, Y., Gentry, J. et al. (2004) Bioconductor: open software development for computational biology and bioinformatics. Genome Biol., 5, R80.
52. Bauer, S., Grossmann, S., Vingron, M. and Robinson, P.N. (2008) Ontologizer 2.0 – a multifunctional tool for GO term enrichment analysis and data exploration. Bioinformatics, 24, 1650– 1651.
53. Cline, M.S., Smoot, M., Cerami, E., Kuchinsky, A., Landys, N., Workman, C., Christmas, R., Avila-Campilo, I., Creech, M., Gross, B. et al. (2007) Integration of biological networks and gene expression data using Cytoscape. Nat. Protoc., 2, 2366– 2382.
54. Duong, P.T., Collins, H.L., Nickel, M., Lund-Katz, S., Rothblat, G.H. and Phillips, M.C. (2006) Characterization of nascent HDL particles and microparticles formed by ABCA1-mediated efflux of cellular lipids to apoA-I. J. Lipid Res., 47, 832 – 843.
55. Hasebe, A., Pennock, N.D., Mu, H.H., Chan, F.V., Taylor, M.L. and Cole, B.C. (2006) A microbial TLR2 agonist imparts macrophage-activating ability to apolipoprotein A-1. J. Immunol., 177, 4826– 4832.
56. Ou, H.C., Harding, G.W. and Bohne, B.A. (2000) An anatomically based frequency-place map for the mouse cochlea. Hear. Res., 145, 123 – 129.