HAL Id: hal-02878364
https://hal.sorbonne-universite.fr/hal-02878364
Submitted on 23 Jun 2020
HAL is a multi-disciplinary open access
archive for the deposit and dissemination of sci-entific research documents, whether they are pub-lished or not. The documents may come from teaching and research institutions in France or abroad, or from public or private research centers.
L’archive ouverte pluridisciplinaire HAL, est destinée au dépôt et à la diffusion de documents scientifiques de niveau recherche, publiés ou non, émanant des établissements d’enseignement et de recherche français ou étrangers, des laboratoires publics ou privés.
High Performance Thin-Layer Chromatography of Plant
Ecdysteroids Coupled with Desorption Electrospray
Ionisation-Ion Mobility-Time of Flight High Resolution
Mass Spectrometry (HPTLC/DESI/IM/ToFMS)
E. Claude, M. Tower, R. Lafont, I.D. Wilson, R.S. Plumb
To cite this version:
E. Claude, M. Tower, R. Lafont, I.D. Wilson, R.S. Plumb. High Performance Thin-Layer Chromatog-raphy of Plant Ecdysteroids Coupled with Desorption Electrospray Ionisation-Ion Mobility-Time of Flight High Resolution Mass Spectrometry (HPTLC/DESI/IM/ToFMS). Chromatographia, Springer Verlag, 2020, �10.1007/s10337-020-03917-9�. �hal-02878364�
https://doi.org/10.1007/s10337-020-03917-9
SHORT COMMUNICATION
High Performance Thin‑Layer Chromatography of Plant Ecdysteroids
Coupled with Desorption Electrospray Ionisation–Ion Mobility–Time
of Flight High Resolution Mass Spectrometry (HPTLC/DESI/IM/ToFMS)
E. Claude1 · M. Tower1 · R. Lafont2 · I. D. Wilson3 · R. S. Plumb4
Received: 27 January 2020 / Revised: 18 May 2020 / Accepted: 29 May 2020 © The Author(s) 2020
Abstract
The use of high performance thin-layer chromatography (HPTLC) in combination with high resolution time of flight mass spectrometry (MS) for the detection, identification and imaging (HPTLC/MSI) of ecdysteroids (insect moulting hormones) present in a number of plant extracts obtained from members of the Silene family is demonstrated. DESI is shown to be a convenient method for the recovery of these polar polyhydroxylated steroids from the silica gel of the HPTLC plate for sub-sequent MS detection and imaging. The incorporation of an ion mobility separation (IMS) to the system to give HPTLC/IMS/ MS provided additional drift time data which enabled more confident identification. Using HPTLC/DESI/IMS/MS, a range of ecdysteroids were detected and characterized in extracts of S. otitis, S nutans, S. maritime, S. viridiflora and S. fimbriata.
Keywords HPTLC–MS · Ion mobility · DESI · Ecdysteroids · Imaging MS
Introduction
The ecdysteroids form a group of polar, polyhydroxy-lated, steroids that are involved in arthropod develop-ment, particularly in regard to moulting (and indeed these compounds are often referred to as moulting hormones). The first of these compounds to be isolated was ecdysone ((22R)-2β,3β,14α,22,25-pentahydroxy-5β-cholest-7-en-6-one) in 1954 by Butenant and Karlson [1]. Since then some 517 ecdysteroids have been described [2], many derived from plants, where they probably act as defence compounds against insects. More recently these secondary
plant metabolites, also termed phytoecdysteroids, have been also assessed for pharmacological properties such as e.g., anabolic effects in humans [3]. When searching for phy-toecdysteroids TLC provided a proven, robust and readily available method for screening extracts, of varying degrees of purity, but identification remains a problem. For the iden-tification of ecdysteroids, and indeed many other secondary plant products, MS-based techniques represent a mainstay for their spectrometric characterisation. Often MS for the detection and characterization of compounds in complex mixtures is performed in conjunction with hyphenation to a separation technique. Whilst hyphenation has most com-monly been to column-based techniques (e.g., GC, LC CE etc.) the application of TLC/MS has also been an area of some interest for many years [4]. Various methods, either via “direct” (e.g., MALDI/ToFMS-based [5, 6]), or using more specialized TLC/MS interfaces [e.g., 7, 8], amongst others, have been described. In previous studies, we have used off-line fast atom bombardment (FAB) MS to analyse ecdysteroids contained in plant extracts directly from the silica of HPTLC plates. In these applications the station-ary phase for the zones of interest was removed from the plate and mixed (mulled) with glycerol and DMSO to form a paste before being placed directly on the FAB target [9]. However, whilst this manual process was effective, it was time consuming and not quantitative, and much spatial
* E. Claude
emmanuelle_claude@waters.com * I. D. Wilson
i.wilson@imperial.ac.uk
1 Waters Corporation, Stamford Rd, Wilmslow SK9 4AX, UK 2 Sorbonne Université, IBPS-BIOSIPE, Campus Pierre et
Marie Curie, 75005 Paris, France
3 Division of Systems Medicine, Department of Metabolism,
Digestion and Reproduction, Imperial College London, Exhibition Road, South Kensington, London SW7 2AZ, UK
4 Scientific Operations, Waters Corporation, Milford,
E. Claude et al.
1 3
information was lost. The development of desorption elec-trospray ionisation techniques (DESI) for MS, that are well suited to both targeted “spot” analysis and TLC plate imag-ing, e.g. for lipids [10] and alkaloids [11], has encouraged us to reinvestigate the application of HPTLC/MS directly by DESI for the analysis and identification of ecdysteroids in plant extracts. We have also previously investigated the use of TLC with DESI in combination with ion mobility (IM) [12]. The use of an ion mobility separation (IMS) provides a fast-analytical technique that separates gas-phase ions on the basis of their differential mobility. This differential mobility is a product of their size, shape, m/z and charge in a buffer gas under the influence of an applied electric field and our initial investigation used a dedicated TLC plate interface applied to the DESI/IMS/MS of pharmaceuticals [12]. More recently, the use of TLC/IMS alone has been described for the offline and online analysis of TLC plates for two compo-nent mixtures of morphine–papaverine and acridine–papa-verine [13] but, while valuable, the identification potential of IMS alone, even when coupled to a TLC separation, for complex mixtures is limited. Combining complementary analytical techniques such as HPTLC, DESI, MS and IM into a single method offers advantages such as reduced sam-ple preparation, retention of spatial information, increased peak capacity, improved MS-spectra and greater confi-dence in identification. Here we describe the use of DESI/ MS imaging (MSI) and DESI/IMS/MSI for the analysis of ecdysteroid-containing plant extracts, separated by HPTLC, as an example of its use for more complex mixtures.
Experimental
Chemicals and Reagents
Chloroform and ethanol were obtained from Sigma Aldrich (Dorset, UK). The ecdysteroids used as standards in this work were obtained as gifts from a variety of sources and were used as supplied.
Samples: standard ecdysteroids were dissolved in
metha-nol at a concentration of ca. 1 mg/ml and 1 µl of each was applied to the plate. The five methanolic extracts from four members of the Silene genus, namely S. nutans (two differ-ent extracts, SN1 and SN2), S. otites (SO1), S. fimbriata (SF) and S. viridiflora (SV1) were used in these studies prepared as described elsewhere [9].
Chromatography: Chromatography was performed by
HPTLC on silica gel, on both ecdysteroid standards (alu-minium backed HPTLC plates 5 × 7.5 cm) and plant extracts (glass backed silica gel HPTLC plates, 10 × 10 cm) incor-porating a fluorescent indicator (E. Merck, Darmstadt, Ger-many). Plate development was performed using glass TLC tanks, in a fume hood, with chloroform: ethanol 4:1 (v/v) as
the developing solvent. Samples were applied to the plates manually using 1 µl glass capillaries (Drummond Scientific Company, Broomall, Pa, USA). The quality of the separa-tions achieved was assessed prior to further MS-based analy-sis by visualizing the plates under a UV lamp at 254 nm and, if suitable, they were then taken for DESI.
DESI‑MS Imaging
Experiments were performed using a SYNAPT XS High Definition MS (HDMS) system (Waters Corporation, Man-chester, UK) operated in sensitivity mode (25,000 FWHM at
m/z 500) and equipped with a two-dimensional DESI stage
from Prosolia (Indianapolis, IN, USA). A methanol/water (MeOH/H2O) 98:2 (v/v) solvent composition was used at a flow rate of 2 µl/min with a nebulizing gas spray of nitrogen at a gas pressure of 5 bar. A voltage of 4 kV was applied to the spray.
DESI/MSI experiments were acquired in positive mode from m/z 100–1200 with ion mobility separation (IMS) key settings of trap DC bias 50, IMS wave velocity ramp starting at 1,000 m/s and ending at 250 m/s and transfer wave veloc-ity of 175 m/s. The pixel dimensions were 200 µm in both the X and Y dimensions.
Data Processing
Acquisition setup, processing and visualisation of imaging data were performed using High Definition Imaging (HDI) 1.5 (Waters Corporation, Manchester, UK). Data were acquired and mined using MassLynx version 4.2 (Waters Corporation, Manchester, UK). Further data mining was carried out using DriftScope 2.9 (Waters Corporation, Manchester, UK) to visualise the IMS dimension of the data. Datasets were re-arranged by drift time (either bins or milliseconds) to evaluate the different drift time (Dt) of the compounds of interest. Also, using DriftScope, it was possible to extract distinct regions in the m/z vs. Dt 2D-plot corresponding to different classes of molecules present on the surface of the samples.
Results and Discussion
Initial experiments to determine the suitability of DESI/ MSI were performed with standards chromatographed on aluminium backed silica gel HPTLC plates, using chloro-form-ethanol 4:1 (v/v). This solvent system was chosen as it is widely used for the separation of ecdysteroids on silica gel. After drying, the developed plates were taken for anal-ysis by DESI/MSI and then DESI/IMS/MSI as described below. Whilst DESI/MS of the ecdysteroids was found to be
possible using either aluminium or glass backed plates the result provided below are for the latter.
DESI/MSI and TLC/DESI/IMS/MS of Ecdysteroid Standards
Five ecdysteroid standards (ponasterone A, ecdysone, kala-dasterone, inokosterone and 20-hydroxyecdysone) were spotted onto a Prosolia Teflon coated glass slide to ensure that these molecules could be analysed directly by DESI/ MS. All standards were detected as sodiated species by
DESI/MS, with little or no presence of the protonated or potassiated species as seen in Fig. 1a. Drift times (Dt) of the sodiated molecular ion for each standard are plotted in Fig. 1b and summarised in Table 1. Ponasterone A and ecdysone are isobaric molecules and were detected as m/z 487.30 but with Dt = 5.1 ms and Dt = 5.37 ms, respectively. Kaladasterone was detected as m/z 501.28 and Dt = 5.30 ms and inokosterone and 20-hydroxyecdysone (which are also isobaric) were detected as sharing both the same mass (m/z 503.30) and the same drift times (Dt = 5.17 ms) which makes these two species difficult to differentiate. No fragmentation
Fig. 1 a MS spectra of each ecdysteroid standard (ponasterone A,
ecdysone, kaladasterone, inokosterone and 20-hydroxyecdysone) at b the specific drift time (Dt) of the sodiated molecular ion. c Ion
images of the five ecdysteroid standards chromatographed by TLC and directly analysed by DESI MSI, with the overlay of the extracted ion chromatograms of the ecdysteroid standards shown below
E. Claude et al.
1 3
was detected for any of the ecdysteroid standards when sub-jected to either low energy or elevated collision energy CID fragmentation. Following the successful detection of each of the standards they were then chromatographed individually on a glass-backed silica gel HPTLC plate, which was then directly mounted onto the DESI stage for imaging. DESI/ MSI analysis was then attempted with no additional sample preparation.
From Fig. 1c, it can be observed that the isobaric species ponasterone A and ecdysone have different Rf values (Rf 0.55 and Rf 0.31, respectively). However, the second pair of iso-baric standards, inokosterone and 20-hydroxyecdysone, were not resolved by TLC as they shared a similar Rf of ca. 0.25. Analysis of Plant Extracts by TLC/DESI/MSI
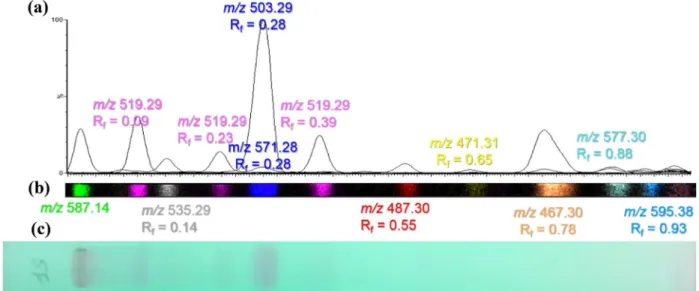
The methanolic S. fimbriata extract was seen to contain a number of components that had been separated by TLC and detected by both UV and DESI/MS (Fig. 2). The
detection of these compounds by UV is possible because the ecdysteroids as a class all contain a 7-en-6-one in the steroidal B ring. This en-one provides a chromophore that confers a strong UV absorbtion at 243 nm, making ecdys-teroids easily visible on TLC plate containing a fluorescent indicator absorbing at 254 nm. Thus, examination of the TLC plate under UV light (λ = 254 nm) revealed a number of intensely absorbing spots with the strongest at an Rf of 0.28. This spot was also detected by DESI–IMS–MS, with the highest signal intensity at m/z 503.29. Based on mass accuracy and Rf, it could therefore be putatively identified as either inokosterone or 20-hydroxyecdysone. A second potential ecdysteroid from the extract was putatively iden-tified as ponasterone A with m/z 487.3 and Rf 0.55.
Interestingly, as shown in Fig. 2, three TLC spots were detected for m/z 519.29 (C27H44O8, Na+), at R
f’s of 0.09, 0.23 and 0.39, corresponding to different isomeric ecdys-teroids. The latter is most probably polypodine B, which is a very common phytoecdysteroid in plants [14], and which has previously been found in Silene extracts. However, according to the Ecdysteroids Database (https ://ecdyb ase. org), at least 24 different isomers for C27H44O8, Na+ have been reported in the literature, as will be discussed further in the next section.
As can be seen from the DESI imaging trace for the
S. fimbriata (SF) extract, at least ten spots were detected
with a significant level of intensity which makes the fin-gerprint more complex and informative compared to the UV254 absorbance TLC fingerprint alone. However, as a number of these spots lack a UV chromophore absorbing at 254 nm they are likely not ecdysteroid-related suggest-ing that they are co-extracted “impurities”.
Table 1 Summary table reporting the m/z of the sodiated molecular ion, retardation factor (Rf) and drift time (Dt) for the five ecdysteroid
standards (ponasterone A, ecdysone, kaladasterone, inokosterone and 20-hydroxyecdysone) analysed by HPTLC DESI IMS/MS
[M + Na]+ Retardation
factor (Rf) Drift time (Dt) (ms) Ecdysone 487.3036 0.31 5.1 Ponasterone A 487.3036 0.55 5.37 Kaladasterone 501.2828 0.61 5.3 Inokosterone 503.2985 0.25 5.17 20-Hydroxyecdysone 503.2985 0.26 5.17
Fig. 2 a Overlay of the DESI-extracted chromatograms of the
differ-ent molecules separated on the TLC plate from extract S. fimbriata with the m/z and Rf for each of the peak, b overlay of the ion images
from the TLC DESI–MS imaging experiment, c UV absorbtion image of the TLC plate before DESI acquisition
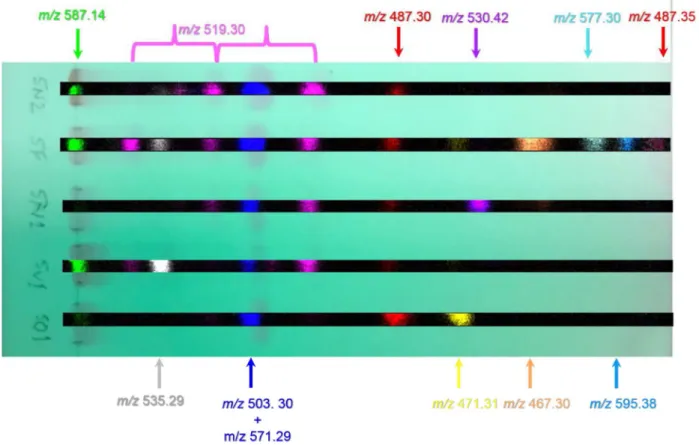
Four other plant extracts were subjected to TLC separa-tion along with the SF extract: one from S, otites (SO1), one from S. viridiflora (SV1) and two obtained from different samples of S. nutans (SN1 and SN2). All of these extracts contained 20-hydroxyecdysone (or one of its isomers) (m/z 503.29, Rf 0.28). Furthermore, as evident from Fig. 3, m/z 487.3, Rf 0.54 (potentially ecdysone or ponasterone A) and a number of ions at m/z 519.3, with Rf values of 0.09, 0.23 and 0.39, respectively were detected in some, but not all, of the extracts, albeit at different levels of intensity. One of these, with the Rf of 0.39 is probably polypodine B which is com-monly found in specimens of this genus [14] whilst candi-dates for the other ions sharing the ions at m/z 519.3 include integristerone A, abutasterone and 20,26-dihydroxyecdysone (the latter in particular (and its derivatives) has been found in these species, e.g. see [15]). In addition, some of the pre-sumed ecdysteroids were detected in only one extract, i.e.
m/z 467.30 (Rf 0.77), was only found in the S. fimbriata extract, whilst m/z 471.31 (Rf 0.65) was only present in the
S, otitis extract, and m/z 530.42 (Rf 0.68) in one of the S.
nutans extracts. The ecdysteroid with m/z 471.31 (Rf 0.65) is most likely to be 2-deoxyecdysone, which has previously been shown to be a major compound for S. otites [9].
As is clear, for all of these samples, more analytes were detected in the DESI MSI traces compared to the equivalent TLC UV absorbtion fingerprints, allowing a better idea of purity with respect to the extracted ecdysteroid fraction to be made.
Benefits of IMS for the analysis of the plant extracts by TLC/DESI/IMS/MSI
As noted in the previous section, under these conditions DESI provides good M + Na ions but little in the way of fragmentation was obtained that would aid structure elu-cidation. One problem is that, in the case of the ions with a m/z of 519.29 there are potentially 24 known isobaric ecdysteroids, including polypodine B. With the addition of the IMS dimension to the HPTLC/DESI/MSI system, a combination of Rf, Dt and m/z, is obtained affording a “3D” separation and detection system for isobaric ecdys-teroids enabling both Rf and Dt to be used to distinguish these molecules when the MS data alone cannot. When a standard for polypodine B was analysed by DESI/IMS one ion mobility peak was detected in the extracted mobilo-gram for m/z 519.29 with a drift time of 5.43 ms (as seen in Fig. 4, a1). In Fig. 4, a2, the extracted mobilogram for
Fig. 3 Overlay of the UV-absorbing trace of the TLC plate before DESI acquisition with the ion images of the different colour coded spots of different m/z for S, otitis (SO1), S. viridiflora (SV1), two S. nutans (SN1 and SN2) and the S. fimbriata plant extracts
E. Claude et al.
1 3
m/z 519.29 for S. fimbriata extract shows three peaks with
Dt’s of 4.7, 5.23 and 5.43 ms, respectively. The peak with the greatest intensity was found to have at Dt of 5.43 ms and can be putatively identified as polypodine B on the basis of both mass spectral and drift time data.
The extracted mobilograms for m/z 519.29 from S, otites (SO1), S. viridiflora (SV1) and S. nutans (SN1 and SN2) plant extracts are shown in Fig. 4b along with the DESI/ IMS imaging trace for each specific drift time. As can be seen, all of these extracts have the most intense IMS peak as having a Dt of 5.43 ms and are also therefore most likely to correspond to polypodine B, which would be consistent with published literature.
The two S. nutans extracts (SN1 and SN2) had the same IMS profile and DESI traces, showing eight different TLC spots sharing the three different drift times. In addition, the mobilograms for the S, otites (SO1) and S. viridiflora (SV1) samples shared an additional IMS peak, with a Dt of 5.23 ms
and a Rf of 0.09, that probably results from the same isomer being present in both extracts between the two plant extracts.
In future studies, the number of ecdysteroid standards for which IMS data have been collected will be increased to aid in identification, in combination with additional HPTLC-derived Rf data.
Conclusions
These preliminary investigations show that the combina-tion of DESI/MS coupled to the imaging of HPTLC plates represents an effective method for the preliminary screen-ing of plant extracts for target compounds such as these ecdysteroids. The methodology avoids the need for either the removal of the stationary phase and its subsequent extraction, or specialized interfaces to elute the compounds of interest directly from the plate. In addition, due to the mechanism of DESI no sample preparation is required prior
Fig. 4 a Extracted mobilograms of m/z 519.29 for a1 polypodine B
(PPB) standard, a2 S. fimbriata plant extract. Extracted mobilograms
of m/z 519.29 combined with DESI IMS MSI trace for b1 S. nutans
S 2 (SN2), b2 S. fimbriata (SF), b3 S. nutans 1(SN1) and b4 S. viridi-flora (SV1) plant extracts
to imaging, unlike e.g., MALDI, where a matrix must be applied prior to analysis. DESI/MSI also produced richer images than provided by the UV data, giving more specific fingerprints for the plant samples and providing an indica-tion of the prevalence of contaminants in the extracts. The addition of the IMS adds an additional, orthogonal, dimen-sion to the overall separation and can enable co-migrating/ isobaric compounds to be resolved, therefore giving a more complete picture of all the molecules presents in a mixture. The differential mobility measurements obtained, can also aid identification.
Funding No external funding was used in conducting this study.
Compliance with Ethical Standards
Conflict of interest The authors declared no conflicts of interest with respect to the research, authorship, and/or publication of this article.
Open Access This article is licensed under a Creative Commons Attri-bution 4.0 International License, which permits use, sharing, adapta-tion, distribution and reproduction in any medium or format, as long as you give appropriate credit to the original author(s) and the source, provide a link to the Creative Commons licence, and indicate if changes were made. The images or other third party material in this article are included in the article’s Creative Commons licence, unless indicated otherwise in a credit line to the material. If material is not included in the article’s Creative Commons licence and your intended use is not permitted by statutory regulation or exceeds the permitted use, you will need to obtain permission directly from the copyright holder. To view a copy of this licence, visit http://creat iveco mmons .org/licen ses/by/4.0/.
References
1. Butenandt A, Karlson P (1954) Über die Isolierung eines Metamorphose-Hormons der Insekten in kristallisierter Form. Zeitschrift für Naturforschung B 9:389–391
2. Lafont R, Harmartha J, Marion-Poll F, Dinan, L, Wilson ID (2002 continuously updated) The Ecysone Handbook. https ://ecdyb ase. org/
3. Isenmann E, Ambrosio G, Joseph JF, Mazzarino M, de la Torre X, Zimmer P, Kazlauskas R, Goebel C, Botrè F (2019) Ecdyster-oids as non-conventional anabolic agent: performance enhance-ment by ecdysterone suppleenhance-mentation in humans. Arch Toxicol 93:1807–1816
4. Wilson ID (1999) The state of the art in thin-layer chromatog-raphy–mass spectrometry: a critical appraisal. J Chromatogr A 856:429–442
5. Griesinger H, Fuchs B, Süß R, Matheis KM, Schulz J, Schiller J (2014) Stationary phase thickness determines the quality of thin-layer chromatography/ matrix-assisted laser desorption and ioni-zation mass spectra of lipids. Anal Biochem 451:45–47
6. Kucherenko E, Kanateva A, Pirogov A, Kurganov A (2019) Recent advances in the preparation of adsorbent layers for thin-layer chromatography combined with matrix-assisted laser desorption/ionization mass-spectrometric detection. J Sep Sci 2:415–430
7. Oellig C, Schwack W (2012) Planar solid phase extraction clean-up for pesticide residue analysis in tea by liquid chromatography– mass spectrometry. J Chromatogr A 1260:42–53
8. Morlock GE, Ristivojevica P, Chernetsova ES (2014) Combined multivariate data analysis of high-performance thin-layer chroma-tography fingerprints and direct analysis in real time mass spectra for profiling of natural products like propolis. J Chromatogr A 1328:104–112
9. Wilson ID, Lafont R, Wall P (1988) TLC of ecdysteroids with off-line identification by fast atom bombardment mass spectrometry directly from the adsorbent. J Planar Chromatogr 1:357–359 10. Paglia G, Ifa DR, Wu C, Corso G, Cooks RG (2010) Desorption
electrospray ionization mass spectrometry analysis of lipids after two-dimensional high-performance thin-layer chromatography partial separation. Anal Chem 82:1744–1750
11. Van Berkel GJ, Tomkins BA, Kertesz V (2007) Thin-layer chromatography/desorption electrospray ionization mass spec-trometry: investigation of goldenseal alkaloids. Anal Chem 79:2778–3278
12. Harry EL, Reynolds JC, Bristow AWT, Wilson ID, Creaser CS (2009) Direct analysis of pharmaceutical formulations from non-bonded reversed-phase thin-layer chromatography plates by des-orption electrospray ionisation ion mobility mass spectrometry. Rapid Commun Mass Spectrom 23:2597–2604
13. Ilbeigi V, Tabrizchi M (2015) Thin layer chromatography-ion mobility spectrometry (TLC-IMS). Anal Chem 87:464–469 14. Mamadalieva NZ, Zibareva LN, Lafont DLN, Saatov Z (2004)
Phytoecdysteroids from the Silene genus. Chem Nat Comp 40:574–578
15. Toth, Simon A, Toth A, Kele G, Hunyadi Z, Bathori A (2008) 26-Hydroxylated Ecdysteroids from Silene viridiflora. J Nat Prod 71:1461–1463
Publisher’s Note Springer Nature remains neutral with regard to