HAL Id: hal-02912527
https://hal-cnrs.archives-ouvertes.fr/hal-02912527
Submitted on 8 Dec 2020
HAL is a multi-disciplinary open access archive for the deposit and dissemination of sci-entific research documents, whether they are pub-lished or not. The documents may come from teaching and research institutions in France or abroad, or from public or private research centers.
L’archive ouverte pluridisciplinaire HAL, est destinée au dépôt et à la diffusion de documents scientifiques de niveau recherche, publiés ou non, émanant des établissements d’enseignement et de recherche français ou étrangers, des laboratoires publics ou privés.
Beyond Freezing: Temporal Expectancy of an Aversive
Event Engages the Amygdalo–Prefronto–Dorsostriatal
Network
Lucille Tallot, Michael Graupner, Lorenzo Diaz-Mataix, Valérie Doyère
To cite this version:
Lucille Tallot, Michael Graupner, Lorenzo Diaz-Mataix, Valérie Doyère. Beyond Freezing: Temporal Expectancy of an Aversive Event Engages the Amygdalo–Prefronto–Dorsostriatal Network. Cerebral Cortex, Oxford University Press (OUP), 2020, 30 (10), pp.5257-5269. �10.1093/cercor/bhaa100�. �hal-02912527�
Beyond freezing: Temporal expectancy of an aversive event engages the
1amydgalo-prefronto-dorsostriatal network
2 3 4Short title: Neural correlates of time in associative learning
5 6
Lucille Tallot1*, Michael Graupner2, Lorenzo Diaz-Mataix3, Valérie Doyère1*
7 8
1Institut des Neurosciences Paris-Saclay (Neuro-PSI), UMR 9197, Université Paris Sud, CNRS,
9
Université Paris Saclay, 91405 Orsay, France 10
2Laboratory of Brain Physiology, CNRS UMR 8118, Université Paris 5, Paris 75005, France
11
3Center for Neural Science, New York University, New York, NY 10003, USA
12 13
*corresponding authors: lucille.tallot@gmail.com, valerie.doyere@u-psud.fr (+33 1 69 15 49
14 87) 15 16 17 18
Keywords: aversive conditioning, rat, interval timing, implicit timing, basolateral amygdala, 19
dorso-medial striatum, prelimbic cortex, 20
Abstract
1
During Pavlovian aversive conditioning, a neutral conditioned stimulus (CS) becomes 2
predictive of the time of arrival of an aversive unconditioned stimulus (US). Using a paradigm 3
where animals had to discriminate between a CS+ (associated with a footshock) and a CS- 4
(never associated with a footshock), we show that, early in training, dynamics of neuronal 5
oscillations in an amygdalo-prefronto-striatal network are modified during the CS+ in a manner 6
related to the CS-US time interval (30s or 10s). This is the case despite a generalized high level 7
of freezing to both CS+ and CS-. The local field potential (LFP) oscillatory power was 8
decreased between 12-30 Hz in the dorsomedial striatum (DMS) and increased between 55-95 9
Hz in the prelimbic cortex (PL), while coherence between DMS, PL and the basolateral 10
amygdala (BA) was increased in the 3-6 Hz frequency range up to the expected time of US 11
arrival only for the CS+ and not for the CS-. Changing the CS-US interval from 30s to 10s 12
shifted these changes in activity towards the newly learned duration. The results suggest a 13
functional role of the amygdalo-prefronto-dorsostriatal network in encoding temporal 14
information of Pavlovian associations independently of the behavioral output. 15
Introduction
1 2
Time and temporal relationships between events are at the heart of our understanding of 3
predictability and associations. Associative conditioning pairs an initially neutral stimulus with 4
a salient unconditioned stimulus (US). The neutral stimulus will acquire the properties of a 5
conditioned stimulus (CS) and will come to evoke conditioned responses (CR) that are related 6
to the natural responses to the US (Pavlov 1927). The length of the CS-US interval may be an 7
essential parameter of the CS-US association. Indeed, Pavlov noticed that animals would start 8
responding toward the end of the CS, just before the US was presented, in a phenomenon he 9
called “inhibition of delay”, a response that was shifted in time when changing the CS-US 10
interval. The emergence of a precise temporally organized response related to the expectancy 11
of US arrival may take hundreds of trials (Ohyama and Mauk 2001; Boulanger-Bertolus et al. 12
2015; Dallérac et al. 2017). However, the CS-US interval is learned in as little as one 13
presentation at least in an aversive setting (Davis et al. 1989; Díaz-Mataix et al. 2013) and the 14
temporal aspect of the learning experience might be fundamental for learning the association 15
(Balsam and Gallistel 2009). As such, neural correlates of CS-US interval encoding should be 16
present from the very beginning of learning. 17
The neurobiological basis of interval timing (i.e. the encoding of durations from a few 18
hundred milliseconds to several minutes) is still debated, in particular because of the paucity of 19
neurophysiological experiment dedicated to assessing timing correlates in animals (Tallot and 20
Doyère, in press). Many brain areas have been associated with interval timing, both in humans 21
(Coull et al. 2011) and in animal models (Buhusi and Meck 2005), but structures such as the 22
prefrontal cortex (PFC) and the striatum are reliably mentioned in the literature. Large lesions 23
of the striatum (Meck 2006) as well as degeneration of striatum (Paulsen et al. 2004; Rowe et 24
al. 2010; Höhn et al. 2011) produce strong deficits in a timing task, whereas more focal lesions 25
do not seem to have such an effect (Aparicio et al. 2005). Lesions of the PFC impair the animal’s 1
ability to time several durations at once and to time trace durations, i.e. when there is a gap 2
between CS termination and the US (Olton et al. 1988; Pang et al. 2001; Meck and MacDonald 3
2007). A cortico-striatal network is the major component of a current model of timing, the 4
striatal beat frequency (SBF) model (Matell and Meck 2000, 2004). In this model, the medium 5
spiny neurons of the striatum detect coherent activation of multiple cortical oscillators, which 6
represent passing time, and encode different intervals. However, many models of timing exist 7
and none have been proven or disproven at the moment. Some are based on clock-like 8
mechanisms (like the SBF and TopDDM (Time Adaptative Opponent Poisson drift-diffusion 9
model, Simen et al. 2011; Balci and Simen 2016) while others are based on monotonic variation 10
of activity through the timed duration (like MTS (Multi-timescale Model, (Staddon and Higa 11
1999) and TILT models (Timing from Inverse Laplace transform, (Shankar and Howard 2012). 12
Recently, a role for the amygdala in encoding the CS-US interval has been explored 13
(Díaz-Mataix et al. 2014), as this brain structure is essential for learning the aversive CS-US 14
association (Herry and Johansen 2014). In fact, in a Pavlovian aversive conditioning, rats’ 15
amygdala detects a change in CS-US interval after a single CS-US pairing (Díaz-Mataix et al. 16
2013). However, lesions of the amygdala do not seem to have an effect on classical temporal 17
tasks, like the peak interval task (Olton et al. 1987). 18
The striatum, prefrontal cortex and amygdala form a monosynaptic network, with the 19
dorsomedial striatum (DMS) receiving inputs from both the basolateral amygdala (BA) and the 20
prelimbic cortex (PL) (Voorn et al. 2004; Gabbott et al. 2005; Guo et al. 2015), while BA and 21
PL are bi-directionally connected to one another (McDonald 1991a, 1991b; Courtin et al. 2013; 22
Hart et al. 2014; Felix-Ortiz et al. 2015). Previous work from our lab has evidenced neural 23
correlates of temporal behavior between DMS and BA in a well-trained temporal aversive 24
outset of learning, when temporal rules are learned but temporal behavior is not yet fully 1
expressed, is not known. Nor is it known whether the prefrontal cortex is part of this functional 2
network in associative learning timing. To address these questions, we searched for correlates 3
of CS-US duration in local field potentials (LFPs) recorded simultaneously from PL, BA and 4
DMS in rats, early in training of a differential aversive Pavlovian conditioning. We 5
hypothesized that time/frequency analyses between the members of this network would 6
evidence modulation in specific frequency bands that would be time-locked to the learned CS-7
US duration after few trials of conditioning. 8
9 10
Material and Methods
1 2
Subjects
3
Experiments were carried out on 43 male Sprague-Dawley rats (Harlan Laboratories, 4
France) in accordance with the guidelines of the European Community Council Directives of 5
September 22nd 2010 (2010/63/UE) and the French National Committee (2013/118) for the 6
care and use of laboratory animals. These experiments have been approved by the French 7
Ministry of Research. All efforts were made to minimize the number of animals used and their 8
suffering. Rats were housed in standard laboratory cages by pairs and maintained on a 12/12hr 9
regular light/dark cycle with ad libitum access to food and water. 10
11
Surgery
12
Animals were anesthetized with Ketamine (75 mg/kg, i.p.) and Xylazine (50 mg/kg, 13
i.p.). Tolfedine (0.01ml/100g, s.c.) and atropine (0.01mg/kg, i.m.) were given prior to surgery. 14
Recording electrodes were made from var-insulated nichrome wire (68µm diameter). Wires 15
were sharpened (0.7-1.0 MΩ) and placed in a 33 Gauge cannula (PlasticOne, Paris, France), 16
the tip extending 1mm outside of the cannula. Single recording electrodes were implanted in 17
three brain area in the right hemisphere of each rat: in the dorsomedial striatum (DMS, AP: 18
1.0mm; L: 2.2mm; DV: 4mm), in the prelimbic cortex (PL, AP: 3.0mm; L: 0.8mm; DV: 19
3.3mm) and in the basolateral amygdala (BA, AP -2.7mm, L 4.7mm, DV 8.5mm) [50]. 20
Reference and ground electrodes, made of a ball of silver wire, were placed epidurally over the 21
cerebellum for the ground and over the visual cortex for the reference. The reference and ground 22
electrode have a large recording surface, a low impedance and are placed above the dura 23
allowing for recording of a very large area around the electrodes, therefore being useful to 24
remove any general noise and muscle artefacts. Electrodes were assembled into a circular plug 25
(Ginder Scientific, Canada, reference GS09PLG-220) and fixed on the skull with dental acrylic 1
cement with the help of four screws. An antibiotic (Convenia Zoetis 0.1mL per rat, s.c.) was 2
injected at the end of the surgery. After the surgery the rats were housed individually in 3
standard laboratory cages and allowed to recover for one week. 4
5
Behavioral Apparatus and Stimuli
6
Behavioral training took place in a set of two identical conditioning chambers (30 x 25 x 7
60cm, Coulbourn Instruments, USA), equipped with a shock floor and a speaker, all placed in 8
a sound attenuating enclosure with a ventilation fan (60dB background noise). Behavioral 9
protocols were controlled by Graphic State software v3.03 (Coulbourn Instruments, USA). An 10
infrared digital camera, mounted in front of each chamber, allowed us to record behavior for 11
later scoring. Rats were allowed to freely explore the chamber before each behavioral procedure 12
for a variable amount of time. 13
Animals underwent differential auditory Pavlovian conditioning with a 1 kHz CS- (never 14
associated with a shock) and a 7 kHz CS+ (associated with a shock), both 60s long and 20 dB 15
above background noise. We used two different contexts during the experiment: the 16
conditioning context was a square box with a metallic grid floor and a white house light, 17
whereas for the recording context, we changed the shape of the box by adding a wall to make a 18
non-square shape as well as adding a smooth plastic floor, red house light (dimmer than the 19
white house light) and a peppermint smell. The duration of each daily session ranged from 20 30min to 1h15. 21 22 Behavioral paradigm 23
Animals were first habituated over two days to the two stimuli in the recording context, 24
groups of animals (n of G30s = 22 and n of G10s = 21). Twenty-four hours later, they were 1
conditioned in the conditioning context by presentation of 10 CS+ with a US either at 30s (for 2
the rats of group G30s) or at 10s (for the rats of group G10s) after the onset of the CS+, and 10 3
CS-, given in a pseudo-random order. The US was a foot-shock of 0.8mA lasting 1s. The 4
animals were tested for long-term memory (LTM), 24h later, by presenting 9 CS+ and 9 CS- 5
without reinforcement in the recording context. The animals from G30s were reconditioned by 6
presenting 2 CS-US pairings and then tested again without reinforcement on the day after, with 7
9 CS+ and 9 CS-. An additional session in extinction (without reinforcement) was run 24h later 8
with 9 CS+ and 9 CS-. We observed the same modulations in activity as in the LTM session 9
but with a decreased amplitude. Then, 24h later, the rats were re-conditioned with a CS-US 10
interval shifted to 10s, by presenting 10 CS+ with US and 10 CS-, and tested the day after with 11
9 CS+ and 9 CS- without reinforcement (LTM-shift session). 12
CS+ and CS- were always presented pseudo-randomly (while making sure that there was 13
never more than 3 consecutive presentations of the same CS) with an average inter-trial interval 14
(ITI) of 3 min (using the following durations 120s, 130s, 150s, 180s, 200s, 210s, 240s, 300s), 15
making the conditioning sessions 1h25 long, the habituation sessions 45min long and the test 16
sessions 1h15 long. This experiment was performed in five series to reach a large enough 17
number of rats, with 8-10 rats in each set. 18
19
Electrophysiology
20
Animals were connected to the recording setup during all sessions but were not recorded 21
from during the conditioning sessions (because of the artefacts from the foot-shocks). During 22
recorded sessions, LFPs were amplified 100x (Grass amplifiers, model P511), band-pass 23
filtered (0.3Hz-1kHz), line filtered around 50 Hz and acquired at 10kHz in Spike2 via a CED 24
1
Multitaper time-frequency analysis
2
All recordings from electrodes correctly placed in the targeted brain area were analyzed, 3
see the table in Figure 1 for the number of rats with a correctly placed electrode in each targeted 4
region. All analyses routines were implemented in custom written Python scripts, as in Dallérac 5
et al. (2017). In short, the 30s pre-CS period and the 60s CS period were extracted from raw 6
LFP traces for the BA, PL and DMS. The PSD and COH were computed based on 3-s windows 7
centered on each time-point, and time-points were calculated every 0.25s (i.e. the 3s analysis 8
window was advanced in 0.25s steps in the interval [-30,60] s). The PSD was calculated using 9
an adaptive weighted multitaper method. The coherence between LFP signals was computed 10
from the FFT and the weights of the multitaper spectrum estimation. The analysis parameters 11
of the multitaper method were as follows: time-bandwidth product = 3.5, number of used tapers 12
= 7. Artifacts, generated from movements of the animal during recordings, appeared as large 13
deflections in the raw LFP traces. Epochs with more than 60% artifacts (data above a threshold 14
of three standard deviations) were excluded before calculating the average PSD. 15
Significant (p<0.05) changes in the mean PSD and COH from baseline (based on the 16
30s pre-CS period) were determined using a non-parametric cluster-level 1 sample t-test (as 17
described in Maris and Oostenveld 2007 and implemented by Gramfort et al. 2013): two-way 18
for the PSD, and one-way (as an increase) for the coherence. The procedure uses a cluster 19
analysis with permutation test for calculating corrected p-values. Randomized data are 20
generated with random sign flips (+1 or −1) for each data instance. If the data distribution on 21
null hypothesis has zero mean, a random sign flip will not alter the mean. Thus permuting 22
enables to test non-parametrically the null hypothesis. We used 1000 permutations for our 23
analysis and t-threshold equivalent to p < 0.05. The statistic was thresholded on both side of 24
the distribution. Non-parametric cluster tests were performed using the Python 1
implementation of the MNE software package (https://martinos.org/mne/stable/index.html). 2
PSD and coherence are presented as z-scores with respect to the mean and the baseline per 3
frequency band during the pre-stimulus interval ([−30, 0] s). To reduce the possibility of sub-4
threshold effects, we verified that changing the threshold to p<0.1 did not visibly change the 5
observed results. We never observed any significant modulation of coherence in the 55-95 Hz 6
range and therefore are not showing those results. 7
8
Measurement of Freezing Behavior
9
Freezing was used to measure the conditioned emotional aversive response, and was 10
defined as the cessation of all movements, with the exception of respiration-related movement 11
and non-awake/rest body posture, or the presence of very slow threat assessment behavior. 12
Freezing was hand-scored by an observer blind to the group of the rat and to the type of the CS. 13
Freezing was scored in a continuous manner and then binned in 1s epochs to look at temporal 14
evolution. In all sessions the freezing to context was scored during the 60s prior to the first CS 15
presentation. 16
Two-way ANOVA was performed for G10s rats and a Mixed-effects model for G30s 17
rats (as there are two rats missing in LTM-shift compared to the other sessions) comparing 18
Session vs. CS type. Post-hoc comparisons were done using Bonferroni’s method. These 19
analyses were done using GraphPad Prism v8.3. 20 21 22 23 Histology 24
Upon completion of the experiments, rats were perfused with 4% paraformaldehyde. 1
Brains were removed and post-fixed in 4% PFA and cryoprotected using an 18% sucrose 2
solution. Coronal sections 40µm thick were then cut on a microtome and stained with thionin 3
for identification of recording sites. 4
5
Data availability
6
The data and the code used for analyses that support the findings of this study are 7
available from the corresponding author upon reasonable request. 8 9 10 Results 11 12
Electrodes aiming at the prelimbic cortex (PL), the dorsomedial striatum (DMS) and the 13
basolateral amygdala (BA) were implanted unilaterally in adult rats, and only the recordings 14
from the ones correctly positioned were analyzed (Fig. 1). We recorded LFPs from these 15
animals 24h before (habituation) and 24h after (long-term memory test, LTM) they were 16
conditioned in an aversive Pavlovian paradigm. In a single conditioning session, the animals 17
had to discriminate between a CS+ that was associated with a footshock US and a CS- that was 18
never associated with the US. Depending on the group, the US was presented 10s (G10s) or 30s 19
(G30s) after the onset of the CS+ (schematics of the protocols for both groups can be seen in 20
Fig.2 A and B panels). Both CS+ and CS- were always 60s long. Having non-co-terminating 21
CS+ and US makes the time since the onset of the CS+ the only informative clue to the arrival 22
of the US. The CS-US interval was then shifted to 10s for the G30s rats and LFPs were recorded 23
again during another long-term memory test 24h later (LTM-shift session). 24
1
Figure 1: Placement of electrodes in all three targeted brain areas for the rats from G30s and 2
G10s groups. Schemes are taken from Paxinos and Watson rat brain atlas (2007), with written 3
on top the antero-posterior distance (in mm) from bregma. Each filled dot represents one 1
electrode correctly placed in the structure for G10s rats and each hollow dot represents the same 2
for G30s rats. Also presented are raw traces of data for each brain structure from one rat before 3
and after the onset of the CS+. The table at the bottom gives the number of animals with an 4
electrode in the correct placement for each brain area and combinations for coherence 5
calculations for each group of rats. BA = basolateral amygdala, DMS = dorsomedial striatum, 6
and PL = prelimbic cortex, CS = conditioned stimulus. 7
8
Increased freezing in long-term memory (LTM) test shows aversive learning but also
9
generalization
10 11
To determine whether rats learned the association, we compared the freezing levels 12
before (second session of habituation, HAB) and 24h after conditioning (Long term memory 13
test, LTM). Conditioning resulted in a significant differential increase of freezing for both G10s 14
group (Fig. 2C, Anova 2-way, [HAB vs LTM] Session effect: F1,20=53.30 p<0.0001; [CS+ vs
15
CS-] CS type effect: F1,20=16.33 p=0.0006; Session x CS type Interaction: F1,20= 10.22
16
p=0.0045) and G30s group (Fig. 2E, Mixed-effects model with Geisser-Greenhouse correction,
17
Session effect: F2.297,48.24=44.22 p<0.0001; CS type effect: F1,21=3.53, p=0.0742 n.s.;
18
Interaction: F2.561,50.37= 4.571 p=0.0093). Post-hoc Bonferroni analyses revealed that the
19
animals learned that the CS+ predicted the arrival of an aversive event (HAB vs. LTM: 20
p<0.0001 for both groups). Freezing was in general high during the whole session, including
21
during the it is. 22
23
However, there was also a strong increase in freezing during the CS- (p<0.0001 for both 24
G10s and G30s groups), indicating that the rats generalized their aversive learning to both CSs 25
even though the CS- had never been associated with the US. Surprisingly, CS- freezing during 1
LTM was even higher than CS+ freezing for G10s (p = 0.0003) but was at a similar level for 2
G30s (p>0.99), this cannot be explained by a frequency effect as we would then expect the 3
same effect in both groups. As we wanted to ensure a strong learning in only 12 trials, we used 4
a strong US (0.8mA for 1s), which has usually been associated with generalization of the 5
aversive learning (Ghosh and Chattarji, 2014). Looking at the temporal course of freezing 6
showed that it raised fast after CS onset and remained at a high level during the entire 60s for 7
both CS+ and CS- in G10s (Fig 2D) and G30s (Fig 2F and 2G) rats. 8
1
Figure 2: Freezing behavior
2
(A) Schematic of the experiment for G10s rats. There are 24h between each step. Number of CS+ and CS-
3
are indicated in each session. CS+ were reinforced only on conditioning and reconditioning sessions.
1
(C) Freezing behavior for rats trained in a differential conditioning paradigm with a US given 10s after the
2
onset of the 60-s CS+ (group G10s). Bar graph of the percentage of freezing (mean + SEM) of the rats either
3
during the 60s of the CS+ or the 60s of the CS- for both habituation (HAB, empty bars) and long-term
4
memory (LTM, filled blue bars) sessions.
5
(D) Average percentage of freezing (mean + SEM) for both CS+ and CS- per 1-s bins across the duration of
6
the CS+ (full line) and CS- (dashed line) during LTM session for G10s rats (in blue).
7
(E) Same as (C) for the rats trained in a differential conditioning paradigm with a US given 30s after the
8
onset of the 60-s CS+ (group G30s) with habituation (HAB, empty bars), long-term memory (LTM, filled
9
red bars), extinction (bars filled with a stripe pattern) and shift to 10s (LTM-shift, filled blue bars) sessions.
10
(F) Same as (D) for rats from G30s for LTM (in red).
11
(G) Same as (D) for rats from G30s for LTM-shift (in blue).
12 13
Low and high frequency oscillations are modulated by learning a 10s CS-US interval (data
14
from the G10s group)
15 16
Searching for neural correlates of memory of CS-US interval, we have performed 17
time/frequency analyses for every structure and every pair of structures from 1 Hz to 100 Hz, 18
as in our previous study (Dallérac et al. 2017). To extract changes specifically elicited by the 19
CSs, we normalized LFP activity during CS+ or CS- to their respective pre-CS baseline for 20
each individual trial before averaging. Such normalization permits to extract modulations 21
specifically elicited by the CS (which may underlie the processing of the CS-US interval) from 22
any change in baseline levels due to learning and/or daily repetition of sessions. 23
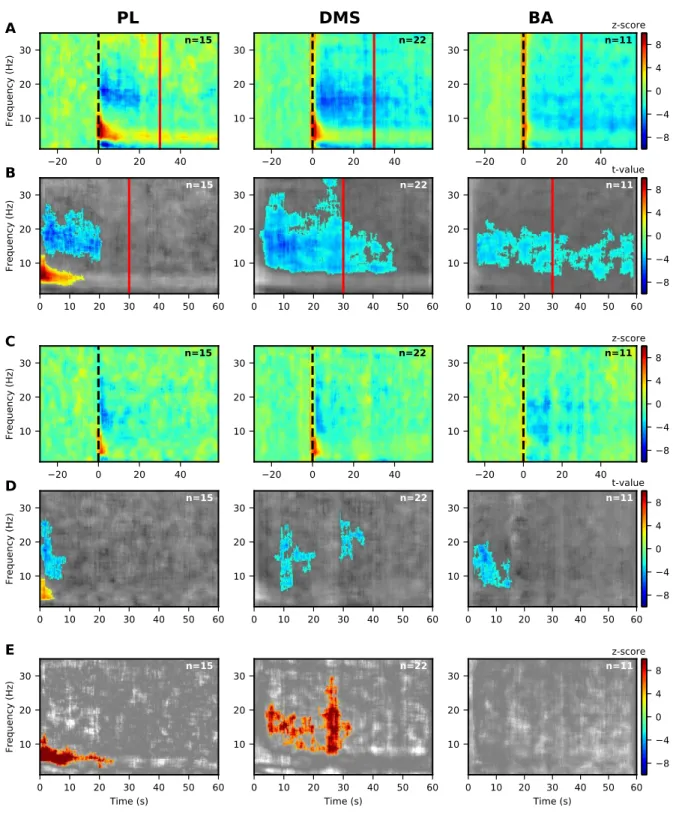
When looking at Power Spectrum Densities (PSD) across time in the normalized heat 24
plots, only two modulations of neural oscillations were found for the G10s rats. At low 25
frequencies, we observed a decrease in the 9-30 Hz (beta) range in the DMS compared to the 26
baseline (Fig. 3A, middle panel). Interestingly, this decrease in LFP beta power was significant 27
from the onset of the CS+ up to after the time of arrival of the US (~12s) after which it returned 28
to baseline level (Fig. 3B, middle panel). A decrease was also observed during the CS- (Fig. 29
3C and D, middle panels). There were no significant modulations in low frequency bands for 1
PL and BA as well as no significant differences between CS+ and CS-. 2
3
Figure 3: Significant modulations of LFP PSD during LTM for G10s for prelimbic cortex (PL),
dorsomedial-4
striatum (DMS) and basolateral amygdala (BA) for 1-35 Hz.
5
(A, B) Modulations of LFP PSD for CS+. The expected time of arrival of the US is represented with a
1
continuous vertical blue line. Left panels correspond to the prelimbic cortex (PL), the middle panels
2
correspond to the dorsomedial-striatum (DMS) and the right panels correspond to the basolateral amygdala
3
(BA). Number of animals in each spectrogram is given in the upper right corner. A common scale bar for all
4
three panels in a row is present on the right side.
5
(A) Power spectrum density (PSD) normalized to the 30s before CS presentation as a z-score (onset of the
6
CS at 0s is marked by a dashed black line).
7
(B) Non-parametric cluster analysis reveals significant (p < 0.05) power spectrum increases (in red) or
8
decreases (in blue) as t-values, compared to the baseline level of activity (30s before CS presentation). The
9
gray color code depicts non-significant changes (note the different timescale, which encompasses the
10
stimulus period only).
11
(C, D) Same as (A, B) but for the CS-.
12
(E) Non-parametric cluster analysis to reveal significant differences between CS+ and CS- trials. The gray
13
color code depicts non-significant changes.
14
BA = basolateral amygdala, DMS = dorsomedial striatum, and PL = prelimbic cortex, CS = conditioned
15
stimulus, and US = unconditioned stimulus.
16 17
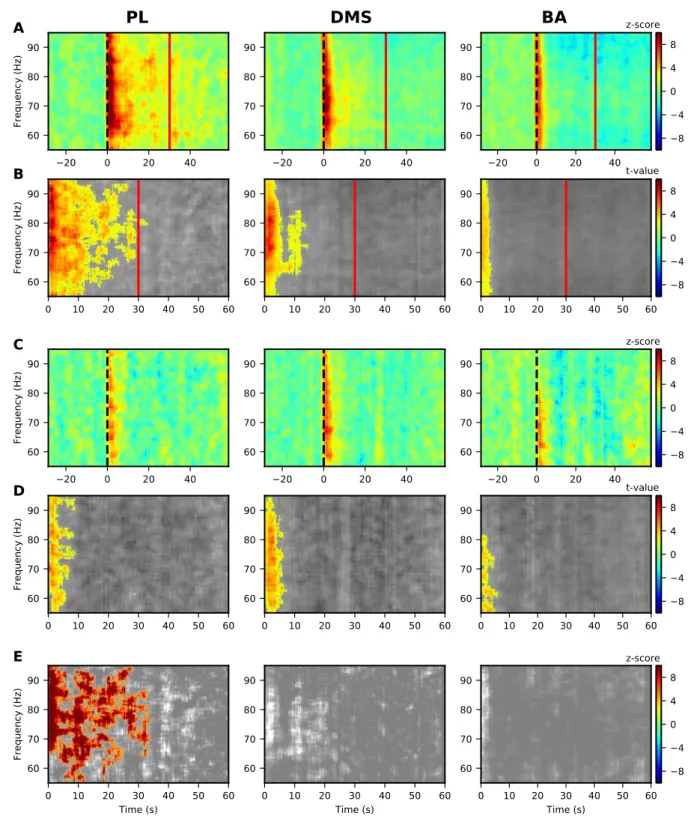
In a higher frequency range (gamma), we observed modulations in a 55-95 Hz band in 18
the PL. A significant increase in LFP power was obtained for both CSs. This increase was 19
maintained for the duration of the CS-US interval only for the CS+ (Fig. 4B, left panel), and 20
not for the CS- (Fig. 4D, left panel) where the increased PSD was present only at the CS onset. 21
However, there were no significant differences between CS+ and CS-. 22
1
Figure 4: Significant modulations of LFP PSD during LTM for G10s for prelimbic cortex (PL),
dorsomedial-2
striatum (DMS) and basolateral amygdala (BA) for 55-95 Hz.
3
(A, B) Modulations of LFP PSD for CS+. The expected time of arrival of the US is represented with a
4
continuous vertical blue line. Left panels correspond to the prelimbic cortex (PL), the middle panels
5
correspond to the dorsomedial-striatum (DMS) and the right panels correspond to the basolateral amygdala
(BA). Number of animals in each spectrogram is given in the upper right corner. A common scale bar for all
1
three panels in a row is present on the right side.
2
(A) Power spectrum density (PSD) normalized to the 30s before CS presentation as a z-score (onset of the
3
CS at 0s is marked by a dashed black line).
4
(B) Non-parametric cluster analysis reveals significant (p < 0.05) power spectrum increases (in red) or
5
decreases (in blue) as t-values, compared to the baseline level of activity (30s before CS presentation). The
6
gray color code depicts non-significant changes (note the different timescale, which encompasses the
7
stimulus period only).
8
(C, D) Same as (A, B) but for the CS-.
9
(E) Non-parametric cluster analysis to reveal significant differences between CS+ and CS- trials. The gray
10
color code depicts non-significant changes.
11
BA = basolateral amygdala, DMS = dorsomedial striatum, and PL = prelimbic cortex, CS = conditioned
12
stimulus, and US = unconditioned stimulus.
13 14
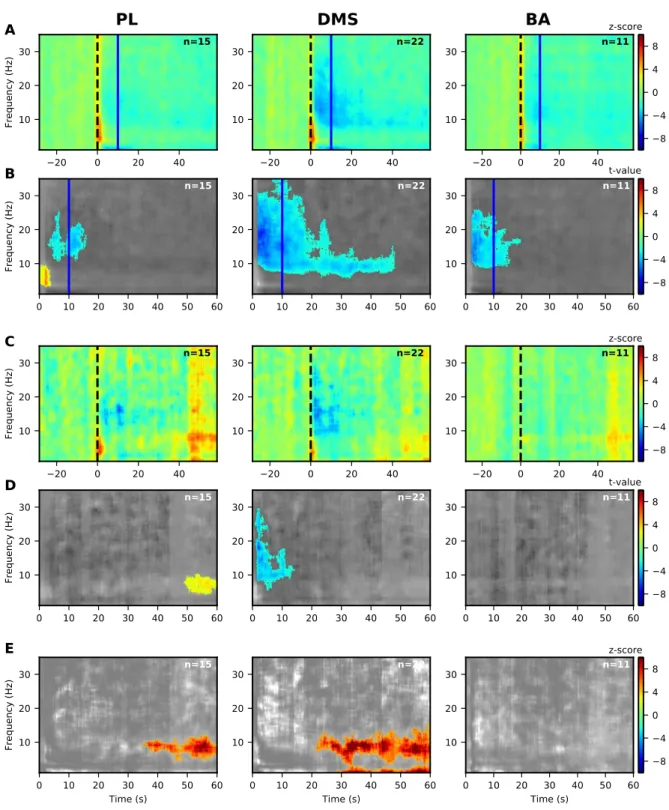
With regard to coherence, all pairs of structures showed significant increases in the low 15
frequency range during the CS+ (Fig. 5B) that were not observed during the CS- (Fig. 5D) 16
except for a small significant increase in coherence at the very onset for BA-DMS (Fig. 5D, left 17
panel). Two separate frequency bands, one 3-6 Hz and the other 6-9 Hz, were clearly visible 18
for PL-BA and BA-DMS (Fig. 5A and B, left and right panels). While the increased coherence 19
in the 6-9 Hz band was present at the onset of the CS+, the increased coherence in the 3-6 Hz 20
band was maintained over the length of the CS-US interval up to around 15s. For the coherence 21
between PL and DMS, an increase in a single 3-9 Hz frequency band was observed up to around 22
15s (Fig. 5B, middle panel). When looking at significant differences between CS+ and CS-, we 23
can see an increase in coherence between PL and DMS around 5 to 15s. Thus, the duration of 24
the increased coherence in the 3-6Hz or 3-9Hz band between the three brain areas lasted up to 25
a few seconds after the expected US arrival time, this imprecision could represent the temporal 1
incertitude of the subjects. 2
3
Figure 5: Significant modulations of coherence during LTM for G10s between prelimbic cortex (PL),
4
dorsomedial-striatum (DMS) and basolateral amygdala (BA) for 1-35 Hz.
(A, B) Modulations of coherence for CS+. The expected time of arrival of the US is represented with a
1
continuous vertical blue line. Left panels correspond to the prelimbic cortex (PL), the middle panels
2
correspond to the dorsomedial-striatum (DMS) and the right panels correspond to the basolateral amygdala
3
(BA). Number of animals in each spectrogram is given in the upper right corner. A common scale bar for all
4
three panels in a row is present on the right side.
5
(A) Coherence between 1 and 35 Hz normalized to the 30s before CS presentation as a z-score (onset of the
6
CS at 0s is marked by a dashed black line).
7
(B) Non-parametric cluster analysis reveals significant (p < 0.05) power spectrum increases (in red) or
8
decreases (in blue) as t-values, compared to the baseline level of activity (30s before CS presentation). The
9
gray color code depicts non-significant changes (note the different timescale in the right panel, which
10
encompasses the stimulus period only).
11
(C, D) Same as (A, B) but for the CS-.
12
(E) Non-parametric cluster analysis reveals significant differences between CS+ and CS- trials. The gray
13
color code depicts non-significant changes.
14
BA = basolateral amygdala, DMS = dorsomedial striatum, and PL = prelimbic cortex, CS = conditioned
15
stimulus, and US = unconditioned stimulus.
16 17
To know whether those modulations were due to learning or to the presentation of our 18
two sounds, we looked at PSD and coherence level during the habituation sessions. During 19
habituation for G10s rats, the two CSs used did not elicit any significant modulation in PSD or 20
coherence in our structures and frequency bands of interest (Fig. S1 and S2). Baseline activity 21
(i.e. the activity before each CS presentation) was in some cases slightly modified after 22
conditioning (Fig. S1 and S2), but that may have simply resulted from repetition of session 23
rather than conditioning per se. We did not observe many significant differences between CS+ 24
and CS- in this group of rats, this could be due to the generalization of the aversive and/or 25
temporal learning between CS+ and CS-. It could also be due to the merging of the temporal 26
there were few significant modulations of PSD and coherence during the CS- compared to 1
during the CS+. 2
3
Interestingly, the temporal modulations of LFP activity observed did not follow the 4
same pattern as the freezing (Fig. 2A). Looking at the temporal patterns of freezing, we 5
observed that freezing increased quickly from their onset for both CS+ and CS-, and remained 6
at a high level throughout the CS duration. The important implication here, is that the changes 7
in neural activity observed during the CS+ seems to represent the learning of CS-US interval 8
independently from the motor behavioral output of the animals. 9
10
Similar bands of activity are modulated by learning a 30s CS-US interval (data from the
11
G30s group)
12 13 14
Although the modulations of LFP activity observed in G10s group suggest they were 15
related to the timed expectancy of the US arrival, they could as well reflect the learning of the 16
association independently of the timing of the CS-US interval. If time-related, the same 17
modulations should be observed in G30s rats albeit locked to the longer duration. We thus 18
analyzed the PSD and coherence in the G30s rats. Looking at the PSD, a significant decrease 19
in 9-30 Hz LFP power was observed in the DMS for the CS+ (Fig. 6B, middle panel), which 20
was significantly more important than during the CS- from the onset to the expected arrival of 21
the US (Fig. 6E, middle panel). This was similar to what we observed in G10s rats but locked 22
to a longer duration. In contrast to what was observed in group G10s, we observed a significant 23
decrease in 9-30 Hz LFP power in PL (from 0 to 20s) and in BA (during the whole CS+)(Fig. 24
6A-B, left and right panels). These modulations were not significant compared to the CS- (Fig. 25
6E, left and right panels). We also observed an increase in 3-9Hz LFP power in the PL cortex 26
which was significantly higher during the CS+ from the onset to around 25s compared to the 27
1
Figure 6: Significant modulations of LFP PSD during LTM for G30s for prelimbic cortex (PL),
dorsomedial-2
striatum (DMS) and basolateral amygdala (BA) for 1-35 Hz.
3
(A, B) Modulations of LFP PSD for CS+. The expected time of arrival of the US is represented with a
4
continuous vertical red line. Left panels correspond to the prelimbic cortex (PL), the middle panels
(BA). Number of animals in each spectrogram is given in the upper right corner. A common scale bar for all
1
three panels in a row is present on the right side.
2
(A) Power spectrum density (PSD) normalized to the 30s before CS presentation as a z-score (onset of the
3
CS at 0s is marked by a dashed black line).
4
(B) Non-parametric cluster analysis reveals significant (p < 0.05) power spectrum increases (in red) or
5
decreases (in blue) as t-values, compared to the baseline level of activity (30s before CS presentation). The
6
gray color code depicts non-significant changes (note the different timescale in the right panel, which
7
encompasses the stimulus period only).
8
(C, D) Same as (A, B) but for the CS-.
9
(E) Non-parametric cluster analysis reveals significant differences between CS+ and CS- trials. The gray
10
color code depicts non-significant changes.
11
BA = basolateral amygdala, DMS = dorsomedial striatum, and PL = prelimbic cortex, CS = conditioned
12
stimulus, and US = unconditioned stimulus.
13 14
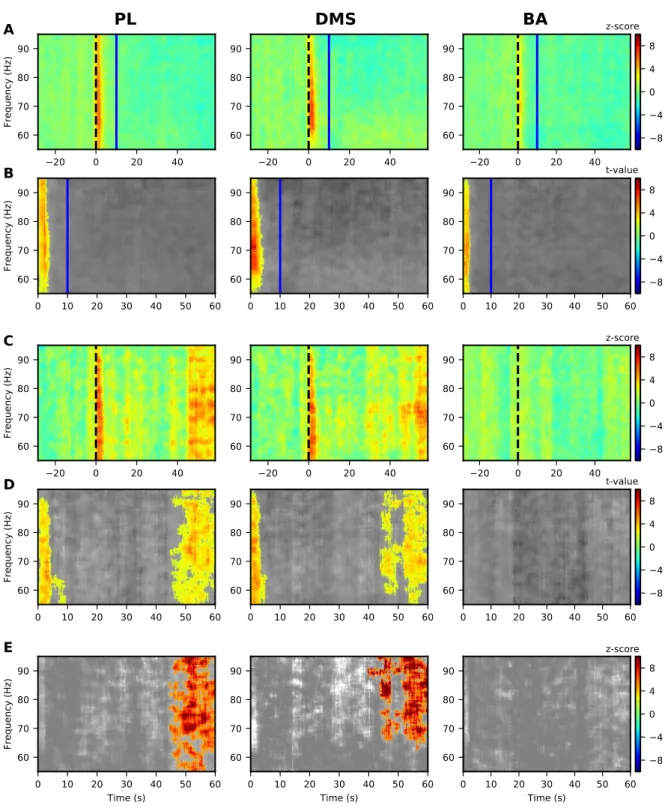
There also was an increase in 55-95 Hz LFP power in the PL during the CS-US interval 15
for the CS+ (Fig. 7A-B, left panel) but only at the CS onset for the CS- (Fig. 7C-D, left panel) 16
and this was significantly different between CS+ and CS- (Fig. 7E). We also observed onset 17
activity in the DMS and BA for both CS+ (Fig 7A-B, middle and right panels) and CS- (Fig 18
7C-D, middle and right panels). 19
1
Figure 7: Significant modulations of LFP PSD during LTM for G10s for prelimbic cortex (PL),
dorsomedial-2
striatum (DMS) and basolateral amygdala (BA) for 55-95 Hz.
3
(A, B) Modulations of LFP PSD for CS+. The expected time of arrival of the US is represented with a
4
continuous vertical red line. Left panels correspond to the prelimbic cortex (PL), the middle panels
5
correspond to the dorsomedial-striatum (DMS) and the right panels correspond to the basolateral amygdala
(BA). Number of animals in each spectrogram is given in the upper right corner. A common scale bar for all
1
three panels in a row is present on the right side.
2
(A) Power spectrum density (PSD) normalized to the 30s before CS presentation as a z-score (onset of the
3
CS at 0s is marked by a dashed black line).
4
(B) Non-parametric cluster analysis reveals significant (p < 0.05) power spectrum increases (in red) or
5
decreases (in blue) as t-values, compared to the baseline level of activity (30s before CS presentation). The
6
gray color code depicts non-significant changes (note the different timescale in the right panel, which
7
encompasses the stimulus period only).
8
(C, D) Same as (A, B) but for the CS-.
9
(E) Non-parametric cluster analysis reveals significant differences between CS+ and CS- trials. The gray
10
color code depicts non-significant changes.
11
BA = basolateral amygdala, DMS = dorsomedial striatum, and PL = prelimbic cortex, CS = conditioned
12
stimulus, and US = unconditioned stimulus.
13 14
Low frequency coherence was increased between PL-DMS, PL-BA and BA-DMS 15
during the CS+ (Fig. 8B), while very little significant modulation was observed during the CS- 16
(Fig. 8D). These increases in coherence during the CS+ lasted for 20 to 40s, depending on the 17
structures involved, thus bracketing the duration of the CS-US interval learned. The presence 18
of the two 3-6Hz and 6-9Hz sub-bands was less visible here but can still be delineated (see Fig 19
8B left panel for BA-DMS and Fig 8B right panel for PL-BA), seemingly more as a gradual 20
shift from 6-9 Hz to 3-6 Hz. Only the increased coherence between PL and DMS was 21
significantly different between CS+ and CS- (Fig. 8E, middle panel). Those coherence 22
modulations were very similar to the ones observed in G10s rats but shifted to a longer duration. 23
1
Figure 8: Significant modulations of coherence during LTM for G30s between prelimbic cortex (PL),
2
dorsomedial-striatum (DMS) and basolateral amygdala (BA)
3
(A, B) Modulations of coherence for CS+. The expected time of arrival of the US is represented with a
4
continuous vertical blue line. Left panels correspond to the prelimbic cortex (PL), the middle panels
5
correspond to the dorsomedial-striatum (DMS) and the right panels correspond to the basolateral amygdala
(BA). Number of animals in each spectrogram is given in the upper right corner. A common scale bar for all
1
three panels in a row is present on the right side.
2
(A) Coherence normalized to the 30s before CS presentation as a z-score (onset of the CS at 0s is marked by
3
a dashed black line).
4
(B) Non-parametric cluster analysis reveals significant (p < 0.05) power spectrum increases (in red) or
5
decreases (in blue) as t-values, compared to the baseline level of activity (30s before CS presentation). The
6
gray color code depicts non-significant changes (note the different timescale in the right panel, which
7
encompasses the stimulus period only).
8
(C, D) Same as (A, B) but for the CS-.
9
(E) Non-parametric cluster analysis reveals significant differences between CS+ and CS- trials. The gray
10
color code depicts non-significant changes.
11
BA = basolateral amygdala, DMS = dorsomedial striatum, and PL = prelimbic cortex, CS = conditioned
12
stimulus, and US = unconditioned stimulus.
13 14
As for G10s rats, the two CSs used did not elicit any significant PSD or coherence 15
modulation during habituation, in any of the three brains structures and there were minimal 16
changes between habituation and LTM (Fig. S3 and S4). 17
Importantly, all the PSD and coherence modulations observed previously in G10s were 18
also present in G30s and lasted during the expectancy part of the CS+ (i.e. up to the US time), 19
without following the global level of freezing of the animals. Therefore, it is likely that they 20
are representative of the learned CS-US interval. 21
22 23
Neural correlates dynamically adapt to a new CS-US interval (shift to 10s for the G30s
24
group)
To further ensure that these neural correlates were related to the expected time of US 1
arrival, we tested whether the correlates observed in G30s rats would adapt to a new CS-US 2
interval, i.e., 10s, and would then resemble the ones observed in the G10s animals. 3
Before this shift, animals went through two additional extinction sessions, during which 4
fewer significant modulations of power and coherence were observed, as can be seen in the last 5
extinction session in Fig. S5, S6 and S7. 6
Twenty-four hours after a retraining with a 10s CS-US interval (LTM-shift), G30s 7
animals showed a significant decrease in 9-30 Hz LFP power in the DMS shifted to the left in 8
time for a 12-30 Hz band, whereas the decrease in a 9-12 Hz band was maintained up to 45s 9
for the CS+ (Fig 9A-B). Therefore, the 12-30 Hz band was shifted in time and followed the 10
change in CS-US interval, whereas the 9-12 Hz band was maintained over a longer duration, 11
similar to the one observed before the shift in time, suggesting that it may represent maintenance 12
in memory of the initially learned duration. For the CS-, we observed a significant decrease in 13
beta power at the onset of the stimulus, interestingly the difference between CS+ and CS- was 14
present only from 30s to the end of the CS. We also observed a significant decrease in beta 15
power in PL and BA from the onset of the CS to around 15s, this was only the case for the CS+ 16
(Fig. 9A-B, left and right panels) and not the CS- (Fig. 9C-D, left and right panels) even though 17
we did not see any significant differences between CS+ and CS- (Fig. 9E, left and right panels). 18
1
Figure 9: Significant modulations of LFP PSD during LTM-shift for G30s for prelimbic cortex (PL),
2
dorsomedial-striatum (DMS) and basolateral amygdala (BA) for 1-35 Hz.
3
(A, B) Modulations of LFP PSD for CS+. The expected time of arrival of the US is represented with a
4
continuous vertical red line. Left panels correspond to the prelimbic cortex (PL), the middle panels
(BA). Number of animals in each spectrogram is given in the upper right corner. A common scale bar for all
1
three panels in a row is present on the right side.
2
(A) Power spectrum density (PSD) normalized to the 30s before CS presentation as a z-score (onset of the
3
CS at 0s is marked by a dashed black line).
4
(B) Non-parametric cluster analysis reveals significant (p < 0.05) power spectrum increases (in red) or
5
decreases (in blue) as t-values, compared to the baseline level of activity (30s before CS presentation). The
6
gray color code depicts non-significant changes (note the different timescale in the right panel, which
7
encompasses the stimulus period only).
8
(C, D) Same as (A, B) but for the CS-.
9
(E) Non-parametric cluster analysis reveals significant differences between CS+ and CS- trials. The gray
10
color code depicts non-significant changes.
11
BA = basolateral amygdala, DMS = dorsomedial striatum, and PL = prelimbic cortex, CS = conditioned
12
stimulus, and US = unconditioned stimulus.
13 14
Looking at higher frequencies, the increase in 55-95 Hz LFP power in the PL was 15
present only at the onset of the CS+ (Fig.10A-B, left panels). This is in contrast with the 16
increases observed in the same frequency band and structures during the expectancy of the 17
shock (only in CS+ and not CS-) for both G10s and G30s groups. This suggests that this pattern 18
of activity may have represented an early encoding of duration and/or association. We also 19
observed increase power at onset in the DMS and BA (Fig. 10A-B, middle and right panels) as 20
well as an increase toward the end of the CS- in PL and DMS (Fig. 10C-D, left and middle 21
panels). 22
1
Figure 10: Significant modulations of LFP PSD during LTM-shift for G30s for prelimbic cortex (PL),
2
dorsomedial-striatum (DMS) and basolateral amygdala (BA) for 55-95 Hz.
3
(A, B) Modulations of LFP PSD for CS+. The expected time of arrival of the US is represented with a
4
continuous vertical red line. Left panels correspond to the prelimbic cortex (PL), the middle panels
5
correspond to the dorsomedial-striatum (DMS) and the right panels correspond to the basolateral amygdala
(BA). Number of animals in each spectrogram is given in the upper right corner. A common scale bar for all
1
three panels in a row is present on the right side.
2
(A) Power spectrum density (PSD) normalized to the 30s before CS presentation as a z-score (onset of the
3
CS at 0s is marked by a dashed black line).
4
(B) Non-parametric cluster analysis reveals significant (p < 0.05) power spectrum increases (in red) or
5
decreases (in blue) as t-values, compared to the baseline level of activity (30s before CS presentation). The
6
gray color code depicts non-significant changes (note the different timescale in the right panel, which
7
encompasses the stimulus period only).
8
(C, D) Same as (A, B) but for the CS-.
9
(E) Non-parametric cluster analysis reveals significant differences between CS+ and CS- trials. The gray
10
color code depicts non-significant changes.
11
BA = basolateral amygdala, DMS = dorsomedial striatum, and PL = prelimbic cortex, CS = conditioned
12
stimulus, and US = unconditioned stimulus.
13 14
With regard to the PL-BA and BA-DMS coherences, the two sub-bands described 15
previously were clearly visible in this shifted condition (Fig. 11A-B, left and right panels), 16
similar to the ones observed in the G10s group (Fig. 5), and the significant increases were 17
shifted toward the new duration. For PL-DMS, coherence in the 3-9 Hz range was also shifted 18
to the expected arrival of the US (Fig. 11A-B, middle panels) and as significantly different 19
between CS+ and CS- (Fig. 11E, middle panel). Therefore, these results confirm that the 20
modulations in coherence in this three-area network are time-locked to the CS-US time interval, 21
and do not simply reflect global level of associative memory or freezing levels. 22
1
Figure 11: Significant modulations of coherence during LTM-shift for G30s between prelimbic cortex (PL),
2
dorsomedial-striatum (DMS) and basolateral amygdala (BA) between 1 and 35 Hz.
3
(A, B) Modulations of coherence for CS+. The expected time of arrival of the US is represented with a
4
continuous vertical blue line. Left panels correspond to the prelimbic cortex (PL), the middle panels
(BA). Number of animals in each spectrogram is given in the upper right corner. A common scale bar for all
1
three panels in a row is present on the right side.
2
(A) Coherence normalized to the 30s before CS presentation as a z-score (onset of the CS at 0s is marked by
3
a dashed black line).
4
(B) Non-parametric cluster analysis reveals significant (p < 0.05) power spectrum increases (in red) or
5
decreases (in blue) as t-values, compared to the baseline level of activity (30s before CS presentation). The
6
gray color code depicts non-significant changes (note the different timescale in the right panel, which
7
encompasses the stimulus period only).
8
(C, D) Same as (A, B) but for the CS-.
9
(E) Non-parametric cluster analysis reveals significant differences between CS+ and CS- trials. The gray
10
color code depicts non-significant changes.
11
BA = basolateral amygdala, DMS = dorsomedial striatum, and PL = prelimbic cortex, CS = conditioned
12
stimulus, and US = unconditioned stimulus.
13 14 15 Discussion 16 17
In the present study we have shown changes in neural oscillatory activity in an 18
amygdalo-prefronto-dorsostriatal network that are associated with an encoding of the temporal 19
expectation of an aversive event and independent of the general level of freezing of the animals. 20
By using a CS length that encompasses both before and after the arrival of the US, we were 21
able to search for correlates during both increasing and decreasing expectancies, giving us the 22
opportunity to pinpoint specific timing-related correlates. While exploring the frequency 23
spectrum up to 100 Hz, we observed a number of modulations during the CS+ that were 24
temporally-related to the CS-US interval and virtually absent during the CS-. A decrease in 12-25
30 Hz LFP power (beta range) in the DMS was linked with the duration of the learned CS-US 26
interval, as it was significantly different from baseline during the expectancy period (i.e. 27
was shifted when reducing the CS-US interval from 30s to 10s. We also observed an increase 1
in coherence in a low frequency range with similar temporal patterns between all three 2
structures. Noticeably, however, when the BA was involved, we could distinguish two sub-3
bands of modulated coherence, one at 3-6 Hz and the other at 6-9 Hz, whereas a single 3-9Hz 4
band was observed for PL-DMS. The modulations in functional connectivity in the 3-6Hz range 5
were time-locked to the CS-US interval. 6
We observed significant differences between CS+ and CS- in G30s rats that we did not 7
observe in G10s rats, this may be because 10s is closer to the onset and the 10s specific activity 8
could merge with the onset response that is present in both CS+ and CS-. It could also be 9
because we used different frequencies for CS+ and CS-. We chose to not counterbalance these 10
two frequencies, as it has been shown that speed of temporal learning in a Pavlovian 11
conditioning task differs depending on the auditory-CS stimulus frequency (Boulanger-12
Bertolus et al. 2015). Thus, would have prevented us from pooling rats trained on a 7kHz CS+ 13
with rats trained on a 1kHz CS+, as they would have potentially reached different CS-US 14
interval learning level. Furthermore, to facilitate learning of the CS-US interval, we chose to 15
use the higher frequency (i.e. 7 kHz) for the CS+. Importantly, there was no difference in PSD 16
or in coherence between the two CS frequencies during habituation before any learning had 17
taken place (see Fig. S2 and S3). Also, when considering the freezing behavior the fact that 18
freezing is higher for CS+ in the case of G30s rats and higher for the CS- for the G10s seems 19
to show that frequencies did not produce differences between the groups but instead the 20
differences in CS-US duration is the main cause for this difference in freezing. 21
We are showing, for the first time to our knowledge, the involvement of a prefronto-22
amygdalo-dorsostriatal network in associative memory, in particular in the temporal 23
expectancy of the US and dissociated from the generalized freezing behavior. Modulations of 24
aversive conditioning, but to our knowledge no study had looked at these three brain areas 1
simultaneously. 4Hz oscillations in the prefrontal cortex have been shown to control freezing 2
behavior in mice (Dejean et al. 2016), we did not observe this PFC activity in our recordings 3
although our animals did freeze during both CS+ and CS- at a rather high level. The reason for 4
this discrepancy may lie in the different recording sites (we recorded more ventrally in the PFC) 5
or depend on the species (mice vs. rats). Another possibility is that, in our study, there was poor 6
discrimination leading to a high level of generalization between the CS+ and CS-, with a high 7
and steady amount of freezing between CSs as well, which might have masked freezing-related 8
neural modulation as we normalize our data to a 30s pre-CS duration for each CS. This might, 9
however, have given us the opportunity to isolate time-related modulations which may be 10
normally embedded, and therefore masked, in association- and freezing-related modulations. 11
We did not find modulated activity in theta frequency range in BA, while it has been 12
reported in the lateral part of the amygdala (LA) after aversive conditioning in cats or mice 13
(Paré and Collins 2000; Pape et al. 2005). One explanation might be anatomical, as BA and LA 14
are different nuclei of the amygdala and may be differentially involved in CS-US interval 15
processing. Another possibility is a difference in strength of learning, which may also explain 16
why we did not observe increased coherence in gamma oscillations between BA and striatum 17
after Pavlovian conditioning (Pape et al. 2005), or increased theta (4-8 Hz) activity in the PFC 18
and delta (1-4 Hz) or theta (3-6 Hz) and gamma (60-70 Hz) activity in the striatum in correlation 19
with temporal behavior (Parker et al. 2014; Emmons et al. 2016, 2017; Kim et al. 2016; Dallérac 20
et al. 2017), as all these latter oscillatory modulations were observed in well-trained animals. 21
However, our results demonstrate modulations of neural oscillations that reflect expectancy of 22
the US early in training, independently of the behavioral state of the animal. 23
We report here a decrease in 12-30 Hz LFP power in the DMS which started at the onset 24
To the best of our knowledge, no study has characterized beta modulation in the DMS during 1
Pavlovian conditioning. Beta oscillations have often been associated with motor control and 2
inhibition of motor output, but a role in interval timing has also been suggested (Engel and Fries 3
2010). Beta modulations have already been described in temporal tasks. Bartolo et al. (2014) 4
recorded basal ganglia LFP in monkeys activity during a rhythmic tapping task (either driven 5
by a regular stimulus or not) and showed increased beta activity (10-30 Hz) before a button 6
press (i.e. at the moment of motor preparation), this increase was shifted depending on the 7
duration required for the tapping. Based on these results, Kononowicz and van Rijn (2015) 8
looked at beta oscillations in single trials in a time production task in humans with EEG 9
recordings. They observed that beta activity after the onset of the stimulus predicted the 10
duration that the individual would produce. In those studies, beta power was increased, whereas 11
in our study we only saw decreases in power. This difference may originate from the necessity 12
for motor output in temporal production tasks and not in Pavlovian conditioning. Alternatively, 13
the difference may be due to the different time processing requirement, explicit timing in 14
temporal production tasks vs. implicit timing in Pavlovian tasks. Indeed, in a MEG study in 15
humans (Fujioka et al. 2012), decreases in beta activity were correlated with inter-stimulus 16
intervals when presenting sounds at regular intervals (390, 585 or 780 ms), which is also an 17
implicit timing task. The onset of a sound provoked a decrease in beta activity in the auditory 18
cortex that was similar in amplitude for all durations tested but that showed different speeds of 19
return to the baseline level so that maximal LFP power slightly preceded the next sound. We 20
here show a similar effect in the DMS in an implicit timing task with a memory component. 21
Also striking is the time-related modulation of coherence in the low frequency range 22
between the three brain areas. In rodents, coherence in the theta range (4–8 Hz) seems to support 23
amygdala-prefrontal interactions and contribute to expression (Courtin et al. 2014), 24
Here, we show that coherence between PL-BA and BA-DMS in the 6 Hz range and in the 3-1
9Hz range between PL and DMS is increased during the expectancy of the US, and in a manner 2
distinct from freezing expression, as no such modulation of coherence was observed during the 3
CS- with an equivalent level of freezing. Noticeably, it is in the same frequency range that 4
modulation in coherence was observed between BA and DMS in our previous study (Dallérac 5
et al. 2017). However, while changes in coherence are in both cases related to the CS-US time 6
interval, the patterns are very different. In Dallérac et al. (2017), the animals were trained for 7
several weeks until fully expressing a bell-shape temporal behavior, whereas in the present 8
study, animals were trained for only one day of conditioning and showed poor temporal control. 9
The temporal pattern of coherent neural activity observed in Dallérac et al. (2017) was closely 10
correlated with the temporal behavior, which is not the case in the current study where freezing 11
levels remained high even after the expected arrival of the US while the oscillatory modulations 12
went back to baseline level after the US time. One similarity, however, is the observation of 13
two separate bands of coherence (3-6 Hz and 6-9 Hz) when looking at PL-BA and BA-DMS 14
coherence, with the 3-6 Hz band, and not the 6-9 Hz band, encoding temporal information, as 15
in Dallérac et al. (2017). Our present study shows that coherence in a low (3-6Hz) frequency 16
band between PL, DMS and BA may encode and keep track of time until the time of US arrival 17
has passed from the outset of associative learning, before full expression of learning at the 18
behavioral level. These three connected structures may thus form a functional network which 19
participates in the formation of the association and underlie the tracking of the temporal 20
expectancy of the US arrival, the dynamic of which is modified with the amount of training. 21
Furthermore, we are the first to show time-locked increased coherence between the 22
prefrontal cortex and the striatum which is one of the necessary output of the SBF model 23
(Kononowicz and van Wassenhove 2016). 24
When we shifted the G30s rats to 10s, based on the literature (Davis et al. 1989; Díaz-1
Mataix et al. 2013; Dallérac et al. 2017), the animals should have had enough training sessions 2
to shift their learned duration, and this is what we observed in the neural data. We, however, do 3
not know how much of the old duration was maintained in memory. We do not have a measure 4
of their temporal behavior in this task as the goal was to separate temporal behavior from neural 5
correlates of time. We sadly could not record during the shift session because of technical 6
limitations due to the sensitivity of our recording system to the footshocks delivered to the 7
animals. Furthermore, the learning of the new duration could have happened in a single trial 8
making very difficult to detect and analyze using LFP recordings. 9
In sum, the present study highlights a number of modulations in neural oscillations in 10
the amygdalo-prefronto-dorsostriatal network which underlie the timing of a CS-US interval, 11
before the associative learning is complete. This result brings neural validity to the hypothesis 12
that learning the CS-US interval is a co-requisite, if not a pre-requisite, to learning the CS-US 13
association (Balsam and Gallistel 2009). What neural processes, whether spikes or subthreshold 14
modulation of depolarization, generate these modulations (Buzsáki et al. 2013), and whether 15
this network belongs to a larger timing network (van Rijn et al. 2014) will need further 16
investigation, as well as how this network may participate in putative clock mechanisms. As 17
suggested by Merchant et al. (Merchant et al. 2013), task-dependent structures may be involved 18
in a general temporal sense and allow subjects to encode the durations of the multitude of 19
stimuli in our environment, but planning actions and more rigorous temporal control of 20
behavior may necessitate the involvement of a larger circuit (i.e. including the cortico-striatal 21
loop). In the case of aversive conditioning, the amygdala may play the role of the task-22
dependent structure and, through its interaction with the striatum and the prefrontal cortex, 23
allow the development of temporal specific behavioral responses. 24
1
Acknowledgments
2
We thank Gérard Dutrieux, Nathalie Samson-Desvignes, Pascale LeBlanc-Veyrac and 3
Valérie Halin-Marsaux for technical help. 4
This work was financed by ANR-11-EMCO-012-02 ‘TDE’ and ANR-16-CE37-0004-04 5
‘AutoTime’ to V.D. The collaboration between CNRS/Université Paris-Sud (VD lab) and New 6
York University was supported by CNRS-NYU LIA EmoTime and Partner University Funds 7
‘Emotion & Time’. 8
9
Author contributions
10
V.D and L.D.M. designed the experiments; L.T performed the experiments and analyzed the 11
data; M.G. contributed analysis tools; M.G and L.D.M reviewed the paper; L.T and V.D wrote 12 the paper. 13 14 Competing interests 15
The authors declare that no competing interests exist. 16 17 18 References 19 20
Aparicio P, Diedrichsen J, Ivry RB. 2005. Effects of focal basal ganglia lesions on timing and 21
force control. Brain Cogn. 58:62–74. 22
Balci F, Simen P. 2016. A decision model of timing. Curr Opin Behav Sci. 8:94–101. 23
Balsam PD, Gallistel CR. 2009. Temporal maps and informativeness in associative learning. 24
Trends Neurosci. 32:73–78. 25
Bartolo R, Prado L, Merchant H. 2014. Information processing in the primate basal ganglia 26
during sensory-guided and internally driven rhythmic tapping. J Neurosci. 34:3910– 27
3923. 28
Boulanger-Bertolus J, Knippenber J, Verschueren A, Le Blanc P, Brown BL, Mouly A-M, 29
Doyère V. 2015. Temporal behavior in auditory fear conditioning: Stimulus property 30
matters. Int J Comp Psychol. 28. 31