HAL Id: inserm-00122145
https://www.hal.inserm.fr/inserm-00122145
Submitted on 27 Dec 2006
HAL is a multi-disciplinary open access
archive for the deposit and dissemination of
sci-entific research documents, whether they are
pub-lished or not. The documents may come from
teaching and research institutions in France or
abroad, or from public or private research centers.
L’archive ouverte pluridisciplinaire HAL, est
destinée au dépôt et à la diffusion de documents
scientifiques de niveau recherche, publiés ou non,
émanant des établissements d’enseignement et de
recherche français ou étrangers, des laboratoires
publics ou privés.
of 8p12, 8q24, 11q13, 12p13, 17q12, and 20q13
amplifications in breast cancers.
Anne Letessier, Fabrice Sircoulomb, Christophe Ginestier, Nathalie Cervera,
Florence Monville, Véronique Gelsi-Boyer, Benjamin Esterni, Jeannine
Geneix, Pascal Finetti, Christophe Zemmour, et al.
To cite this version:
Anne Letessier, Fabrice Sircoulomb, Christophe Ginestier, Nathalie Cervera, Florence Monville, et al..
Frequency, prognostic impact, and subtype association of 8p12, 8q24, 11q13, 12p13, 17q12, and 20q13
amplifications in breast cancers.. BMC Cancer, BioMed Central, 2006, 6, pp.245.
�10.1186/1471-2407-6-245�. �inserm-00122145�
Open Access
Research article
Frequency, prognostic impact, and subtype association of 8p12,
8q24, 11q13, 12p13, 17q12, and 20q13 amplifications in breast
cancers
Anne Letessier
1, Fabrice Sircoulomb
1, Christophe Ginestier
1,
Nathalie Cervera
1, Florence Monville
1, Véronique Gelsi-Boyer
1,2,3,
Benjamin Esterni
4, Jeannine Geneix
1, Pascal Finetti
1, Christophe Zemmour
1,
Patrice Viens
3,4, Emmanuelle Charafe-Jauffret
1,2,3, Jocelyne Jacquemier
1,2,
Daniel Birnbaum
1and Max Chaffanet*
1Address: 1Centre de Recherche en Cancérologie de Marseille, Département d'Oncologie Moléculaire, UMR599 Inserm/Institut Paoli-Calmettes, Marseille, France, 2Centre de Recherche en Cancérologie de Marseille, Département de BioPathologie, UMR599 Inserm/Institut Paoli-Calmettes, Marseille, France, 3Faculté de Médecine, Université de la Méditerranée, Marseille, France and 4Centre de Recherche en Cancérologie de Marseille, Département d'Oncologie Médicale, UMR599 Inserm/Institut Paoli-Calmettes, Marseille, France
Email: Anne Letessier - letessiera@marseille.fnclcc.fr; Fabrice Sircoulomb - sircoulombf@marseille.fnclcc.fr; Christophe Ginestier - cginesti@med.umich.edu; Nathalie Cervera - cerveran@marseille.fnclcc.fr;
Florence Monville - monvillef@marseille.fnclcc.fr; Véronique Gelsi-Boyer - gelsiv@marseille.fnclcc.fr;
Benjamin Esterni - esternib@marseille.fnclcc.fr; Jeannine Geneix - geneixj@marseille.fnclcc.fr; Pascal Finetti - finettip@marseille.fnclcc.fr; Christophe Zemmour - chaffanetm@marseille.fnclcc.fr; Patrice Viens - viensp@marseille.fnclcc.fr; Emmanuelle
Charafe-Jauffret - jauffrete@marseille.fnclcc.fr; Jocelyne Jacquemier - jacquemierj@marseille.fnclcc.fr; Daniel Birnbaum - birnbaum@marseille.inserm.fr; Max Chaffanet* - chaffanetm@marseille.fnclcc.fr
* Corresponding author
Abstract
Background: Oncogene amplification and overexpression occur in tumor cells. Amplification status may provide
diagnostic and prognostic information and may lead to new treatment strategies. Chromosomal regions 8p12, 8q24, 11q13, 17q12 and 20q13 are recurrently amplified in breast cancers.
Methods: To assess the frequencies and clinical impact of amplifications, we analyzed 547 invasive breast tumors
organized in a tissue microarray (TMA) by fluorescence in situ hybridization (FISH) and calculated correlations with histoclinical features and prognosis. BAC probes were designed for: (i) two 8p12 subregions centered on RAB11FIP1 and
FGFR1 loci, respectively; (ii) 11q13 region centered on CCND1; (iii) 12p13 region spanning NOL1; and (iv) three 20q13
subregions centered on MYBL2, ZNF217 and AURKA, respectively. Regions 8q24 and 17q12 were analyzed with MYC and
ERBB2 commercial probes, respectively.
Results: We observed amplification of 8p12 (amplified at RAB11FIP1 and/or FGFR1) in 22.8%, 8q24 in 6.1%, 11q13 in
19.6%, 12p13 in 4.1%, 17q12 in 9.9%, 20q13Z (amplified at ZNF217 only) in 9.9%, and 20q13Co (co-amplification of two
or three 20q13 loci) in 8.5% of cases. The 8q24, 12p13, and 17q12 amplifications were correlated with high grade. The most frequent single amplifications were 8p12 (9.8%), 8q24 (3.3%) and 12p13 (3.3%), 20q13Z and 20q13Co (1.6%) regions.
The 17q12 and 11q13 regions were never found amplified alone. The most frequent co-amplification was 8p12/11q13. Amplifications of 8p12 and 17q12 were associated with poor outcome. Amplification of 12p13 was associated with basal molecular subtype.
Published: 13 October 2006
BMC Cancer 2006, 6:245 doi:10.1186/1471-2407-6-245
Received: 18 August 2006 Accepted: 13 October 2006 This article is available from: http://www.biomedcentral.com/1471-2407/6/245
© 2006 Letessier et al; licensee BioMed Central Ltd.
This is an Open Access article distributed under the terms of the Creative Commons Attribution License (http://creativecommons.org/licenses/by/2.0), which permits unrestricted use, distribution, and reproduction in any medium, provided the original work is properly cited.
Conclusion: Our results establish the frequencies, prognostic impacts and subtype associations of various amplifications
and co-amplifications in breast cancers.
Background
Amplification is a frequent and important mechanism for oncogene overexpression in breast tumor cells. Several amplified regions may participate to breast tumor initia-tion and/or progression [1]. Chromosomal regions 8p12, 8q24, 11q13, 17q12 and 20q13 are amplified in a consist-ent proportion of breast tumors [2-5]. The 12p13 region was also found amplified in some breast tumors [6,7]. Amplification status may be determined in clinics as an indicator of prognosis or before applying a specific treat-ment: ERBB2 amplification, found in 15 to 25% of breast cancers, is a marker of adverse prognosis and encodes a tyrosine kinase receptor that is the target of trastuzumab (Herceptin) [8-10]. Amplifications at 8p12, 8q24, 11q13, 12p13, and 20q13 have also potential clinical interest as prognosis markers and/or therapeutic targets. Amplifica-tion of the 8p12 region is found in around 15% of breast cancers [11-13]. Although the identity of the driver genes has not been definitely established, the importance of the
FGFR1 tyrosine kinase receptor gene has been suggested
[5,14]. Amplification of this region has an adverse impact on prognosis in breast cancer [5]. MYC is localized in 8q24 and encodes a nuclear protein that plays a role in cell cycle progression. Amplification of 8q24 occurs in up to 20% of breast cancers and is associated with a poor clinical outcome [15-21]. CCND1 localized in 11q13 encodes cyclin D1, which is active during the G1 phase of the cell cycle. Amplification of CCND1 occurs in 10 to 30% of breast cancers [3,22-24]. Amplification of 12p13 is not a frequent event in breast cancers but genomic stud-ies indicate its potential importance in basal breast can-cers [7,25]. The 20q13 chromosomal region is amplified in 5% to 20% in breast tumors and its prognosis impact is unclear [26-29]. Several potential oncogenes have been suggested, including MYBL2 [23,30], AURKA [31], and
ZNF217 [32-34].
To assess the frequencies and to evaluate the impact on prognosis of amplifications and co-amplifications, we analyzed 547 breast tumors organized in a tissue microar-ray (TMA) by fluorescence in situ hybridization (FISH) with probes covering amplified regions. BAC probes were designed for: (i) two 8p12 subregions [5] centered on
RAB11FIP1 and FGFR1 loci, respectively; (ii) 11q13
region centered on CCND1; (iii) 12p13 region spanning
NOL1; and (iv) three 20q13 subregions [29] centered on MYBL2, ZNF217 and AURKA, respectively. Regions 8q24
and 17q12 were analyzed with MYC and ERBB2 commer-cial probes, respectively.
Methods
Patients and histological samples
We studied a consecutive series of 547 unilateral localized invasive breast carcinomas from women treated at the Institut Paoli-Calmettes between October 1987 and December 1999. According to the WHO classification, this series comprised 386 ductal, 72 lobular, 37 tubular, 8 medullary carcinomas and 44 other histological types. They were obtained after informed consent and stored in an anonymous fashion according to an approval of the local Ethics Committee. The Ethics Committee of the Institut Paoli-Calmettes (Marseille's Cancer Institute) approved the use of these specimens and the data in research. The average age at diagnosis was 59 years (range 25–94). Raw survival data were either obtained from the cancer registry of the Institut Paoli-Calmettes or collected from the patients attending physicians. The pathologic stage, tumor diameter, and nodal status were obtained from the primary pathology reports. A total of 254 tumors were associated with lymph node invasion and 403 were positive for estrogen receptor. All slides from all tumors were reviewed by one of two pathologists (J. J. and E.C.J.) to define the various histoclinical factors collected for this series. They included patient age, invasive histological type, pathological tumor size, Scarff-Bloom-Richardson (SBR) grade (I to III), peritumoral vascular invasion, axil-lary lymph node status, estrogen receptor expression (ER), progesterone receptor expression (PR), P53 status, as eval-uated by immunohistochemistry (IHC) with a positivity cut-off value of 1%, ERBB2 status, evaluated by IHC with the 0-3+ score as illustrated by the HercepTest kit scoring guidelines (DakoCytomation, Coppenhagen, Denmark), and Ki67 status as evaluated by IHC with a positive cut-off value at 20%. This study was approved and executed in compliance with our institutional review board.
Tissue microarray construction
Tissue microarray (TMA) was prepared as described previ-ously [35]. Five-µm sections of the resulting TMA block were made and used for fluorescence in situ hybridization (FISH) and IHC analysis after transfer onto glass slides. Fluorescence In Situ Hybridization on TMA analysis To characterize the 8q24 and 17q12 amplified regions, FISH on TMA was done according to the histology FISH instructions of DakoCytomation with the MYC probe and
HER2 FISH pharmDx™ kit (DakoCytomation,
Coppenha-gen, Denmark). To characterize the 8p12, 11q13, 12p13, and 20q13 amplified regions, FISH on TMA was done according to published protocols [36,37]. Two 8p12
sub-regions centered on RAB11FIP1 and FGFR1 loci, respec-tively, were analyzed. From telomere to centromere, the different BAC pools were constituted as follows: BAC pool 1 (RAB11FIP1 region): RP11-863K10 (AC138356; chr8:37,630,477-37,820,753), RP11-113G10 (chr8:37,715,876-37,881,776), RP11-457O21 (chr8:37,881,796-38,044,340); BAC pool 2 (FGFR1 region): RP11-90P5 (AC084024.17; chr8:38,091,019-38,226,422), RP11-513D5 (AC087362.13; chr8:38,216,677-38,358,846), RP11-100B16 (chr8:38,358,839-38,522,417), RP11-675F6 (AC069120.9; chr8:38,485,749-38,646,922). The 11q13 region centred on CCND1 was analyzed with the follow-ing combination of BAC pools, from centromere to tel-omere: RP11-300I6 (AP001888; chr11:69,162,462-69,323,966), RP11-643C9 (chr11:69,297,662-69,494,887), RP11-626H12 (AP003555; chr11:69,478,620-69,600,219). The 12p13 region span-ning NOL1 region was analyzed with, from telomere to centromere, RP5-940J5 (AC006064; chr12:6,422,311-6,594,917), RP11-433J6 (AC135892; chr12:6,579,330-6,755,900), RP11-578M14 (chr12:6,699,832-6,884,088) BAC pool. Three 20q13 subregions of amplification corre-sponding to MYBL2, ZNF217 and AURKA loci were ana-lyzed with locus-specific BAC pools, from centromere to telomere : MYBL2 locus BAC pool : RP11-69I10 (chr20:41,467,083-41,631,733), RP11-153L9 (chr20:41,659,456-41,808,516), RP5-1030M6 (AL035089; chr20:41,816,168-41,989,971); ZNF217 locus BAC pool : RP11-91L1 (chr20:51,421,217-51,572,829), RP4-724E16 (AL157838; chr20:51,561,511-51,690,363), RP11-299C12 (chr20:51,647,272-51,837,964); and AURKA locus BAC pool : RP11-380D15 (AL139824; chr20:54,122,911-54,316,054), RP5-1167H4 (AL121914; chr20:54,336,458-54,472,150), RP5-1153D9 (AL109806; chr20:54,472,051-54,566,171). Genomic information was taken from the UCSC Genome Browser on Human (March 2006 Assembly), which is based on NCBI Build 35 (National Center for Biotechnology Infor-mation, U.S. National Library of Medicine 8600 Rockville Pike, Bethesda, MD, USA).
DNA from BAC clones were purified, labeled and individ-ually verified for their specificity of their addressed
regions. All BAC clones were obtained from the BACPAC resource (Children's Hospital Oakland – BACPAC Resources, Oakland, CA, USA). After counterstaining with Vectashield containing 4,6-diamidino-2-phenylindole (DAPI) (Vector, Burlingame, CA, USA), images were ana-lyzed with a microscope (DMRXA, Leica Microsystèmes, Marseille, France), captured with a CCD camera, filtered and processed with ISIS software (In Situ Imaging Sys-tems, Metasystems Hard- und Software GmbH, Alt-lussheim, Germany)[38].
Fluorescence was scored on a minimum of 50 nuclei per tumor. The 50 nuclei of cancer cells were representative of the overall cell heterogeneity of the tumor. For each region analyzed, two observers read the TMA independ-ently. The region analyzed was considered as amplified when the number of BAC pool signal was >5 in the cell. Tumors were defined as amplified when 10% or more of tumor cells showed such amplification.
Immunohistochemistry analysis
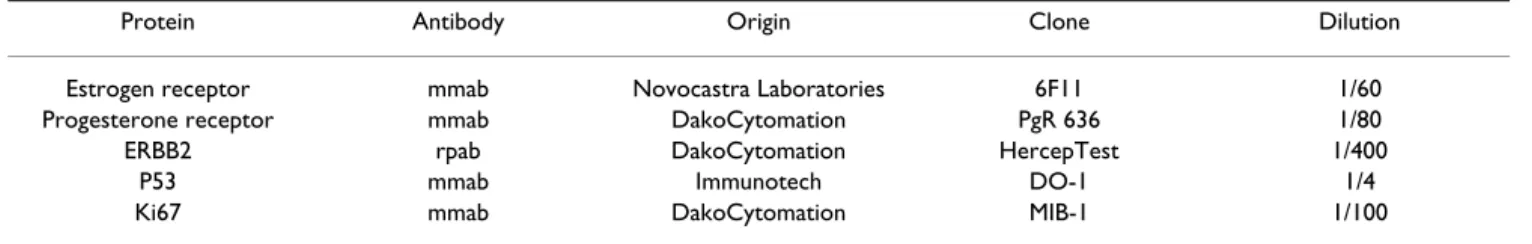
The characteristics of the antibodies used are listed in Table 1. IHC was done as previously described [35], using LSAB2 kit in the autostainer (Dako Autostainer, Copenha-gen, Denmark). Results were evaluated under a light microscope by two pathologists (EC-J, JJ) and scored by the quick score (QS) as previously done [35], except for ERBB2 status, which was evaluated with the Dako scale (HercepTest kit scoring guidelines). For each tumor, the mean of the score of a minimum of two core biopsies was calculated.
Statistical methods
Amplification data were summarized by frequencies and percentages. Clinical data were dichotomized as follows: Amplicon: amplified vs. non-amplified, grade: I vs. II/III, age: <50 vs. ≥ 50, tumor size: pT1 vs. pT2/pT3, peritu-moral vascular invasion: absent vs. present, estrogen receptor and progesterone receptor: negative vs. positive, Ki67: <20 vs. ≥ 20 and axillary lymph node: negative vs. positive.
The association between two categorical variables was examined using Fisher's exact or χ2 tests. The primary
end-point was the metastasis-free survival (MFS), which was Table 1: List of proteins tested by immunohistochemistry and characteristics of the corresponding antibodies.
Protein Antibody Origin Clone Dilution
Estrogen receptor mmab Novocastra Laboratories 6F11 1/60 Progesterone receptor mmab DakoCytomation PgR 636 1/80
ERBB2 rpab DakoCytomation HercepTest 1/400
P53 mmab Immunotech DO-1 1/4
Ki67 mmab DakoCytomation MIB-1 1/100
defined by the time interval between the diagnosis of breast cancer and a distant metastasis. Metastasis-free patients were right censored at the date of the last follow-up, death, recurrence of local or regional disease, or devel-opment of a second primary cancer. Survival curves were derived from Kaplan-Meier estimates and compared by log-rank test. Significant changes of relative risks of metas-tasis according to the amplification status were explored using Cox's proportional hazard models in univariate and multivariate analysis. Multivariate models were built using a backward stepwise selection of variables to mini-mize the Akaike Information Criterion. All results are pre-sented with their 95% confidence intervals. Statistical tests were two-sided at the 5% level of significance. All the statistical analyses were done using R.2.3.0 statistical soft-ware [39].
Results
Frequencies of amplifications and co-amplifications Six regions of amplification were analyzed: 8p12 (ampli-fied at least at one locus: RAB11FIP1 and/or FGFR1), 8q24 (MYC), 11q13 (CCND1), 12p13 (NOL1), 17q12 (ERBB2), and 20q13Co (co-amplification of either two of
three loci: MYBL2, ZNF217 and AURKA, or all three) regions. For the 20q13 region, in regard to the significant impact of ZNF217 amplification on disease evolution [29], we decided to distinguish the amplified subregion 20q13Z centered on ZNF217. To assess the frequencies of
the 8p12, 8q24, 11q13, 12p13, 17q12 and 20q13 ampli-fications we used FISH on TMA with specific probes. The number of interpretable cases varied between different FISH experiments (Figure 1). All TMA sections were only hybridized once. Reasons for non-informative results were: lack of tissue on the TMA, absence of unequivocal tumor cells, or non-interpretable hybridization data. Among the informative cases, the frequency of amplifica-tion was 22.8% for 8p12, 6.1% for 8q24, 19.6% for 11q13, 4.1% for 12p13, 9.9% for 17q12, 9.9% for 20q13Z
and 8.5% for 20q13Co regions (Figure 1). More in detail,
the amplification frequencies of subregions centered on
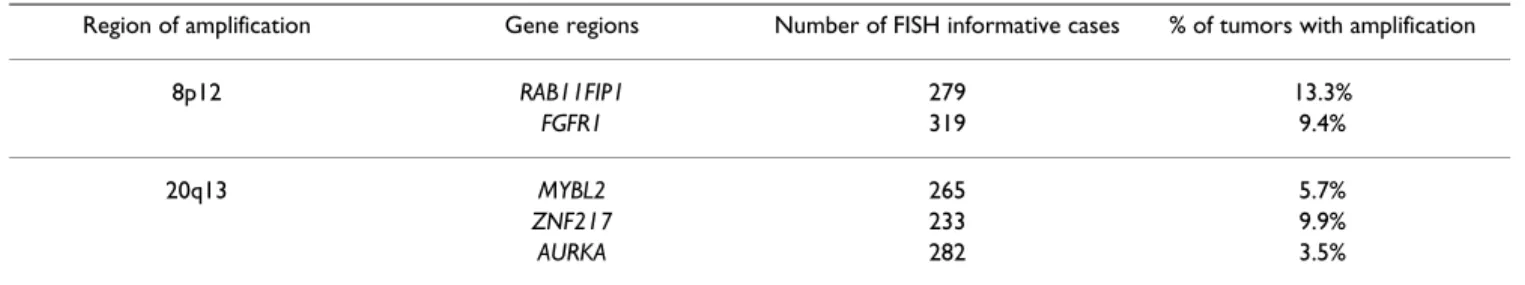
RAB11FIP1 and FGFR1 (8p12) as well as on MYBL2, ZNF217 and AURKA (20q13) loci are listed in Table 2.
The highest amplication frequencies were obtained with
RAB11FIP1 and ZNF217 subregions for 8p12 and 20q13,
respectively.
We then looked at the distribution of the frequency of amplifications and co-amplifications. Overall, only 128 cases were informative for all the regions analyzed. A total of 57.4% of cases showed no amplification. The frequency of single amplifications was 9.8% for 8p12, 3.3% for 8q24 and 12p13, 1.6% for 20q13Co and 20q13Z. The 11q13 and
17q12 regions were never found amplified alone. The fre-quency of co-amplifications was 8.2% for 8p12/11q13,
3.3% for 11q13/17q12, 1.6% for 17q12/20q13Co, 11q13/
20q13Co, 11q13/20q13Z/20q13Co, 8q24/11q13/17q12,
8q24/20q13Z/20q13Co, 8p12/11q13/12p13 and 8p12/
11q13/20q13Z/20q13Co (Figure 2). We also looked for
associations between amplified regions. The 11q13/ 20q13Co, 12p13/20q13Z and 8p12/11q13
co-amplifica-tions were among the most strongly correlated [see Addi-tional file 1].
Correlation of amplified regions with histoclinical factors We next examined the relation between amplifications and histoclinical factors [see Additional file 2]. We did not find any association between amplified regions and age, histological type and pathological tumor size. Amplifica-tion of 8q24, 12p13, 17q12 and 20q13Co regions were
correlated with high grade. Amplification of 8p12, 12p13 and 17q12 were correlated with a high proliferation index. Amplification of 8q24, 12p13, 17q12, and 20q13Z
were associated with ER and/or PR negativity. The 20q13Co amplification was associated with axillary lymph
node invasion.
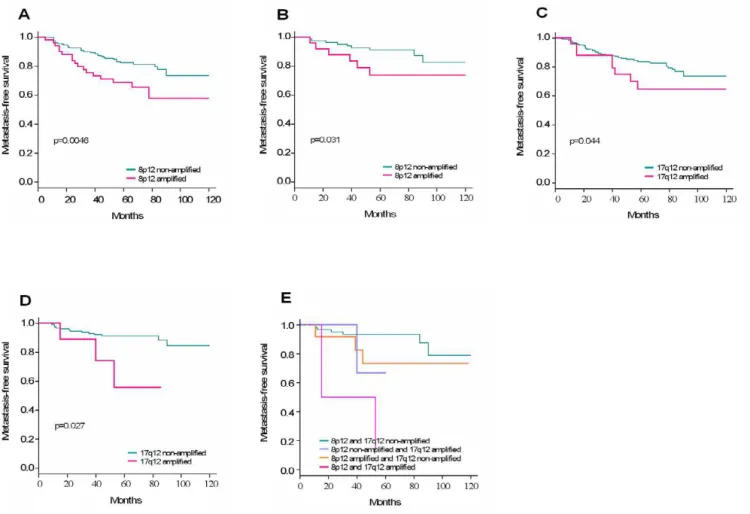
Correlation of amplified regions with clinical outcome We then examined the impact of amplifications and co-amplifications on clinical outcome. We did univariate analyses to determine the impact of each individual amplified region on the MFS. The 8p12 and 17q12 ampli-fications but not the others were associated with clinical outcome (Table 3). Both were associated with decreased five-year MFS in the whole population and in N- patients (Figure 3A–D).To estimate the impact of co-amplification on MFS we did a multivariate analysis of significant amplifications in univariate analysis followed by a step-wise selection. We found that co-amplification of 8p12/ 17q12 was associated with a poor outcome in N- patients (Figure 3E).
We further evaluated the importance of the amplifications as prognosis markers. We did a Cox multivariate analysis of MFS. The values for amplification, grade, age, tumor size, peritumoral vascular invasion, ER, PR, and Ki67 were considered as categorical variables. Amplification status of 8p12 remained significant as well as Ki67 status according to the Akaike Information criterium when dichotomized amplified vs. non-amplified and <20 vs. ≥ 20 in N-patients (Table 4). The relative risk of recurrence was 2.52 for 8p12-amplified disease compared to non-8p12-ampli-fied disease (p = 0.15).
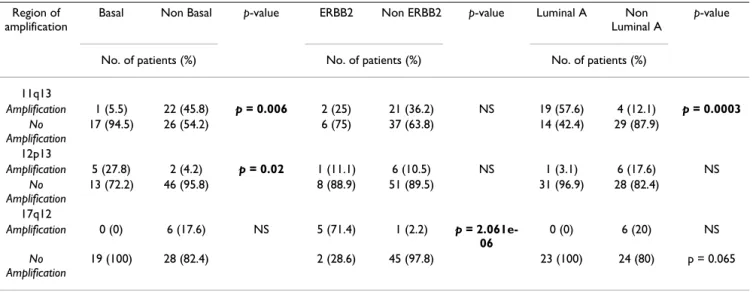
Correlation of amplified regions with molecular subtypes Five main molecular subtypes (luminal A, luminal B, basal, ERBB2-overexpressing, and normal-like) have been identified by gene expression profiling of breast tumor samples using an intrinsic set of ~500 genes [40,41]. We determined the subtype of our samples by both mRNA
Amplification regions and FISH probes
Figure 1
Amplification regions and FISH probes. Schematic representation of the six regions analyzed with probes used in FISH
experiments and the main corresponding genes. The number of informative cases and the percentage (frequency) of amplifica-tions of each analyzed region is given in the table.
and protein analyses (not shown). The 11q13 amplifica-tion was strongly correlated with the luminal A subtype (p value = 0.00029) and negatively correlated with the basal subtype (p value = 0.005633), whereas the 12p13 ampli-fication was correlated with the basal subtype (p value = 0.020). As expected, the 17q12 amplification was
corre-lated with the ERBB2 subtype (p value = 2.061e-06) (Table 5).
Discussion
Several chromosomal regions are frequent targets for gene amplification in breast cancers. Oncogene activation and genomic instability associated with this process may play Table 2: 8p12 and 20q13 subregional amplification frequencies
Region of amplification Gene regions Number of FISH informative cases % of tumors with amplification
8p12 RAB11FIP1 279 13.3% FGFR1 319 9.4% 20q13 MYBL2 265 5.7% ZNF217 233 9.9% AURKA 282 3.5% Co-amplification network Figure 2
Co-amplification network. Schematic representation of frequencies of single amplifications and co-amplifications in 128
breast tumors samples. The size of spheres represents the frequency of region amplified as single. Lines of the same color rep-resent co-amplification and the thickness of lines reprep-resents the frequency of the co-amplification: small: 1.6%, medium: 3.3%, large: 8.2%. For instance, the pink line linking 11q13, 8p12, 20q13Co and 20q13Z represents a co-amplification of all these
a role in tumor initiation and/or progression. Moreover, amplification may have prognostic and/or therapeutic sig-nificance for patients with breast cancer. However, few studies have looked at multiple amplifications and their potential correlations with tumor features and patient outcome [3,4].
Using FISH on TMA, we assessed the frequency of six amplifications, their potential association and their impact on clinical outcome. FISH technique is an easy and rapid method for amplification detection [42] and may provide prognostic information sometimes superior to other methods [43].
Frequency of amplifications and correlations with prognosis
The most frequent amplification and co-amplification involved the 8p12 region. Several studies have shown that 8p12 is a common region of amplification and may har-bor important breast cancer oncogenes [5,44-46]. This region, like other "hot spots" for gene amplification, may contain several genes that contribute to cell transforma-tion. Because the exact 8p loci of significance are not known, we analyzed two subregions of 8p12 spanning many potentially relevant genes [5,44-46]. The two subre-gions covered genes that are amplified and most of them are overexpressed [5]. The frequency of 8p12 amplifica-tion in our breast tumor series was greater than the 10– 15% commonly reported in literature, but similar to that
recently reported by Garcia et al. (2005) [45]. Our results strengthen the idea that the 8p amplification, when all subregions are combined, may occur in a higher number of breast cancer than published so far. The 8p amplifica-tion was correlated with the amplificaamplifica-tion of 11q13 region: while 24.6% of tumors contained either amplified 8p12 region or 11q13 region, simultaneous amplification of both was seen in 10.8%. This result is in agreement with a previous study [47,48]. This suggests a coordinated mechanism of amplification and oncogene activation, and some kind of relation between proteins encoded by genes from the two regions. The 8p12 amplification tended to have aggressive tumor features such as high pro-liferative index and high SBR grade, but no association with histological subtype was found. With respect to prog-nosis, the 8p amplification was a significant predictor of reduced MFS. Multivariate analyses indicated that ampli-fication of 8p12 added to the prognostic power of Ki67 status to define high risk N- patients. Our findings are consistent with the idea that 8p12 is a common region of amplification that may play a role in tumor behavior and/ or pathogenesis. Previous analysis of 8p12 subregional amplifications in breast cancer [5] pointed to the ampli-fied FGFR1 subregion as the best prognostic marker of bad disease evolution among other 8p amplifications. The identification of the best candidate drivers or the best therapeutic targets could refine the impact of the 8p12 amplification on survival and help determine which pop-ulation should be targeted.
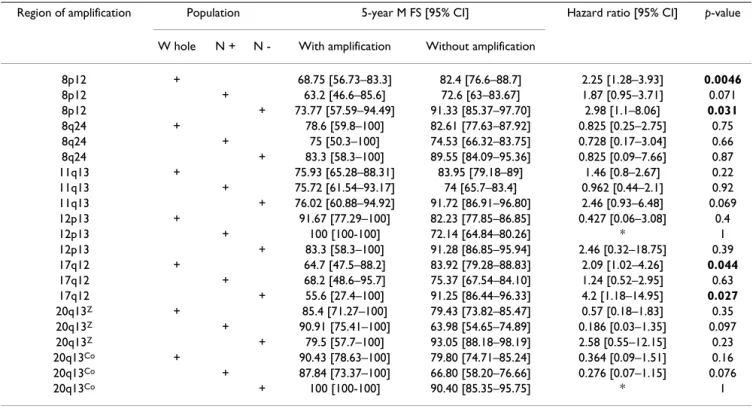
Table 3: Cox univariate analyses of metastasis-free survival.
Region of amplification Population 5-year M FS [95% CI] Hazard ratio [95% CI] p-value
W hole N + N - With amplification Without amplification
8p12 + 68.75 [56.73–83.3] 82.4 [76.6–88.7] 2.25 [1.28–3.93] 0.0046 8p12 + 63.2 [46.6–85.6] 72.6 [63–83.67] 1.87 [0.95–3.71] 0.071 8p12 + 73.77 [57.59–94.49] 91.33 [85.37–97.70] 2.98 [1.1–8.06] 0.031 8q24 + 78.6 [59.8–100] 82.61 [77.63–87.92] 0.825 [0.25–2.75] 0.75 8q24 + 75 [50.3–100] 74.53 [66.32–83.75] 0.728 [0.17–3.04] 0.66 8q24 + 83.3 [58.3–100] 89.55 [84.09–95.36] 0.825 [0.09–7.66] 0.87 11q13 + 75.93 [65.28–88.31] 83.95 [79.18–89] 1.46 [0.8–2.67] 0.22 11q13 + 75.72 [61.54–93.17] 74 [65.7–83.4] 0.962 [0.44–2.1] 0.92 11q13 + 76.02 [60.88–94.92] 91.72 [86.91–96.80] 2.46 [0.93–6.48] 0.069 12p13 + 91.67 [77.29–100] 82.23 [77.85–86.85] 0.427 [0.06–3.08] 0.4 12p13 + 100 [100-100] 72.14 [64.84–80.26] * 1 12p13 + 83.3 [58.3–100] 91.28 [86.85–95.94] 2.46 [0.32–18.75] 0.39 17q12 + 64.7 [47.5–88.2] 83.92 [79.28–88.83] 2.09 [1.02–4.26] 0.044 17q12 + 68.2 [48.6–95.7] 75.37 [67.54–84.10] 1.24 [0.52–2.95] 0.63 17q12 + 55.6 [27.4–100] 91.25 [86.44–96.33] 4.2 [1.18–14.95] 0.027 20q13Z + 85.4 [71.27–100] 79.43 [73.82–85.47] 0.57 [0.18–1.83] 0.35 20q13Z + 90.91 [75.41–100] 63.98 [54.65–74.89] 0.186 [0.03–1.35] 0.097 20q13Z + 79.5 [57.7–100] 93.05 [88.18–98.19] 2.58 [0.55–12.15] 0.23 20q13Co + 90.43 [78.63–100] 79.80 [74.71–85.24] 0.364 [0.09–1.51] 0.16 20q13Co + 87.84 [73.37–100] 66.80 [58.20–76.66] 0.276 [0.07–1.15] 0.076 20q13Co + 100 [100-100] 90.40 [85.35–95.75] * 1
The MYC gene on 8q24 encodes a transcriptional regula-tor whose expression is strongly associated with cell pro-liferation. MYC amplification occurs in several types of cancers [49,50]. We found that the incidence of MYC amplification was in the range of those described previ-ously [19]. About 13% of tumors contained either ampli-fied MYC or ERBB2, whereas simultaneous amplification of both was seen in 1.9%. About 22% of tumors
con-tained either amplified MYC or CCND1, whereas simulta-neous amplification of both was found in 4.2%. MYC amplification was correlated with high grade and tended to be associated with high proliferation index, in agree-ment with previous studies [19]. Although the expression of the MYC protein is stimulated by estrogen and down-regulated by tamoxifen in hormone-responsive breast tumors in vitro [51-54], we found that MYC amplification Table 4: Cox multivariate analysis of metastasis free survival for patients without axillary lymph node invasion.
Variable Coefficient value Hazard ratio 95% CI p-value
8p12 0.925 0.15 Non Amplified 1 Amplified 2.52 (0.72–8.79) Ki67 1.29 0.055 <20 1 ≥20 3.63 (0.97–13.52)
Amplification status and associated metastasis-free survival in breast cancer
Figure 3
Amplification status and associated metastasis-free survival in breast cancer. A. Impact of the amplification of 8p12
region on MFS of the whole population (N = 219). B. Impact of the amplification of 8p12 region on MFS of N- patients (N = 114). C. Impact of the amplification of 17q12 region on MFS of the whole population (N = 272). D. Impact of the amplification of 17q12 region on MFS of N- patients (N = 140). E. Impact of the co-amplification of 8p12 and 17q12 regions on MFS of N- patients (N = 84). Kaplan-Meier curves illustrate MFS according to the status of amplification of different regions analyzed.
was correlated with the absence of estrogen receptor, which is in agreement with other studies [21,55] but con-tradictory to others [56,57]. No correlation was found with hormonotherapy (data not shown). With respect to prognosis, MYC amplification was not associated with MFS, neither in the whole population nor in the two dif-ferent lymph node populations of patients. This is consist-ent with a previous study [58].
Amplification of the 11q13 region is a relatively frequent event in breast tumors [59]. This region harbors four dis-tinct subregions of amplification, which can be amplified independently or together in different combinations [59,60]. Candidate genes have been suggested such as
CCND1, EMS1, and PAK1 [60]. Amplification of CCND1
is within the most frequently amplified subregion and is found in two-thirds of all 11q13 amplifications. CCND1 overexpression promotes tumorigenesis in transgenic mice [61]. Amplification could promote sustained expres-sion, which may cause the cell to cycle continuously. Amplification of CCND1 was found in 19.6% which is close to what is usually found in breast tumors. No asso-ciation with histoclinical factors or survival was found, in disagreement with published data [22,62].
Amplification of 12p13 in breast cancers was first identi-fied by Dib et al. (1994) [6] and characterized by compar-ative genomic hybridization by Yao et al. (2006) [7]. Overexpression of presumptive amplicon genes was found in medullary breast cancers [25]. Amplification of the short arm of chromosome 12, mostly as isochromo-some, or as amplified 12p11-12 and 12p13 regions, is a hallmark of testicular germ cell tumors (TGCT) [63-65] and its overrepresentation is related to invasive growth of TGCT [66]. The 12p13 region harbors several candidate
cancer genes. Human embryonic stem cell genes NANOG,
GDF3 and STELLA, which are downregulated when cells
commit differentiation, are expressed in TGCT and in breast cancers [67,68]. This suggests a role of these stem cell genes in carcinoma progression. Like CCND1, the CCND2 protein is involved in G1 phase of the cell cycle.
NOL1 encodes the nucleolar protein P120, a
prolifera-tion-associated antigen that is temporally regulated dur-ing the cell cycle with an increase in protein expression at the G1/S transition. The choice of the NOL1 region for FISH was further suggested because its protein expression is associated with overall survival in node-negative breast cancers [69]. However, we did not find any association between amplification and survival. The 12p13 amplicon was correlated with 20q13Z, which may also be associated
with proliferation.
ERBB2 amplification was found in 9.9% of tumors and
was associated with high grade, absence of steroid recep-tors, overexpression of ERBB2 protein, and high prolifera-tion index, which is an agreement with previous studies [17,70,71]. In univariate analysis, ERBB2 amplification was associated with MFS in the whole population and in N- patients. This is consistent with a poor outcome reported in several studies [43,71-73].
We found the 20q13 region amplified in 8.5–9.9% of tumors, which is consistent with frequencies previously reported in sporadic breast cancers [3,27-29] as well as in familial breast cancer [74]. The 20q13 amplified region was associated with 8q24, 11q13 and 12p13 amplifica-tions. Co-amplification of 11q13/20q13 occurred in 1.6% of cases. The 20q13Co amplification was associated with
high grade and axillary lymph node invasion, in agree-ment with previous studies [27,29]. Amplification of Table 5: Correlation between the amplification and molecular breast subtypes.
Region of amplification
Basal Non Basal p-value ERBB2 Non ERBB2 p-value Luminal A Non Luminal A
p-value
No. of patients (%) No. of patients (%) No. of patients (%)
11q13 Amplification 1 (5.5) 22 (45.8) p = 0.006 2 (25) 21 (36.2) NS 19 (57.6) 4 (12.1) p = 0.0003 No Amplification 17 (94.5) 26 (54.2) 6 (75) 37 (63.8) 14 (42.4) 29 (87.9) 12p13 Amplification 5 (27.8) 2 (4.2) p = 0.02 1 (11.1) 6 (10.5) NS 1 (3.1) 6 (17.6) NS No Amplification 13 (72.2) 46 (95.8) 8 (88.9) 51 (89.5) 31 (96.9) 28 (82.4) 17q12 Amplification 0 (0) 6 (17.6) NS 5 (71.4) 1 (2.2) p = 2.061e-06 0 (0) 6 (20) NS No Amplification 19 (100) 28 (82.4) 2 (28.6) 45 (97.8) 23 (100) 24 (80) p = 0.065 NS: Not significant
20q13Z was associated with progesterone receptor
nega-tivity and with an accumulation of P53 in cells. Aberrant expression of 20q13 genes may be selected during breast cancer progression because it allows breast cells to over-come senescence and/or apoptosis. This is likely to be due to ZNF217 which promotes immortalization of human mammary epithelial cells [33] and plays a role in sup-pressing apoptosis [34]. Overexpression of other genes such as AURKA or MYBL2, which encode proteins involved in cell cycle regulation, could generate genomic instability. This accumulation of alterations could then lead to an increased sensitivity to chemotherapy and may explain the better prognosis for patients with amplified 20q13Co region [29].
Amplifications and molecular subtypes
We found that the 12p13 amplification was correlated with the basal subtype, which is in agreement with previ-ous expression profiling data [25]. Moreover, the 12p13 amplification was correlated with high grade, absence of steroid receptors and high proliferation index, which are all features of the basal subtype. In contrast, the 11q13 (CCND1) amplification was negatively correlated with the basal subtype and strongly correlated with the luminal A subtype. This is consistent with a previous study [75] that found an inverse correlation between basal-like markers and CCND1 amplification.
Conclusion
Our results show that regional amplification and co-amplification can be associated with pejorative evolution of breast cancer. Prognosis relevance applies for 8p12 and 17q12 amplifications analyzed as individual variable, and for 8p12/17q12 co-amplification. The 8p12 region has the most important impact on clinical outcome in two populations of patients: whole and axillary lymph node-negative. Therefore, 8p12 amplification could be used as a marker of adverse evolution in good prognosis breast cancer.
Abbreviations
Amp: Amplification, BAC: Bacterial artificial chromo-some, ER: Estrogen receptor, FISH: Fluorescence in situ hybridization, IHC: Immunohistochemistry, MFS: Metas-tasis-free survival, N-: axillary lymph node negative, N+: axillary lymph node positive, NS: Not significant, PR: Pro-gesterone receptor, TGCT: Testicular germ cell tumors, TMA: Tissue microarray.
Competing interests
The author(s) declare that they have no competing inter-ests.
Authors' contributions
AL, FS, CG, NC, FM, VGB carried out the FISH experi-ments, tissue microarray and immunohistochemistry were done by JG and read by ECJ, JJ. CZ, PF and BE did the statistical analyses. PV provided clinical data. AL, DB and MC drafted the manuscript. PV, DB and MC designed and coordinated the study. All authors read and approved the final manuscript.
Additional material
Acknowledgements
We thank F. Birg, D. Maraninchi and L. Xerri for encouragements, C. Chabannon for biobank sample management. This work was supported by Institut Paoli-Calmettes, INSERM, and grants from Ligue Nationale Contre le Cancer (LNCC) (Label 2003–2006), the Association pour la Recherche contre le Cancer (ARC-3128) and Ministries of Health and Research (Can-céropôle PACA). CG, FM, and FS have been supported by a fellowship from Ministry of Research, VGB by a fellowship from ARC, and AL by a fellow-ship from LNCC.
References
1. Beckmann MW, Niederacher D, Schnurch HG, Gusterson BA, Bender HG: Multistep carcinogenesis of breast cancer and
tumour heterogeneity. J Mol Med 1997, 75(6):429-439.
2. Tanner MM, Tirkkonen M, Kallioniemi A, Isola J, Kuukasjarvi T, Col-lins C, Kowbel D, Guan XY, Trent J, Gray JW, Meltzer P, Kallioniemi OP: Independent amplification and frequent co-amplification
of three nonsyntenic regions on the long arm of chromo-some 20 in human breast cancer. Cancer Res 1996, 56(15):3441-3445.
3. Cuny M, Kramar A, Courjal F, Johannsdottir V, Iacopetta B, Fontaine H, Grenier J, Culine S, Theillet C: Relating genotype and
pheno-type in breast cancer: an analysis of the prognostic signifi-cance of amplification at eight different genes or loci and of p53 mutations. Cancer Res 2000, 60(4):1077-1083.
4. Al-Kuraya K, Schraml P, Torhorst J, Tapia C, Zaharieva B, Novotny H, Spichtin H, Maurer R, Mirlacher M, Kochli O, Zuber M, Dieterich H, Mross F, Wilber K, Simon R, Sauter G: Prognostic relevance of
gene amplifications and coamplifications in breast cancer. Cancer Res 2004, 64(23):8534-8540.
5. Gelsi-Boyer V, Orsetti B, Cervera N, Finetti P, Sircoulomb F, Rouge C, Lasorsa L, Letessier A, Ginestier C, Monville F, Esteyries S, Adelaide J, Esterni B, Henry C, Ethier SP, Bibeau F, Mozziconacci MJ, Charafe-Jauffret E, Jacquemier J, Bertucci F, Birnbaum D, Theillet C, Chaffanet M: Comprehensive profiling of 8p11-12
amplifica-tion in breast cancer. Mol Cancer Res 2005, 3(12):655-667.
6. Dib A, Adelaide J, Coujal F, Courseaux A, Jacquemier J, Gaudray P, Theillet C, Pebusque MJ, Birnbaum D: Co-amplification in human
breast tumors and physical linkage at chromosomal band
Additional file 1
Correlation between amplified regions analyzed by FISH.xls
Click here for file
[http://www.biomedcentral.com/content/supplementary/1471-2407-6-245-S1.xls]
Additional file 2
Correlation between amplified regions determined by FISH and histoclin-ical factors.xls
Click here for file
[http://www.biomedcentral.com/content/supplementary/1471-2407-6-245-S2.xls]
12p13, of CCND2 and FGF6 genes. International Journal of Oncol-ogy 1994, 5:1375-1378.
7. Yao J, Weremowicz S, Feng B, Gentleman RC, Marks JR, Gelman R, Brennan C, Polyak K: Combined cDNA array comparative
genomic hybridization and serial analysis of gene expression analysis of breast tumor progression. Cancer Res 2006, 66(8):4065-4078.
8. Slamon DJ, Clark GM, Wong SG, Levin WJ, Ullrich A, McGuire WL:
Human breast cancer: correlation of relapse and survival with amplification of the HER-2/neu oncogene. Science 1987, 235(4785):177-182.
9. Kallioniemi OP, Kallioniemi A, Kurisu W, Thor A, Chen LC, Smith HS, Waldman FM, Pinkel D, Gray JW: ERBB2 amplification in breast
cancer analyzed by fluorescence in situ hybridization. Proc Natl Acad Sci U S A 1992, 89(12):5321-5325.
10. Vogel CL, Cobleigh MA, Tripathy D, Gutheil JC, Harris LN, Fehren-bacher L, Slamon DJ, Murphy M, Novotny WF, Burchmore M, Shak S, Stewart SJ, Press M: Efficacy and safety of trastuzumab as a
sin-gle agent in first-line treatment of HER2-overexpressing metastatic breast cancer. J Clin Oncol 2002, 20(3):719-726.
11. Theillet C, Adelaide J, Louason G, Bonnet-Dorion F, Jacquemier J, Adnane J, Longy M, Katsaros D, Sismondi P, Gaudray P, et al.: FGFRI
and PLAT genes and DNA amplification at 8p12 in breast and ovarian cancers. Genes Chromosomes Cancer 1993, 7(4):219-226.
12. Courjal F, Theillet C: Comparative genomic hybridization
anal-ysis of breast tumors with predetermined profiles of DNA amplification. Cancer Res 1997, 57(19):4368-4377.
13. Adelaide J, Chaffanet M, Imbert A, Allione F, Geneix J, Popovici C, van Alewijk D, Trapman J, Zeillinger R, Borresen-Dale AL, Lidereau R, Birnbaum D, Pebusque MJ: Chromosome region 8p11-p21:
refined mapping and molecular alterations in breast cancer. Genes Chromosomes Cancer 1998, 22(3):186-199.
14. Ugolini F, Adelaide J, Charafe-Jauffret E, Nguyen C, Jacquemier J, Jor-dan B, Birnbaum D, Pebusque MJ: Differential expression assay of
chromosome arm 8p genes identifies Frizzled-related (FRP1/FRZB) and Fibroblast Growth Factor Receptor 1 (FGFR1) as candidate breast cancer genes. Oncogene 1999, 18(10):1903-1910.
15. Bonilla M, Ramirez M, Lopez-Cueto J, Gariglio P: In vivo
amplifica-tion and rearrangement of c-myc oncogene in human breast tumors. J Natl Cancer Inst 1988, 80(9):665-671.
16. Berns EM, Klijn JG, van Putten WL, van Staveren IL, Portengen H, Foekens JA: c-myc amplification is a better prognostic factor
than HER2/neu amplification in primary breast cancer. Can-cer Res 1992, 52(5):1107-1113.
17. Berns EM, Foekens JA, van Putten WL, van Staveren IL, Portengen H, de Koning WC, Klijn JG: Prognostic factors in human primary
breast cancer: comparison of c-myc and HER2/neu amplifi-cation. J Steroid Biochem Mol Biol 1992, 43(1-3):13-19.
18. Roux-Dosseto M, Romain S, Dussault N, Desideri C, Piana L, Bonnier P, Tubiana N, Martin PM: c-myc gene amplification in selected
node-negative breast cancer patients correlates with high rate of early relapse. Eur J Cancer 1992, 28A(10):1600-1604.
19. Deming SL, Nass SJ, Dickson RB, Trock BJ: C-myc amplification in
breast cancer: a meta-analysis of its occurrence and prog-nostic relevance. Br J Cancer 2000, 83(12):1688-1695.
20. Schlotter CM, Vogt U, Bosse U, Mersch B, Wassmann K: C-myc, not
HER-2/neu, can predict recurrence and mortality of patients with node-negative breast cancer. Breast Cancer Res 2003, 5(2):R30-6.
21. Aulmann S, Adler N, Rom J, Helmchen B, Schirmacher P, Sinn HP:
c-myc amplifications in primary breast carcinomas and their local recurrences. J Clin Pathol 2006, 59(4):424-428.
22. Seshadri R, Lee CS, Hui R, McCaul K, Horsfall DJ, Sutherland RL:
Cyclin DI amplification is not associated with reduced over-all survival in primary breast cancer but may predict early relapse in patients with features of good prognosis. Clin Cancer Res 1996, 2(7):1177-1184.
23. Kononen J, Bubendorf L, Kallioniemi A, Barlund M, Schraml P, Leighton S, Torhorst J, Mihatsch MJ, Sauter G, Kallioniemi OP: Tissue
microarrays for high-throughput molecular profiling of tumor specimens. Nat Med 1998, 4(7):844-847.
24. Naidu R, Wahab NA, Yadav MM, Kutty MK: Expression and
ampli-fication of cyclin D1 in primary breast carcinomas:
relation-ship with histopathological types and clinico-pathological parameters. Oncol Rep 2002, 9(2):409-416.
25. Bertucci F, Finetti P, Cervera N, Charafe-Jauffret E, Mamessier E, Adelaide J, Debono S, Houvenaeghel G, Maraninchi D, Viens P, Charpin C, Jacquemier J, Birnbaum D: Gene expression profiling
shows medullary breast cancer is a subgroup of basal breast cancers. Cancer Res 2006, 66(9):4636-4644.
26. Isola JJ, Kallioniemi OP, Chu LW, Fuqua SA, Hilsenbeck SG, Osborne CK, Waldman FM: Genetic aberrations detected by
compara-tive genomic hybridization predict outcome in node-nega-tive breast cancer. Am J Pathol 1995, 147(4):905-911.
27. Tanner MM, Tirkkonen M, Kallioniemi A, Holli K, Collins C, Kowbel D, Gray JW, Kallioniemi OP, Isola J: Amplification of
chromo-somal region 20q13 in invasive breast cancer: prognostic implications. Clin Cancer Res 1995, 1(12):1455-1461.
28. Hodgson JG, Chin K, Collins C, Gray JW: Genome amplification
of chromosome 20 in breast cancer. Breast Cancer Res Treat
2003, 78(3):337-345.
29. Ginestier C, Cervera N, Finetti P, Esteyries S, Esterni B, Adélaïde J, Xerri L, Viens P, Jacquemier J, Charafe-Jauffret E, Chaffanet M, Birn-baum D, Bertucci F: Prognosis and gene expression profiling of
20q13-amplified breast cancers. Clinical Cancer Research 2006, 12(15):4533-4544.
30. Forozan F, Mahlamaki EH, Monni O, Chen Y, Veldman R, Jiang Y, Gooden GC, Ethier SP, Kallioniemi A, Kallioniemi OP: Comparative
genomic hybridization analysis of 38 breast cancer cell lines: a basis for interpreting complementary DNA microarray data. Cancer Res 2000, 60(16):4519-4525.
31. Sen S, Zhou H, White RA: A putative serine/threonine kinase
encoding gene BTAK on chromosome 20q13 is amplified and overexpressed in human breast cancer cell lines. Onco-gene 1997, 14(18):2195-2200.
32. Collins C, Rommens JM, Kowbel D, Godfrey T, Tanner M, Hwang SI, Polikoff D, Nonet G, Cochran J, Myambo K, Jay KE, Froula J, Cloutier T, Kuo WL, Yaswen P, Dairkee S, Giovanola J, Hutchinson GB, Isola J, Kallioniemi OP, Palazzolo M, Martin C, Ericsson C, Pinkel D, Albert-son D, Li WB, Gray JW: Positional cloning of ZNF217 and
NABC1: genes amplified at 20q13.2 and overexpressed in breast carcinoma. Proc Natl Acad Sci U S A 1998, 95(15):8703-8708.
33. Nonet GH, Stampfer MR, Chin K, Gray JW, Collins CC, Yaswen P:
The ZNF217 gene amplified in breast cancers promotes immortalization of human mammary epithelial cells. Cancer Res 2001, 61(4):1250-1254.
34. Huang G, Krig S, Kowbel D, Xu H, Hyun B, Volik S, Feuerstein B, Mills GB, Stokoe D, Yaswen P, Collins C: ZNF217 suppresses cell
death associated with chemotherapy and telomere dysfunc-tion. Hum Mol Genet 2005, 14(21):3219-3225.
35. Ginestier C, Charafe-Jauffret E, Bertucci F, Eisinger F, Geneix J, Bech-lian D, Conte N, Adelaide J, Toiron Y, Nguyen C, Viens P, Mozzicon-acci MJ, Houlgatte R, Birnbaum D, Jacquemier J: Distinct and
complementary information provided by use of tissue and DNA microarrays in the study of breast tumor markers. Am J Pathol 2002, 161(4):1223-1233.
36. Chin SF, Daigo Y, Huang HE, Iyer NG, Callagy G, Kranjac T, Gonzalez M, Sangan T, Earl H, Caldas C: A simple and reliable
pretreat-ment protocol facilitates fluorescent in situ hybridisation on tissue microarrays of paraffin wax embedded tumour sam-ples. Mol Pathol 2003, 56(5):275-279.
37. Huang TJ, Huang BJ, Liang QW, Huang CW, Fang Y: Dual
fluores-cence in situ hybridization in detection of HER-2 oncogene amplification in primary hepatocellular carcinoma. Hepatobil-iary Pancreat Dis Int 2004, 3(1):62-68.
38. Website title [www.metasystems.de]. .
39. Website title [http://www.R-project.org]. .
40. Perou CM, Sorlie T, Eisen MB, van de Rijn M, Jeffrey SS, Rees CA, Pol-lack JR, Ross DT, Johnsen H, Akslen LA, Fluge O, Pergamenschikov A, Williams C, Zhu SX, Lonning PE, Borresen-Dale AL, Brown PO, Bot-stein D: Molecular portraits of human breast tumours. Nature 2000, 406(6797):747-752.
41. Sorlie T, Tibshirani R, Parker J, Hastie T, Marron JS, Nobel A, Deng S, Johnsen H, Pesich R, Geisler S, Demeter J, Perou CM, Lonning PE, Brown PO, Borresen-Dale AL, Botstein D: Repeated observation
of breast tumor subtypes in independent gene expression data sets. Proc Natl Acad Sci U S A 2003, 100(14):8418-8423.
42. Gray JW, Collins C, Henderson IC, Isola J, Kallioniemi A, Kallioniemi OP, Nakamura H, Pinkel D, Stokke T, Tanner M, et al.: Molecular
cytogenetics of human breast cancer. Cold Spring Harb Symp Quant Biol 1994, 59:645-652.
43. Pauletti G, Dandekar S, Rong H, Ramos L, Peng H, Seshadri R, Slamon DJ: Assessment of methods for tissue-based detection of the
HER-2/neu alteration in human breast cancer: a direct com-parison of fluorescence in situ hybridization and immunohis-tochemistry. J Clin Oncol 2000, 18(21):3651-3664.
44. Ray ME, Yang ZQ, Albertson D, Kleer CG, Washburn JG, Macoska JA, Ethier SP: Genomic and expression analysis of the 8p11-12
amplicon in human breast cancer cell lines. Cancer Res 2004, 64(1):40-47.
45. Garcia MJ, Pole JC, Chin SF, Teschendorff A, Naderi A, Ozdag H, Vias M, Kranjac T, Subkhankulova T, Paish C, Ellis I, Brenton JD, Edwards PA, Caldas C: A 1 Mb minimal amplicon at 8p11-12 in breast
cancer identifies new candidate oncogenes. Oncogene 2005, 24(33):5235-5245.
46. Prentice LM, Shadeo A, Lestou VS, Miller MA, deLeeuw RJ, Makretsov N, Turbin D, Brown LA, Macpherson N, Yorida E, Cheang MC, Bent-ley J, Chia S, Nielsen TO, Gilks CB, Lam W, Huntsman DG: NRG1
gene rearrangements in clinical breast cancer: identification of an adjacent novel amplicon associated with poor progno-sis. Oncogene 2005, 24(49):7281-7289.
47. Courjal F, Cuny M, Simony-Lafontaine J, Louason G, Speiser P, Zeill-inger R, Rodriguez C, Theillet C: Mapping of DNA amplifications
at 15 chromosomal localizations in 1875 breast tumors:
def-inition of phenotypic groups. Cancer Res 1997,
57(19):4360-4367.
48. Bautista S, Theillet C: CCND1 and FGFR1 coamplification
results in the colocalization of 11q13 and 8p12 sequences in breast tumor nuclei. Genes Chromosomes Cancer 1998, 22(4):268-277.
49. Schraml P, Kononen J, Bubendorf L, Moch H, Bissig H, Nocito A, Mihatsch MJ, Kallioniemi OP, Sauter G: Tissue microarrays for
gene amplification surveys in many different tumor types. Clin Cancer Res 1999, 5(8):1966-1975.
50. Rummukainen JK, Salminen T, Lundin J, Kytola S, Joensuu H, Isola JJ:
Amplification of c-myc by fluorescence in situ hybridization in a population-based breast cancer tissue array. Mod Pathol
2001, 14(10):1030-1035.
51. Dubik D, Shiu RP: Transcriptional regulation of c-myc
onco-gene expression by estrogen in hormone-responsive human breast cancer cells. J Biol Chem 1988, 263(25):12705-12708.
52. Santos GF, Scott GK, Lee WM, Liu E, Benz C: Estrogen-induced
post-transcriptional modulation of c-myc proto-oncogene expression in human breast cancer cells. J Biol Chem 1988, 263(20):9565-9568.
53. van der Burg B, van Selm-Miltenburg AJ, de Laat SW, van Zoelen EJ:
Direct effects of estrogen on c-fos and c-myc protooncogene expression and cellular proliferation in human breast cancer cells. Mol Cell Endocrinol 1989, 64(2):223-228.
54. Le Roy X, Escot C, Brouillet JP, Theillet C, Maudelonde T, Simony-Lafontaine J, Pujol H, Rochefort H: Decrease of erbB-2 and
c-myc RNA levels in tamoxifen-treated breast cancer. Onco-gene 1991, 6(3):431-437.
55. Naidu R, Wahab NA, Yadav M, Kutty MK: Protein expression and
molecular analysis of c-myc gene in primary breast carcino-mas using immunohistochemistry and differential polymer-ase chain reaction. Int J Mol Med 2002, 9(2):189-196.
56. Varley JM, Swallow JE, Brammar WJ, Whittaker JL, Walker RA:
Alterations to either c-erbB-2 (neu) or c-myc proto-onco-genes in breast carcinomas correlate with poor short-term prognosis. Oncogene 1987, 1:423-430.
57. Berns EM, Klijn JG, van Staveren IL, Portengen H, Noordegraaf E, Foe-kens JA: Prevalence of amplification of the oncogenes c-myc,
HER2/neu, and int-2 in one thousand human breast tumours: correlation with steroid receptors. Eur J Cancer 1992, 28(2-3):697-700.
58. Park K, Kwak K, Kim J, Lim S, Han S: c-myc amplification is
asso-ciated with HER2 amplification and closely linked with cell proliferation in tissue microarray of nonselected breast can-cers. Hum Pathol 2005, 36(6):634-639.
59. Karlseder J, Zeillinger R, Schneeberger C, Czerwenka K, Speiser P, Kubista E, Birnbaum D, Gaudray P, Theillet C: Patterns of DNA
amplification at band q13 of chromosome 11 in human breast cancer. Genes Chromosomes Cancer 1994, 9(1):42-48.
60. Ormandy CJ, Musgrove EA, Hui R, Daly RJ, Sutherland RL: Cyclin
D1, EMS1 and 11q13 amplification in breast cancer. Breast Cancer Res Treat 2003, 78(3):323-335.
61. Wang TC, Cardiff RD, Zukerberg L, Lees E, Arnold A, Schmidt EV:
Mammary hyperplasia and carcinoma in MMTV-cyclin D1 transgenic mice. Nature 1994, 369(6482):669-671.
62. Bieche I, Olivi M, Nogues C, Vidaud M, Lidereau R: Prognostic
value of CCND1 gene status in sporadic breast tumours, as determined by real-time quantitative PCR assays. Br J Cancer
2002, 86(4):580-586.
63. Henegariu O, Vance GH, Heiber D, Pera M, Heerema NA:
Triple-color FISH analysis of 12p amplification in testicular germ-cell tumors using 12p band-specific painting probes. J Mol Med
1998, 76(9):648-655.
64. Summersgill B, Goker H, Weber-Hall S, Huddart R, Horwich A, Ship-ley J: Molecular cytogenetic analysis of adult testicular germ
cell tumours and identification of regions of consensus copy number change. Br J Cancer 1998, 77(2):305-313.
65. Looijenga LH, Oosterhuis JW: Pathogenesis of testicular germ
cell tumours. Rev Reprod 1999, 4(2):90-100.
66. Rosenberg C, Van Gurp RJ, Geelen E, Oosterhuis JW, Looijenga LH:
Overrepresentation of the short arm of chromosome 12 is related to invasive growth of human testicular seminomas and nonseminomas. Oncogene 2000, 19(51):5858-5862.
67. Ezeh UI, Turek PJ, Reijo RA, Clark AT: Human embryonic stem
cell genes OCT4, NANOG, STELLAR, and GDF3 are expressed in both seminoma and breast carcinoma. Cancer
2005, 104(10):2255-2265.
68. Korkola JE, Houldsworth J, Chadalavada RS, Olshen AB, Dobrzynski D, Reuter VE, Bosl GJ, Chaganti RS: Down-regulation of stem cell
genes, including those in a 200-kb gene cluster at 12p13.31, is associated with in vivo differentiation of human male germ cell tumors. Cancer Res 2006, 66(2):820-827.
69. McGrath PC, Holley DT, Hamby LS, Powell DE, Mattingly C, Freeman JW: Proliferation-associated nucleolar antigen P120: a
prog-nostic marker in node-negative breast cancer. Surgery 1994, 116(4):616-20; discussion 20-1.
70. Garcia I, Dietrich PY, Aapro M, Vauthier G, Vadas L, Engel E: Genetic
alterations of c-myc, c-erbB-2, and c-Ha-ras protooncogenes and clinical associations in human breast carcinomas. Cancer Res 1989, 49(23):6675-6679.
71. Quenel N, Wafflart J, Bonichon F, de Mascarel I, Trojani M, Durand M, Avril A, Coindre JM: The prognostic value of c-erbB2 in
pri-mary breast carcinomas: a study on 942 cases. Breast Cancer Res Treat 1995, 35(3):283-291.
72. Press MF, Bernstein L, Thomas PA, Meisner LF, Zhou JY, Ma Y, Hung G, Robinson RA, Harris C, El-Naggar A, Slamon DJ, Phillips RN, Ross JS, Wolman SR, Flom KJ: HER-2/neu gene amplification
charac-terized by fluorescence in situ hybridization: poor prognosis in node-negative breast carcinomas. J Clin Oncol 1997, 15(8):2894-2904.
73. Kakar S, Puangsuvan N, Stevens JM, Serenas R, Mangan G, Sahai S, Mihalov ML: HER-2/neu assessment in breast cancer by
immu-nohistochemistry and fluorescence in situ hybridization: comparison of results and correlation with survival. Mol Diagn
2000, 5(3):199-207.
74. Melchor L, Alvarez S, Honrado E, Palacios J, Barroso A, Diez O, Oso-rio A, Benitez J: The accumulation of specific amplifications
characterizes two different genomic pathways of evolution of familial breast tumors. Clin Cancer Res 2005, 11(24 Pt 1):8577-8584.
75. Reis-Filho JS, Savage K, Lambros MB, James M, Steele D, Jones RL, Dowsett M: Cyclin D1 protein overexpression and CCND1
amplification in breast carcinomas: an immunohistochemi-cal and chromogenic in situ hybridisation analysis. Mod Pathol
2006, 19(7):999-1009.
Pre-publication history
The pre-publication history for this paper can be accessed here:
Publish with BioMed Central and every scientist can read your work free of charge "BioMed Central will be the most significant development for disseminating the results of biomedical researc h in our lifetime."
Sir Paul Nurse, Cancer Research UK
Your research papers will be:
available free of charge to the entire biomedical community peer reviewed and published immediately upon acceptance cited in PubMed and archived on PubMed Central yours — you keep the copyright
Submit your manuscript here:
http://www.biomedcentral.com/info/publishing_adv.asp
BioMedcentral http://www.biomedcentral.com/1471-2407/6/245/pre