HAL Id: hal-00295278
https://hal.archives-ouvertes.fr/hal-00295278
Submitted on 18 Jun 2003
HAL is a multi-disciplinary open access
archive for the deposit and dissemination of
sci-entific research documents, whether they are
pub-lished or not. The documents may come from
teaching and research institutions in France or
abroad, or from public or private research centers.
L’archive ouverte pluridisciplinaire HAL, est
destinée au dépôt et à la diffusion de documents
scientifiques de niveau recherche, publiés ou non,
émanant des établissements d’enseignement et de
recherche français ou étrangers, des laboratoires
publics ou privés.
stratospheric intrusion event over Europe
P. Zanis, T. Trickl, A. Stohl, H. Wernli, O. Cooper, C. Zerefos, H. Gaeggeler,
C. Schnabel, L. Tobler, P. W. Kubik, et al.
To cite this version:
P. Zanis, T. Trickl, A. Stohl, H. Wernli, O. Cooper, et al.. Forecast, observation and modelling of
a deep stratospheric intrusion event over Europe. Atmospheric Chemistry and Physics, European
Geosciences Union, 2003, 3 (3), pp.763-777. �hal-00295278�
Atmos. Chem. Phys., 3, 763–777, 2003
www.atmos-chem-phys.org/acp/3/763/
Atmospheric
Chemistry
and Physics
Forecast, observation and modelling of a deep stratospheric
intrusion event over Europe
P. Zanis1, T. Trickl2, A. Stohl3, H. Wernli4, O. Cooper5, C. Zerefos6, H. Gaeggeler7,8, C. Schnabel7,9,10, L. Tobler8, P.
W. Kubik11, A. Priller12, H. E. Scheel2, H. J. Kanter2, P. Cristofanelli13, C. Forster3, P. James3, E. Gerasopoulos14, A.
Delcloo15, A. Papayannis16, and H. Claude17
1Research Center for Atmospheric Physics and Climatology, Academy of Athens, Athens, Greece 2Forschungszentrum Karlsruhe, IMK-IFU, Garmisch-Partenkirchen, Germany
3Lehrstuhl f¨ur Bioklimatologie und Immissionsforschung Technische Universit¨at M¨unchen, Freising, Germany 4Atmospheric Physics, ETHZ, Zurich, Switzerland
5Cooperative Institute for Research in Environmental Sciences, University of Colorado, Boulder/NOAA Aeronomy
Laboratory, Boulder, USA
6Laboratory of Climatology and Atmospheric Environment, National and Kapodistrian University of Athens, Greece 7Departement f¨ur Chemie und Biochemie, Universit¨at Bern, Switzerland
8Paul Scherrer Institute, Villigen PSI, Switzerland 9Inst. Particle Physics, ETH Hoenggerberg, Switzerland
10Scottish Universities Environmental Research Centre, East Kilbride, U.K. 11Paul Scherrer Institute, c/o ETH Hoenggerberg, Switzerland
12Institut fr Isotopenforschung und Kernphysik, Universit¨at Wien, Austria 13Institute of Atmospheric Sciences and Climate, Bologna, Italy
14Nuclear Physics Department, Aristotle Univ. of Thessaloniki, Greece 15Royal Meteorological Institute KMI, Uccle, Belgium
16Department of Physics, National Technical University of Athens, Greece
17Deutscher Wetterdienst, Meteorologisches Observatorium Hohenpeißenberg, Germany
Received: 23 December 2002 – Published in Atmos. Chem. Phys. Discuss.: 27 February 2003 Revised: 26 May 2003 – Accepted: 4 June 2003 – Published: 18 June 2003
Abstract. A wide range of measurements was carried out
in central and southeastern Europe within the framework of the EU project STACCATO (Influence of Stratosphere-Troposphere Exchange in a Changing Climate on Atmo-spheric Transport and Oxidation Capacity) with the princi-ple goal to create a comprehensive data set on stratospheric air intrusions into the troposphere along a rather frequently observed pathway over central Europe from the North Sea to the Mediterranean Sea. The measurements were based on predictions by suitable quasi-operational trajectory cal-culations using ECMWF forecast data. A predicted deep Stratosphere to Troposphere Transport (STT) event, encoun-tered during the STACCATO period on 20–21 June 2001, was followed by the measurements network almost from its inception. Observations provide evidence that the intrusion affected large parts of central and southeastern Europe. Es-pecially, the ozone lidar observations on 20–21 June 2001
Correspondence to: P. Zanis ([email protected])
at Garmisch-Partenkirchen, Germany captured the evolution of two marked tongues of high ozone with the first one de-scending to nearly 2 km, thus providing an excellent data set for model intercomparisons and validation. In addition, for the first time to our knowledge concurrent surface measure-ments of the cosmogenic radionuclides 10Be and 7Be and their ratio10Be/7Be are presented together as stratospheric tracers in a case study of a stratospheric intrusion. The ozone tracer columns calculated with the FLEXPART model were found to be in good agreement with water vapour satellite im-ages, capturing the evolution of the observed dry streamers of stratospheric origin. Furthermore, the time-height cross section of ozone tracer simulated with FLEXPART over Garmisch-Partenkirchen captures many details of the evolu-tion of the two observed high-ozone filaments measured with the IFU lidar, thus demonstrating the considerable progress in model simulations. Finally, the modelled ozone (oper-ationally available since October 1999) from the ECMWF (European Centre for Medium-Range Weather Forecasts)
atmospheric model is shown to be in very good agreement with the observations during this case study, which provides the first successful validation of a chemical tracer that is de-rived operationally from a weather forecast model. This sug-gests that coupling chemistry and weather forecast models may significantly improve both weather and chemical fore-casts in the future.
1 Introduction
Stratosphere-Troposphere Exchange (STE), understood as the flux of air or trace constituents across the tropopause, is one of the key factors controlling the budgets of ozone, water vapour and other substances in both the troposphere and the lower stratosphere. The term STE includes both directions; the Stratosphere to Troposphere Transport (STT) and Tro-posphere to Stratosphere Transport (TST). Although there is a long scientific debate in the literature over the last four decades on the relative contribution from photochemistry and STT on the origin of background tropospheric ozone (Junge, 1962; Crutzen, 1973; Chameides and Walker, 1973; Fabian and Pruchniewicz, 1977; Singh et al., 1978; Logan, 1985; Penkett and Brice, 1986; Austin and Follows, 1991; Follows and Austin, 1992; Davies and Schuepbach, 1994; Holton et al., 1995; Appenzeller et al., 1996a; Roelofs and Lelieveld, 1997; Harris et al., 1998; Lelieveld and Dentener, 2000; Monks, 2000; Stohl et al., 2000) the cross-tropopause flux estimation is still a topic of great scientific interest.
In principle, the most common occurrences of STT in the extratropics are associated with tropopause folds, which are characterized by tongues of anomalously high potential vorticity (PV) extending equatorward and formed through the isentropic transport within large-scale cyclonic and an-ticyclonic disturbances. However, still missing is a single comprehensive and quantitative picture of extratropical STE which would unify the mesoscale approach, which consid-ers the tropopause folds, and the so-called “downward con-trol principle”, which is viewed from the global perspective (Holton et al., 1995; Stohl et al., 2003). Under certain cir-cumstances, some parts of these tongues may be stretched out into elongated filaments, and under others may roll up to form isolated coherent structures containing high PV air (cut-off lows) (Holton et al., 1995). Deep and intense intrusions of stratospheric air penetrating down to lower tropospheric levels or even to the surface are more relevant than the shal-low ones for atmospheric chemistry as they clearly lead to irreversible mixing of stratospheric with tropospheric air and hence to tropospheric composition changes.
Although STT processes associated with mid-latitude tropopause folds have been widely studied over the last four decades using both observational case studies and numerical models, as reviewed by WMO (1986), Davies and Schuep-bach (1994), Holton et al. (1995), and Stohl et al. (2003),
there is just a limited number of case studies characterising a deep intrusion event on its way down to the lower tropo-sphere, based on both measurements and modelling. Lidar sounding has a great potential for such investigations (Ancel-let et al., 1991; Langford et al., 1996; Browell et al., 1998; Stohl and Trickl, 1999). Eisele et al. (1999), using lidar sounding data during a large number of STT events, found that only a few deep intrusions reach a level of 3000 m. Only the most vigorous events can produce low altitude spikes in measured stratospheric tracer concentrations such as O3,
H2O, PV,7Be, and10Be that are distinct enough to draw the
attention of the analyst to a possible stratospheric influence. At least at high mountain peaks there is a higher possibility of an observable stratospheric influence (Zanis et al., 1999; Stohl et al., 2000). Elbern et al. (1997) performed a statisti-cal assessment of deep intrusions based on ten years records of7Be, ozone, and relative humidity at two Alpine stations, Zugspitze and Wank, in Germany and found that direct deep stratospheric intrusions affect Zugspitze (2962 m asl) during 5% of the time while they affect Wank (1776 m asl) less than 2.5%. A more recent analysis by James et al. (2002) based on a different data filtering approach yielded an average an-nual stratospheric ozone fraction of 8.8% for pronounced in-trusions at the Zugsitze summit. A similar statistical assess-ment carried out for three years at Jungfraujoch (3580 m asl), Switzerland, Sonnblick (3106 m asl), Austria and Zugspitze by Stohl et al. (2000), showed that the average observed intrusion frequencies are 17%, 10%, and 7%, respectively. However, in all these studies the absolute frequency of deep stratospheric intrusions depends critically on the specifica-tion of threshold values for7Be, ozone, and relative humid-ity.
Although the stratospheric tracers O3, H2O, PV and7Be
have been widely used so far for both climatological and case studies of STT, there are only very few studies, which are mainly climatological, making use of measurements of the cosmogenic radionuclide10Be and the ratio10Be/7Be (Dibb et al., 1994; Jordan et al., 2003). The cosmogenic radionu-clides7Be and10Be are produced through spallation reac-tions mainly in the stratosphere but they cannot be considered as ideal stratospheric tracers because they attach to aerosols and hence their tropospheric lifetime is significantly con-trolled by wet scavenging processes. A way around the diffi-culties with wet deposition is to use the concentration ratio of the two radionuclides because both species are washed out in the same way (Raisbeck et al., 1981). In addition, the ratio of
10Be/7Be can also be used to trace stratospheric air, like10Be
and7Be independently because the ratio values in the strato-sphere (especially in the lower stratostrato-sphere) are much higher than in the troposphere due to the much longer half-life of
10Be (1.51106yr) compared to 7Be (53.12 d) and the
rela-tively long residence time of stratospheric air masses ranging from months to years (Raisbeck et al., 1981). Recently, three case studies based on aircraft samples showed that10Be/7Be ratios, when determined in the context of other chemical
P. Zanis et al.: A deep stratospheric intrusion event over Europe 765
constituents, can provide insight into the various mechanisms of STT (Jordan et al., 2003). However, in contrast to7Be, which is measured regularly with high-resolution gamma-ray spectrometry at Alpine peak stations, regular10Be measure-ments are scarce, especially in Europe, because its detection requires accelerator mass spectrometry, which is an expen-sive method for continuous monitoring. In the framework of STACCATO, combined measurements of10Be and7Be were carried out regularly throughout the course of a full year at Jungfraujoch and Zugspitze. A climatological study of these
7Be and10Be measurements and their ratio was presented by
Zanis et al. (2003) and it was reported that for the major-ity of the cases within the upper 10% quantile of10Be/7Be ratios measured at Zugspitze during 2000, the 10-day back trajectories indicated a direct stratospheric source.
A few of the direct deep stratospheric intrusions have been modelled adequately with numerical simulations. Schuep-bach et al. (1999a; 1999b) simulated two episodes at Jungfraujoch with doubly nested mesoscale (14 km horizon-tal resolution) versions of the “Europa Model” (EM) and “High Resolution Model” (HM) operated by the German and Swiss Weather Services, while Stohl et al. (2000) inves-tigated two episodes over the Alps using a special version of the stochastic Langrangian model FLEXPART based on ECMWF data from the lowest 29 model levels with a hori-zontal resolution of 1◦and time resolution of 3 h. The origin of relatively high surface ozone concentrations measured at Izana Observatory (Canary Islands) were also studied suc-cessfully using a coupled chemistry – GCM (ECHAM-4) at T63 resolution (1.875◦×1.875◦) (Kentarchos et al., 2000).
In the present study we provide observational evidence of a successfully forecast deep stratospheric intrusion event dur-ing 20–21 June 2001, based on a measurements network ex-tending from central to southeastern Europe operated within the framework of the EU project STACCATO. Concurrent surface measurements of the cosmogenic radionuclides10Be and7Be and their ratio10Be/7Be are used for the first time to our knowledge to investigate a stratospheric intrusion event. The observational evidence of this deep stratospheric intru-sion event is further investigated and supported by model cal-culations with the Lagrangian particle model FLEXPART as well as with the ECMWF global analysis data of potential vorticity, relative humidity and ozone, water vapour (WV) satellite images and 3-D back trajectory analysis. It should be noted that a newly available product from ECMWF is the ozone field, which is analysed and forecast operationally along with the meteorological parameters at ECMWF since October 1999 and hence this study provides a first validation of this product.
2 Data and methods
2.1 Description of forecast trajectories and measurements
A wide range of measurements were carried out in central and southeastern Europe within the framework of the EU-project STACCATO with the principle goal to collect a com-prehensive dataset on stratospheric air intrusions into the tro-posphere along a rather frequently observed pathway (Wernli and Bourqui, 2002; Sprenger and Wernli, 2003) over cen-tral Europe from the North Sea to the Mediterranean Sea. In order to cover a substantial amount of STE cases, co-ordinated measurements during short campaigns were car-ried out based on trajectory forecasts provided daily by ETH Zrich since November 2000. In a similar approach, Cooper et al. (1998) utilized forecasting techniques in order to time the launching of ozonesondes so that they intercepted tropopause folds. A warning call was issued whenever it was expected that a significant number of partner stations would be af-fected by an intrusion. These stratospheric intrusion fore-casts, based on ECMWF forefore-casts, aided the measurement groups with the set-up and planning of the observations. Ev-ery twelve hours four-day forward trajectories were started from the entire region covering the Atlantic Ocean and west-ern Europe between 250 and 600 hPa. From this large set of trajectories those that initially resided in the stratosphere (PV larger than 2 pvu) and descended during the following four days by more than 300 hPa into the troposphere were selected as “stratospheric intrusion trajectories”. The same selection criterion was used in a previous case study (Wernli, 1997) to study an intrusion associated with a major Atlantic cyclone.
Intense vertical ozone profile measurements by lidar and occasional ascents of balloon-borne ozonesondes were per-formed after a warning call was issued. ECC ozonesonde as-cents took place occasionally at Thessaloniki, Greece (40.52 N, 22.97 E) and at San Pietro Capofiume, Italy (44.65 N, 11.62 E) while radiosonde measurements at both stations were also available for all warning calls. In the present study additional ozonesonde data from Hohenpeienberg, Germany, Uccle, Belgium, and Payerne, Switzerland, were provided by the respective sounding groups. Ozone-lidar measurements were carried out at Garmisch-Partenkirchen, Germany (47.5 N, 11.06 E), with the IFU lidar, and at Thessaloniki, Greece (40.52 N, 22.97 E), with the AUTH-NTUA lidar.
The IFU ozone lidar (differential-absorption lidar, DIAL) is a three-wavelength lidar operated at 277 nm, 292 nm and 313 nm. Separate receivers (equipped with 1.1-m grating spectrographs each) are used for near-field and far-field de-tection. The operating range is 0.2 to 18 km under optimum conditions. A total of eight analogue and photon counting channels makes possible the retrieval and intercomparison of different overlapping ozone profiles. In this way, the techni-cal performance of the system can be controlled. The accu-racy of the system is approximately 3 ppb up to 6 km and
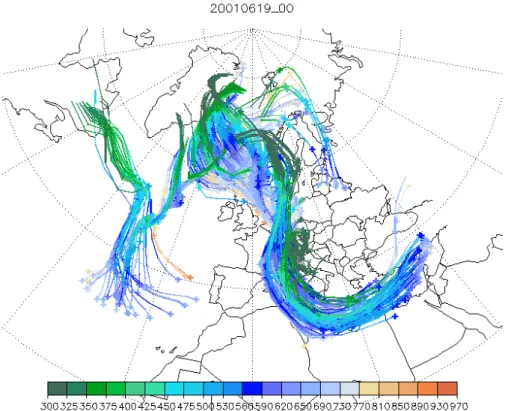
Fig. 1. Example of an operational STE forecast based upon ECMWF forecast data for the time period 19–23 June 2001 for stratospheric tracer released on 19 June, 00:00 UTC. The colour indicates the pressure value of the trajectories (in hPa).
about 5 ppb up to the tropopause, as verified by compar-isons with measurements from the local summit stations and the Hohenpeienberg ozonesondes. A single measurement is completed within 45 s due to a 100 Hz repetition rate of the KrF pump laser. The IFU lidar was typically operated at in-tervals of 1 h in the absence of clouds.
Continuous measurements of ozone,7Be and meteorologi-cal data (relative humidity, temperature, pressure, wind speed and direction) have been carried out regularly at the high-altitude stations Jungfraujoch, Switzerland (46.53 N, 7.98 E, 3580 m asl), Zugspitze, Germany (47.4 N, 11.0 E, 2962 m asl), Sonnblick, Austria (47.05 N, 12.95 E, 3106 m asl) and Mt. Cimone, Italy (44.12 N, 10.42 E, 2165 m asl). In addi-tion to the daily measurements of7Be (bi-daily for Jungfrau-joch), bi-daily measurements of 210Pb were carried out at Jungfraujoch while regular measurements of10Be were per-formed at Jungfraujoch (bi-daily) and Zugspitze (daily) with accelerator mass spectrometry (AMS). Information on the
7Be measurements at all stations can be found in
Gerasopou-los et al. (2001) and on10Be in Zanis et al. (2003).
The stratospheric intrusion event presented here influ-enced a large part of Europe. Figure 1 shows the 4-day fore-cast trajectories for the time period 19–23 June 2001, where stratospheric air from the Polar region descended deeply to-wards central Europe and in parts toto-wards Greece. In order to facilitate the interpretation of the trajectory plot (e.g. when
exactly and at what altitude a stratospheric intrusion can be expected at a specific measurements site) “intrusion hit ta-bles” for the sites Thessaloniki, Jungfraujoch, Garmisch, and Mt. Cimone were also issued daily. These are matrices of time (time step of 3 hours) versus altitude and contain a marker that indicates whether according to forecast trajec-tories the air at the respective altitude and time pertains to a deep stratospheric intrusion. For the case study presented here, the hit tables issued on 19 June 2001 at 00:00 UTC in-dicated that a stratospheric intrusion was expected to affect Jungfraujoch (625–675 hPa) from 03:00 to 18:00 UTC on 20 June 2001 (see Table 1) and Garmisch and Mt. Cimone down to 575 hPa (not shown).
2.2 Model description
Model calculations of the transport of stratospheric air into the troposphere were performed with a special version of the Lagrangian particle dispersion model FLEXPART 4.0 (Stohl et al., 1998). FLEXPART was validated with data from three large-scale tracer experiments in North America and Europe (Stohl et al., 1998) and was shown to be capable of simulat-ing intrusions of stratospheric air filaments into the lower tro-posphere (Stohl and Trickl, 1999; Stohl et al., 2000). It was also used to establish a 15-year climatology of stratosphere-troposphere exchange (James et al., 2003) and to study the
P. Zanis et al.: A deep stratospheric intrusion event over Europe 767
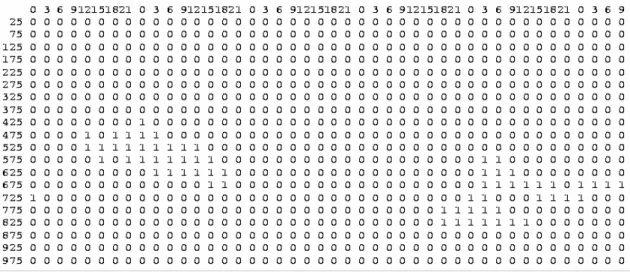
Table 1. Example of an intrusion hit table, issued on 19 June 2001 at 00:00 UTC for Jungfraujoch, based upon ECMWF forecast data for the time period 19–23 June 2001. The intrusion hit table is a matrix of time (time step of 3 hours) versus altitude and contains values of “0” and “1”, with “1” meaning that the air at the respective altitude and time originates in the stratosphere
19
Tables
Table 1: Example of an intrusion hit table, issued on 19 June 2001 at 00 UTC for
Jungfraujoch, based upon ECMWF forecast data for the time period 19-23 June 2001.
The intrusion hit table is a matrix of time (time step of 3 hours) versus altitude and
contain values of "0" and "1", with "1" meaning that the air at the respective altitude
and time originates in the stratosphere.
transport of aircraft emissions (Forster et al., 2003). This study contributes to the further validation of FLEXPART.
FLEXPART was driven with global model-level data from the European Centre for Medium-Range Weather Forecasts [ECMWF, 1995] with a horizontal resolution of 1◦, 60 ver-tical levels and a time resolution of 3 h (analyses at 00:00, 06:00, 12:00, 18:00 UTC; 3-h forecasts at 03:00, 09:00, 15:00, 21:00 UTC). FLEXPART treats advection and turbu-lent dispersion by calculating the trajectories of a multitude of particles. Stochastic fluctuations of the three wind compo-nents are superimposed on the grid-scale winds to represent transport by turbulent eddies. In the boundary layer, magni-tude and Lagrangian decorrelation times of these fluctuations are obtained from a detailed parameterisation, and above the boundary layer the turbulent components are set to small val-ues dependent upon the wind shear. To represent tive transport, FLEXPART was equipped with the convec-tion scheme developed by Emanuel and Zivkovic-Rothman (1999). This scheme uses the grid-scale temperature and hu-midity data and has the advantage of providing a uniform treatment of all types (i.e., shallow to deep) of moist con-vection. For every model column a displacement matrix is calculated that is translated into displacement probabilities for individual particles.
The model setup is similar to the one described by Stohl et al. (2000) and Stohl and Trickl (1999), but with an extended model domain stretching from 80 W to 40 E and from 25 N to 82 N and up to 16 km above sea level. This domain was filled homogeneously with particles on 12 June 2001. Only stratospheric particles were considered; tropospheric
ones were removed from the simulation. Whether a parti-cle is stratospheric or not was determined using the dynam-ical definition of the tropopause based on a threshold value for the potential vorticity (PV) of 2 potential vorticity units (pvu, 1 pvu=1 × 10⁻⁶m2K kg−1s−1). During the 12-day
simulation particles were created in the stratosphere at the inflowing boundary, and destroyed at the outflowing bound-ary. Approximately 4.5 million particles were present at any time during the simulation.
Each particle carries a certain amount of ozone so that ini-tial ozone concentrations follow the relationship with PV: O3
[ppb] = S [ppb/pvu] × PV [pvu] (Danielsen, 1968; Beek-mann et al., 1994). Based on ozonesonde data for the lower stratosphere, Stohl et al. (2000) found S = 60 (51) ppb/pvu for the month of June (July). Therefore, a value of S = 55 ppb/pvu was used here. Ozone is a passive tracer in the model, but is subject to dry deposition at the surface.
Furthermore, this study contributes to validating the ozone fields produced daily from the ECMWF operational atmospheric model. The ECMWF model uses a very simple chemistry parameterisation for ozone (Carriolle and D´equ´e, 1986) to forecast the further development of ozone, which on the timescales of typical forecasts is determined mostly by transport (for more information on ECMWF ozone forecast see http://www.ecmwf.int/newsevents/training/ meteorological presentations/html/DA Dethof/index.htm). Analysis data are produced four times per day at 00, 06, 12 and 18 UTC (http://www.ecmwf.int/services/archive/). To our knowledge, this is the first validation of a chemical tracer that is used operationally in a weather forecast model.
A ssim ilate d G O M E to ta l ozo ne K N M I/E S A , 2 0/6 /20 01 A ssim ilate d G O M E to ta l ozo ne K N M I/E S A , 2 1/6 /20 01
c)
b) a)
d)
A ssim ilate d G O M E to ta l ozo ne K N M I/E S A , 2 0/6 /20 01 A ssim ilate d G O M E to ta l ozo ne K N M I/E S A , 2 1/6 /20 01
c)
b) a)
d)
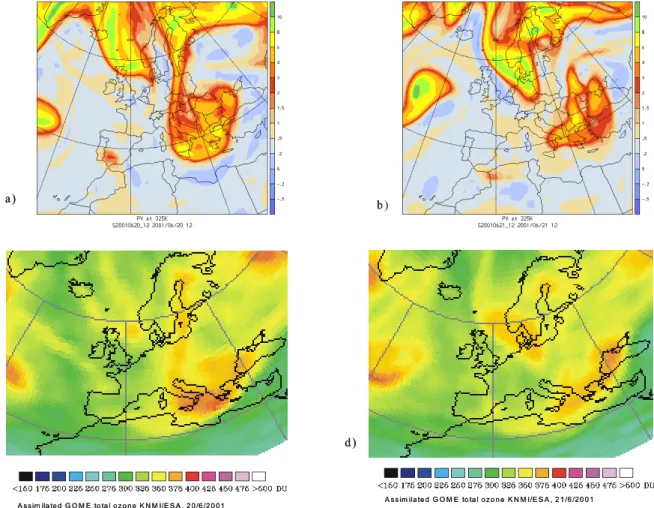
Fig. 2. Isentropic PV on the 325 K surface on 20 June 2001 12:00 UTC (a) and on 21 June 2001 12:00 UTC (b) based on the ECMWF global analysis data. The assimilated GOME total ozone (KNMI/ESA) fields for 20 June 2001 (c) and 21 June 2001 (d) are additionally shown for comparison with the PV fields.
3 Results
3.1 Description of the synoptic situation
According to the ECMWF analysis, the synoptic situation on 18 June 2001 was characterized by a deep upper-level trough at 500 hPa, extending from Scandinavia to the north of Italy and central Europe. By 19 June 2001 the upper level trough started to detach from the main flow over northern Europe with a large cut-off low developing over southeastern Europe and propagating slowly eastwards during the following two days. On 22 June 2001 the cut-off low re-connected to the main flow over northern Europe, and the upper-level trough gradually dissipated. The development of the synoptic sit-uation is documented in Fig. 2, which shows potential vor-ticity (PV) on the 325 K isentropic surface on 20 and 21 June at 12:00 UTC. A hook-shaped streamer of high PV val-ues extended southwards and turned cyclonically on 20 June (Fig. 2a). This high- streamer broke up on 21 June and part of it rolled up in the developing cut-off low (Fig. 2b). On 21
June a second high-PV feature approached central Europe from the north/north-west. The evolution of this upper-level feature is also evident in the respective GOME total column ozone measurements. The GOME total ozone maps show high values on 20 June (Fig. 2c) resembling the hook-shaped streamer of high PV on 20 June while the high total ozone values on 21 June (Fig. 2d) are clearly associated with the developed cut-off low over southeastern Europe.
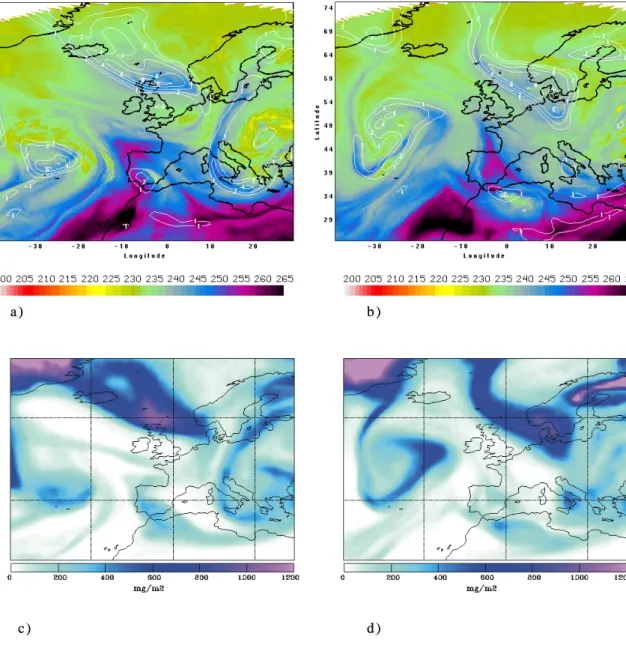
A consistent view of the stratospheric streamer of high PV and low humidity on 20 and 21 June is also obtained from the METEOSAT geostationary water vapour (WV) images (Figs. 3a and 3b), that are very useful in depicting the spa-tial extension of tongues of dry stratospheric air penetrating into the troposphere (Appenzeller et al., 1996b; Cooper et al, 2001; Wimmers et al., 2003). Figures 3a and b, which represent the temperature (K) of the top layer of WV in the atmosphere, indicate a streamer of dry air extending south-wards on 20 June (at 12:00 UTC) and being detached on 21 June (at 12:00 UTC) that coincides with the development of the stratospheric streamer in Figs. 2a and b. The PV on
P. Zanis et al.: A deep stratospheric intrusion event over Europe 769
a ) b )
c ) d )
a ) b )
c ) d )
Fig. 3. WV images on 20 June at 12:00 UTC (a) and on 21 June 12:00 UTC (b). The colour scale represents the temperature (K) of the top layer of WV in the atmosphere. The PV on the 350 hPa surface calculated from the NCEP AVN data is marked in Figs. 3a and b with white contours in pvu. The ozone tracer columns between 5500 and 11 000 m on 20 June at 12:00 UTC (c) and on 21 June 12:00 UTC (d), calculated from the FLEXPART model, are illustrated for comparison with the observations of WV.
the 350 hPa isobaric surface in Figs. 3a and b was calcu-lated from the NCEP AVN data at 1×1 degree horizontal grid spacing and 50 hPa vertical grid spacing. Thus, Figs. 3a and b clearly indicate that air of stratospheric origin charac-terised with high PV and very low WV penetrates into the troposphere over central and southeastern Europe. The WV images from the previous days indicate that this streamer of dry air was present since 18 June 2001, initially located over western Europe extending from Belgium and Holland to southern France and gradually moving eastwards over central Europe and southeastern Europe. The WV images in Figs. 3a and b compare well with the tracer simulation of the
FLEX-PART model of the ozone tracer column between 5500 and 11 000 m in Figs. 3c and d (see Sect. 3.4 for further discus-sion).
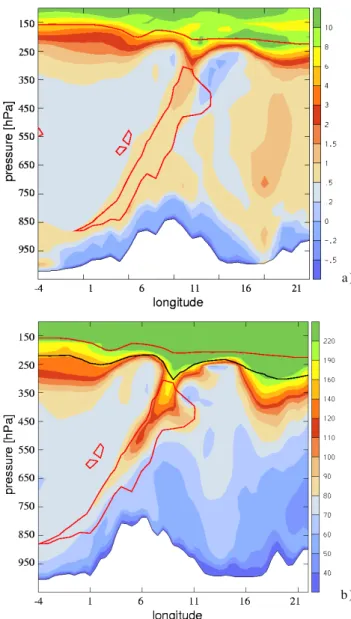
The vertical distribution of the high-PV streamer on 20 June is illustrated by the W-E oriented vertical cross-sections of PV and RH over Jungfraujoch on 20 June at 12:00 UTC, based on the ECMWF analyses (Fig. 4a). They show a tongue of high PV values associated with low RH. The PV values within the tongue range from 0.5 to 1.5 pvu suggest-ing mixsuggest-ing of stratospheric air (PV>2 pvu) with tropospheric air or other diabatic effects such as radiative erosion of PV. Ozone fields are analysed and forecast operationally along
a ) b ) a ) b ) a ) b ) a ) b )
Fig. 4. W-E oriented vertical cross-sections of PV (a) and ozone (b) over Jungfraujoch on 20 June at 12:00 UTC, based on the ECMWF global analysis data. The red line indicates low RH (15%) while the black line in b) indicates the dynamical tropopause (PV=2 pvu). The W-E oriented vertical cross section of PV at the latitude of Jungfraujoch (46.53 N, 7.98 E) ranges from 4 W to 26 E.
with the meteorological parameters at ECMWF since Octo-ber 1999. Figure 4b, which shows the ECMWF ozone fields along the same cross-section, clearly indicates an intrusion of stratospheric air rich in ozone down to the lower free tro-posphere that is correlated with the tongue of low RH and, in the upper part, elevated PV values. As the air penetrates deeper in the troposphere, ozone decreases from about 100– 120 ppbv at 450 hPa to about 80–90 ppbv at 650–700 hPa.
3.2 Profile observations
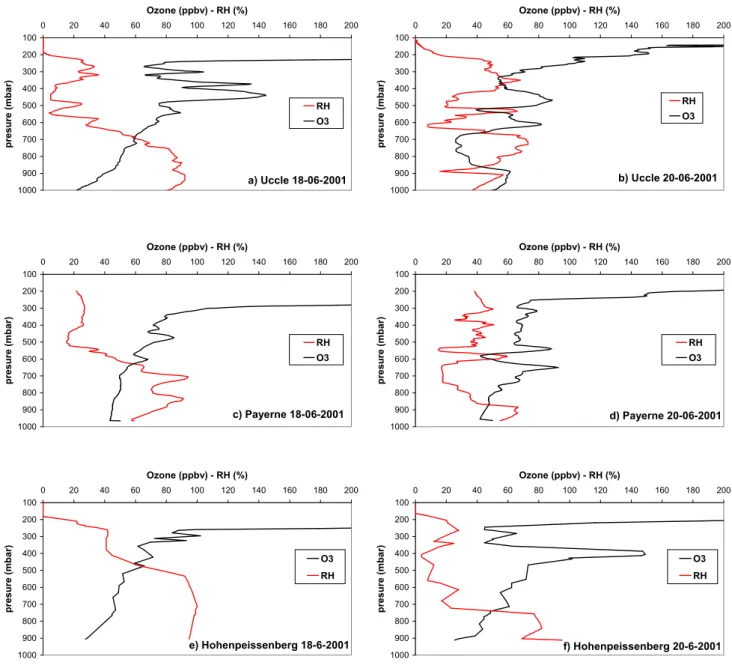
The profile measurements of ozone and RH at several sta-tions within the dry streamer area provide observational ev-idence that stratospheric air penetrated deep into the tropo-sphere. The ozonesonde and radiosonde measurements at Uccle, Belgium (50.8 N, 4.35 E) Payerne, Switzerland (46.49 N, 6.57 E) and Hohenpeienberg, Germany (47.8 N, 11.0 E) on 18 and 20 June 2001 provided snapshots of the verti-cal distribution of ozone and RH indicating dry layers rich in ozone (Fig. 5). An ozonesonde was launched from Uc-cle, into the dry streamer at 11:00 UTC 18 June, detecting a layer between 500 and 400 hPa with ozone values up to 140 ppbv and RH less than 10% (Fig. 5a), while on 20 June (at 11:00 UTC) two dry layers (RH at about 20%) were mea-sured with ozone up to 80 and 90 ppbv at about 600 and 500 hPa, respectively (Fig. 5b). All these layers may be as-cribed to the two major intrusions desas-cribed above. At Pay-erne, there is a minor peak of ozone up to 80 ppbv at 500 hPa on 18 June at 11:00 UTC (Fig. 5c), but on 20 June a large ozone peak up to 90 ppbv is revealed in the lower free tro-posphere down to 650 hPa (at 11:00 UTC) associated with very dry air (RH<20%) (Fig. 5d). At Hohenpeienberg, mi-nor structures are seen on 18 June (at 05:00 UTC), but on 20 June (at 05:00 UTC) a very prominent peak of ozone up to 140 ppb (see Uccle) is captured at 400 hPa associated with very dry air (RH<20%) (Fig. 5f). The peak at Hohenpeien-berg on 20 June is higher up compared to the ozone peak at 650 hPa at Payerne but the launch time of the ozonesonde was 6 hours earlier.
The radiosonde profiles at San Pietro Capofiume (not shown here), which is located close to Mt. Cimone in north-ern Italy, indicate a very dry layer (RH<10%) between 500 and 600 hPa at 00:00 UTC on 21 June while 12 hours later a very dry layer is located between 700 and 600 hPa. Finally, the radiosonde profiles at Thessaloniki (not shown here) indi-cate very dry air (RH<10%) between 4 and 6 km on 23 June 2001 at 06:00 and 12:00 UTC, but not on the previous days.
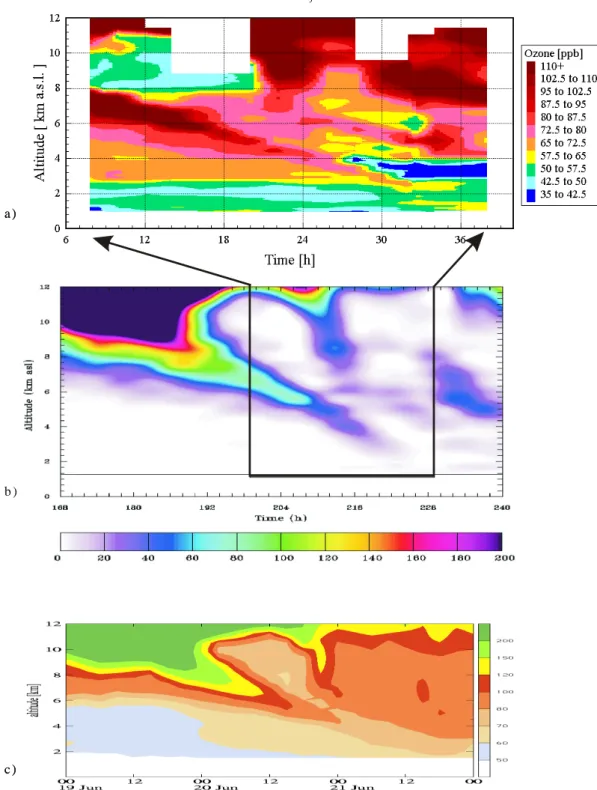
The ozone lidar measurements are extremely valuable be-cause they have the advantage of providing continuous ozone profile measurements, which may capture the evolution of an intrusion event. The time-height-plot of the ozone li-dar measurements at Garmisch-Partenkirchen, Germany, on 20–21 June 2001 captures the evolution of a rather complex episode with two marked tongues of elevated ozone with al-most 150 ppbv shortly after the beginning of the measure-ments and a minor isolated structure with elevated ozone (Fig. 6a). This minor isolated structure with elevated ozone is observed at 3 km and horizontally intersected the Zugspitze summit on 20 June, which is characterized by relative hu-midity values around 28% and a peak ozone mixing ratio of around 70 ppb (see Fig. 7a), in agreement with the lidar mea-surements. The meteorological analysis indicates that the ob-served tongue of elevated ozone is not an intrusion actively descending over Garmisch but the horizontal advection (west
P. Zanis et al.: A deep stratospheric intrusion event over Europe 771 a) Uccle 18-06-2001 100 200 300 400 500 600 700 800 900 1000 0 20 40 60 80 100 120 140 160 180 200 Ozone (ppbv) - RH (%) presure (mbar) RH O3 b) Uccle 20-06-2001 100 200 300 400 500 600 700 800 900 1000 0 20 40 60 80 100 120 140 160 180 200 Ozone (ppbv) - RH (%) presure (mbar) RH O3 c) Payerne 18-06-2001 100 200 300 400 500 600 700 800 900 1000 0 20 40 60 80 100 120 140 160 180 200 Ozone (ppbv) - RH (%) presure (mbar) RH O3 d) Payerne 20-06-2001 100 200 300 400 500 600 700 800 900 1000 0 20 40 60 80 100 120 140 160 180 200 Ozone (ppbv) - RH (%) presure (mbar) RH O3 e) Hohenpeissenberg 18-6-2001 100 200 300 400 500 600 700 800 900 1000 0 20 40 60 80 100 120 140 160 180 200 Ozone (ppbv) - RH (%) presure (mbar) O3 RH f) Hohenpeissenberg 20-6-2001 100 200 300 400 500 600 700 800 900 1000 0 20 40 60 80 100 120 140 160 180 200 Ozone (ppbv) - RH (%) presure (mbar) O3 RH
Fig. 5. Profile measurements of ozone and RH based on ozonesonde launches on 18 and 20 June 2001 at Uccle (a and b) at 11:00 UTC, at Payerne (c and d) at 11:00 UTC and at Hohenpeißenberg (e and f) at 05:00 UTC.
to east) of a pre-existing sloped feature as shown in Fig. 4. The faster the horizontal advection, the faster the apparent descent. The first marked tongue could be traced with the lidar over an exceptional vertical range from almost 8 km down to about 2 km a.s.l. This tongue is characterised by a gradual decrease of ozone as it penetrates deeper into the troposphere, possibly due to dilution. For example, ozone is 145 ppbv at 7.1 km (in excellent agreement with the sonde results), about 84 ppbv at 4.3 km after 16 hours, and then 71 ppbv at 3.0 km after the next 6 hours (Fig. 6a). The model simulations (Sect. 3.4, Figs. 6b and c) suggest that the li-dar missed the beginning of the folding event by just a few hours and that the lidar almost looked into the stratosphere
at the beginning of the observational period. Of special in-terest are the two steep downward steps in the lidar data at about 18:00 UTC (June 20) and 06:00 UTC (June 21), which contrast with the deceleration of the subsidence in the lower troposphere as shown in Plate 2 in Stohl and Trickl (1999) These steps are nicely reproduced by the FLEXPART model simulation (Fig. 6b, see Sect. 3.4). The second sloped feature started to form in the uppermost troposphere at about mid-night between June 20 and 21 and was followed by the lidar down to almost 4 km (see Sect. 3.1, Figs. 2 and 3). This is the first case in which a tropopause fold could be observed with the IFU lidar from its inception.
a ) b ) c ) a ) b ) c )
Fig. 6. (a) Time-height section of the ozone lidar measurements at Garmisch-Partenkirchen during 20 and 21 June (Central European Time (CET), = UTC + 1 h). (b) Time-height section through the FLEXPART ozone tracer field at the location of Garmisch-Partenkirchen. Time is given in hours from the start of the simulation; the plot covers the period from 19 June 00:00 UTC to 22 June 00:00 UTC. The black rectangle marks the period and altitude range of the lidar measurements. The horizontal line shows the height of the model topography. (c) Time-height section through the ECMWF ozone field at the location of Garmisch-Partenkirchen for the period from 19 June 00:00 UTC to 22 June 00:00 UTC.
P. Zanis et al.: A deep stratospheric intrusion event over Europe 773
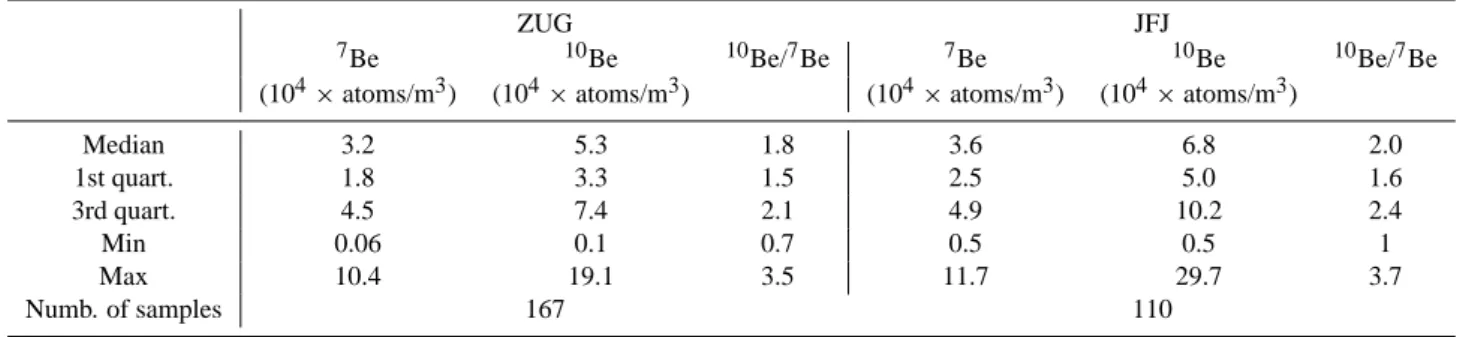
Table 2. Summary statistics of7Be,10Be and their ratio at Zugspitze and Jungfraujoch during 2000 and 2001.
ZUG JFJ
7Be 10Be 10Be/7Be 7Be 10Be 10Be/7Be
(104×atoms/m3) (104×atoms/m3) (104×atoms/m3) (104×atoms/m3)
Median 3.2 5.3 1.8 3.6 6.8 2.0 1st quart. 1.8 3.3 1.5 2.5 5.0 1.6 3rd quart. 4.5 7.4 2.1 4.9 10.2 2.4 Min 0.06 0.1 0.7 0.5 0.5 1 Max 10.4 19.1 3.5 11.7 29.7 3.7 Numb. of samples 167 110 3.3 Surface observations
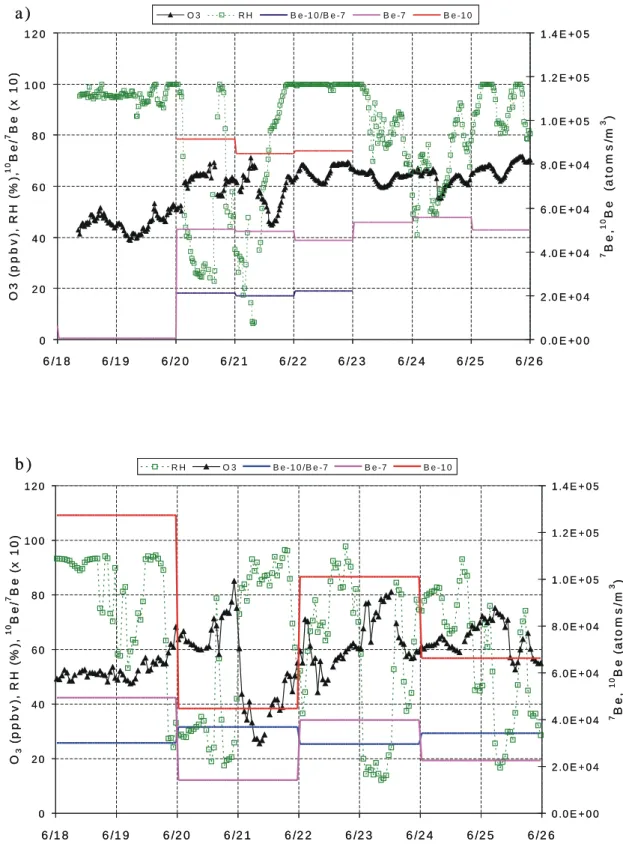
The surface measurements of humidity, ozone and the cos-mogenic radionuclides7Be and10Be at the Alpine peak sta-tions of Jungfraujoch and Zugspitze show that the strato-spheric intrusion was, indeed, detectable down to 3000 m. At Zugspitze, there is clear evidence that the intrusion reached that height as RH decreased to 20% on 20 and 21 June, while ozone rose from 52 to 69 ppbv on 20 June and 58 to 71 ppbv on 21 June (Fig. 7a), in agreement with the nearby lidar mea-surements. The daily7Be activity concentrations increased from near the detection limit of 0.1 mBq/m3(591 atoms/m3) on 18 and 19 June to 7.6 mBq/m3(5.0 × 104atoms/m3) on 20 June and remained at these high levels for several days. Precipitation data (not shown here) indicate no precipitation from 20 to 26 June, while on 18 and 19 June there was pcipitation (maximum of the whole month on 18th June) re-sulting possibly in the low daily7Be concentrations due to wet scavenging. Table 2 shows summary statistics of the7Be and10Be measurements at Zugspitze and Jungfraujoch dur-ing 2000 and 2001 for comparison purposes. The daily10Be activity concentrations measured on 20, 21 and 22 June also remain at rather high levels, ranging from about 8.5 × 10⁴to 9.2 × 10⁴atoms/m3. Although there are no10Be measure-ments on the previous days, the10Be measurements during 20, 21, and 22 June are among the highest 25% of all the
10Be measurements at Zugspitze (see Table 2). The ratios
of10Be/7Be, which is a stratospheric tracer not affected by washout, remain rather constant on 20, 21 and 22 June, rang-ing from 1.71 to 1.90 (3rd quartile = 2.1 in Table 2). Jordan et al. (2003), using aircraft samples in both the stratosphere and troposphere reported the absence of ratios <1.27 in the lowermost stratosphere indicating that ratios observed in the troposphere, nearer their production ratio of 0.60, are charac-teristic of tropospheric air with minimal stratospheric influ-ence. So the ratio measurements at Zugspitze during this case study, even though they are not among the highest recorded during 2000 and 2001 imply stratospheric influence.
At Jungfraujoch, there is also clear observational evidence that the intrusion reached that height as RH decreased to 20% on 20 June, while ozone rose from 60 up to 85 ppbv (Fig. 7b). The dry layers arrived slightly earlier than at Zugspitze due to
a more western location. The ozone increase at Jungfraujoch on 20 June is in agreement with the ozone profile data at Payerne on 20 June which show an ozone peak at 650 hPa or about 3500 m asl (Fig. 5d). Back trajectory analysis (not shown here) below, at the same level, and above Jungfraujoch on 12:00 and 18:00 UTC indicates that air masses descended from about 300 and 400 hPa over the north Atlantic region down to 650 and 700 hPa.
However, the bi-daily7Be activity concentrations decrease from about 7.5 mBq/m3 (4.9 × 10⁴atoms/m3) on 18–19 June to 2.1 mBq/m3 (1.4 × 10⁴atoms/m3) on 20–21 June. Similarly, the bi-daily10Be activity concentrations decrease from about 12.7 × 10⁴atoms/m3 on 18–19 June to 4.5 × 10⁴atoms/m3 on 20–21 June. The 7Be and 10Be activity concentrations on 20–21 June are among the lowest 25% of all the7Be and10Be measurements carried out at Jungfrau-joch during the years 2000 and 2001, respectively (see Ta-ble 2). These low7Be and 10Be activity concentrations on 20–21 June could be possibly attributed to wet scavenging but there are no precipitation data to prove this possibility. The10Be/7Be ratios stay at high levels on all days, and are among the highest 25% of all the10Be/7Be values measured at Jungfraujoch during the years 2000 and 2001 (3rd quar-tile = 2.4 in Table 2). The ratio reaches its maximum of 3.2 on 18–19 June although in contrast the independent7Be and
10Be concentrations are very low, thus providing possible
ev-idence that during occasions of wet scavenging the10Be/7Be ratio can still be a valid stratospheric tracer although7Be and
10Be are not. Nevertheless these results should be considered
with caution because the very low time resolution of the mea-surements at Jungfraujoch (bi-daily samples), which is long compared to the typical duration of a stratospheric influence, is a limiting factor.
3.4 FLEXPART and ECMWF model calculations
At upper tropospheric levels, the tracer simulation of the FLEXPART model with the ozone tracer column between 5500 and 11 000 m (FigS. 3c and d) can be compared to the WV images (Figs. 3a and b). Although such a comparison is not quantitative, structures seen in the tracer column should coincide with dry regions in the WV images. However,
a )
b )
0 2 0 4 0 6 0 8 0 1 0 0 1 2 0 6 /1 8 6 /1 9 6 /2 0 6 /2 1 6 /2 2 6 /2 3 6 /2 4 6 /2 5 6 /2 6 O 3 ( p p b v ), R H ( % ), 1 0 B e / 7 B e ( x 1 0 ) 0 .0 E + 0 0 2 .0 E + 0 4 4 .0 E + 0 4 6 .0 E + 0 4 8 .0 E + 0 4 1 .0 E + 0 5 1 .2 E + 0 5 1 .4 E + 0 5 7 B e , 1 0 B e ( a to m s /m 3 ) R H O 3 B e -1 0 /B e -7 B e -7 B e -1 0 0 2 0 4 0 6 0 8 0 1 0 0 1 2 0 6 /1 8 6 /1 9 6 /2 0 6 /2 1 6 /2 2 6 /2 3 6 /2 4 6 /2 5 6 /2 6 O 3 ( p p b v ), R H ( % ), 1 0 B e / 7 B e ( x 1 0 ) 0 .0 E + 0 0 2 .0 E + 0 4 4 .0 E + 0 4 6 .0 E + 0 4 8 .0 E + 0 4 1 .0 E + 0 5 1 .2 E + 0 5 1 .4 E + 0 5 7 B e , 1 0 B e (a to m s /m 3 ) O 3 R H B e -1 0 /B e -7 B e -7 B e -1 0a )
b )
0 2 0 4 0 6 0 8 0 1 0 0 1 2 0 6 /1 8 6 /1 9 6 /2 0 6 /2 1 6 /2 2 6 /2 3 6 /2 4 6 /2 5 6 /2 6 O 3 ( p p b v ), R H ( % ), 1 0 B e / 7 B e ( x 1 0 ) 0 .0 E + 0 0 2 .0 E + 0 4 4 .0 E + 0 4 6 .0 E + 0 4 8 .0 E + 0 4 1 .0 E + 0 5 1 .2 E + 0 5 1 .4 E + 0 5 7 B e , 1 0 B e ( a to m s /m 3 ) R H O 3 B e -1 0 /B e -7 B e -7 B e -1 0 0 2 0 4 0 6 0 8 0 1 0 0 1 2 0 6 /1 8 6 /1 9 6 /2 0 6 /2 1 6 /2 2 6 /2 3 6 /2 4 6 /2 5 6 /2 6 O 3 ( p p b v ), R H ( % ), 1 0 B e / 7 B e ( x 1 0 ) 0 .0 E + 0 0 2 .0 E + 0 4 4 .0 E + 0 4 6 .0 E + 0 4 8 .0 E + 0 4 1 .0 E + 0 5 1 .2 E + 0 5 1 .4 E + 0 5 7 B e , 1 0 B e (a to m s /m 3 ) O 3 R H B e -1 0 /B e -7 B e -7 B e -1 0Fig. 7. Surface measurements of RH, ozone,7Be,10Be concentrations and their ratio10Be/7Be at Zugspitze (a) and at Jungfraujoch (b), during the period 18–25 June 2001; the time is CET. The7Be,10Be concentrations and their ratio are daily values at Zugspitze and bi-daily at Jungfraujoch.
P. Zanis et al.: A deep stratospheric intrusion event over Europe 775
if moist air lies above the dry intrusion, the latter may be masked from the satellite’s view and thus some structures may be missing in the WV images. As the tracer plots are 3-h averages, tracer structures are smoothed and may show less fine-scale structure than the WV images. The ozone tracer columns between 5500 and 11 000 m on 20 June and 21 June at 12:00 UTC, illustrated in Figs. 3c and d, are in very good agreement with the WV images (Figs. 3a and b), resembling in space the streamer of dry air with high PV values on the 350 hPa surface extending southwards.
The time-height cross-section of the FLEXPART ozone tracer over Garmisch-Partenkirchen is compared with the re-spective time-height cross section of ozone retrieved from the IFU lidar measurements (Fig. 6a). The FLEXPART ozone tracer time-height section (Fig. 6b) shows two sepa-rate tongues of stratospheric ozone descending into the tro-posphere, separated by a region without stratospheric tracer. The ozone tracer maximum descending down to below 4 km corresponds well with the high-ozone filament seen in the li-dar data, and the smaller tongue of maximum ozone tracer in the middle of the observation period corresponds with the observed ozone maximum at an altitude of approximately 10 km on 20 June at 22:00 UTC. Both are clearly separated by ozone mixing ratios below 50 ppbv, which are typical of the troposphere. The ozone maxima observed at the end of the measurement period at 5 km and 8 km are not present in the model simulation, but a tracer maximum is seen just after the end of the observations. Generally, FLEXPART slightly underestimates the observed ozone mixing ratios within the stratospheric filaments, possibly due to a too low O3-PV
rela-tionship used in the initialisation, the neglect of tropospheric O3 and the insufficient vertical resolution. However, the
most important structures such as the two steps mentioned in Sect. 3.2 are well represented, confirming the stratospheric nature of the two observed high-ozone filaments and demon-strating the considerable quality with which FLEXPART captures the details.
Furthermore the time-height cross section of ozone re-trieved from the IFU lidar measurements provides an excel-lent opportunity to validate the ECMWF ozone which is a newly available product analysed and forecast operationally along with the meteorological parameters at ECMWF since October 1999. The ECMWF ozone time-height section over Garmisch-Partenkirchen during the same event (Fig. 6c) cap-tures successfully the two separate tongues of stratospheric ozone descending through the troposphere down to 4 km. Al-though the minor structures found in the lidar measurements cannot be seen in ECMWF ozone due to the coarse reso-lution of the ECMWF model, the most important features, however, compare very well with the lidar observations even though the O3chemistry in the ECMWF model is only
repre-sented in a simplified way. This suggests that coupling chem-istry and weather forecast models may significantly improve both weather and chemical forecasts in the future. To our knowledge, this is the first validation of a chemical tracer
that is used operationally in a weather forecast model. At the time of our case study, ozone observations were not yet assimilated into the ECMWF model. With the assimila-tion of ozone observaassimila-tions, which was started only recently (A. Hollingsworth, personal communication), the agreement would perhaps have been even better. Even more so, the quality of the ECMWF ozone data in this case is surpris-ing. It should be pointed that Roelofs et al. (2003) compared results from 6 global tropospheric chemistry models with the lidar observations of ozone during the same deep STT event and it was found that all models qualitatively captured the deep intrusion of stratospheric air, however the models with coarse vertical resolution suffered from numerical dif-fusion and thus overestimated the transport of stratospheric ozone into the troposphere, and transported it too close to the ground.
4 Conclusions
In order to cover a substantial amount of stratospheric in-trusions within the framework of the EU-project STAC-CATO, co-ordinated measurements during short campaigns were carried out based on forecast trajectories. These strato-spheric intrusion forecasts aided the measurement groups with the set-up and planning of the observations. One of the forecast STE events encountered during the STACCATO period was followed by the measurements network from its inception, providing clear observational evidence of a com-plex deep stratospheric intrusion event. Both this case study and other events that were succesfully forecast during STAC-CATO (Galani et al., 2003) proved that these STE forecasts are valuable in planning co-ordinated measurements.
The ozone tracer columns calculated with the FLEXPART model were found to be in good agreement with water vapour satellite images, capturing the evolution of the observed dry streamers of stratospheric origin. In addition, to the best of our knowledge, the first concurrent surface measurements of the cosmogenic radionuclides10Be and7Be and their ratio
10Be/7Be are presented in a case study of a stratospheric
in-trusion. At Zugspitze, the 10Be/7Be ratio values indicated stratospheric influence during this case study, even though these values were not among the highest ones recorded dur-ing 2000 and 2001 at the site. At Jungfraujoch, the10Be/7Be ratio reached its maximum value of 3.2 on 18–19 June al-though in contrast the independent 7Be and 10Be concen-trations were very low thus implying that in occasions of wet scavenging the10Be/7Be ratio can still be a valid strato-spheric tracer although7Be and10Be cannot. Nevertheless these results should be considered with caution because the low time resolution of the measurements at Jungfraujoch (bi-daily samples) and at Zugspitze ((bi-daily samples), which can be long compared to the time period of a stratospheric influ-ence, is a limiting factor.
Among the considerable amount of data providing the ob-servational evidence for the presented STT event, the ozone
lidar observations at Garmisch-Partenkirchen should be em-phasised as they captured the evolution of the descending fil-aments down to almost 2 km over Garmisch. This excellent data set was used to validate the FLEXPART model and also for the first time the ECMWF ozone, a recently available product analysed and forecast operationally along with the meteorological parameters since October 1999. Generally, FLEXPART slightly underestimated the observed ozone con-centrations within the stratospheric filaments, possibly due to a too low O3-PV relationship used in the initialisation and
the insufficent vertical resolution however, the most impor-tant structures were well represented thus demonstrating the capabilities of FLEXPART in capturing details. Finally, the ECMWF ozone product gave a correct picture of the event with the most important features in good agreement with the lidar observations even though the O3 chemistry in the
ECMWF model is only represented in a simplified way, sug-gesting that coupling chemistry and weather forecast models may significantly improve both weather and chemical fore-casts in the future.
Acknowledgements. This study was carried out within STACCATO
(Contract No. EVK2-CT1999-00050), a project funded by the Eu-ropean Commission under the Fifth Framework Programme. We also thank the Swiss Meteorological Institute (SMI) at Payerne for providing the ozonesonde data. ECMWF and Deutscher Wet-terdienst are acknowledged for providing access to the ECMWF archives. Meteosat water vapour images were provided by Space Science and Engineering Center, University of Wisconsin-Madison. The work by IFU and TUM was also funded by the German Bun-desministerium fr Bildung und Forschung (BMBF) within the AT-MOFAST project. The sampling and delivery of the air filter samples from Jungfraujoch was carried out by EMPA, D¨ubendorf, Switzerland. Relative humidity data for the Jungfraujoch were pro-vided by Meteo Schweiz, Kundendienst Bodendaten, Zurich. We thank the Swiss Agency for the Environment, Forests and Land-scape, BUWAL, for the ozone data measured at the Jungfraujoch. This work was also funded in part by the Bundeamt fuer Bildung und Wissenschaft, BBW, Berne, Switzerland.
References
Ancellet, G., Pelon, J., Beekmann, M., Papayannis A., Megie G.: Ground-based lidar studies of ozone exchanges between the stratosphere and the troposphere, J. Geophys. Res., 96(D12), 22 401–22 421, 1991.
Appenzeller, C., Holton, J. R., and Rosenlof, K. H.: Seasonal vari-ation of mass transport across the tropopause, J. Geophys. Res., 101(D10), 15 071–15 078, 1996a.
Appenzeller, C., Davies, H. C., and Norton, W. A.: Fragmentation of stratospheric intrusions, J. Geophys. Res., 101(D1), 1435– 1456, 1996b.
Austin, J. F. and Follows, M. J.: The ozone record at Payerne: An assessment of the cross-tropopause flux. Atmos. Environ., 25A(9), 1873–1880, 1991.
Beekmann, M., Ancellet, G., and M´egie, G.: Climatology of tro-pospheric ozone in southern Europe and its relation to potential vorticity, J. Geophys. Res. 99, 12 841–12 853, 1994.
Browell, E. V., Ismail, S., and Grant, W. B.: Differential absorption lidar (DIAL) measurements from air and space, Appl. Phys. B 67, 399–410, 1998.
Carriolle, D. and D´equ´e, M.: Southern hemisphere medium-scale waves and total ozone disturbances in a spectral general circula-tion model, J. Geophys., Res., 91(D10), 10 825–10 846, 1986. Chameides, W. and Walker, J. C. G.: A photochemical theory of
tropospheric ozone, J. Geophys. Res., 78(36), 8751–8760, 1973. Cooper, O. R., Moody, J. L., Davenport, J. C., Oltmans, S. J., John-son, B. J., Chen, X., ShepJohn-son, P. B., and Merrill, J. T.: The in-fluence of springtime weather systems on vertical ozone distri-butions over three North American sites, J. Geophys. Res., 103, 22 001–22 013, 1998.
Cooper, O. R., Moody, J. L., Parrish, D. D., Trainer, M., Holloway, J. S., Ryerson, T. B., H¨ubler, G., Fehsenfeld, F. C., Oltmans, S. J., and Evans, M. J.: Trace gas signatures of the airstreams within North Atlantic cyclones - Case studies from the NARE’97 aircraft intensive, J. Geophys. Res., 106, 5437–5456, 2001. Crutzen, P. J.: A discussion of the chemistry of some minor
con-stituents in the stratosphere and troposphere, Pure Appl. Geo-phys., 106–108, 1385–1399, 1973.
Danielsen, E. F.: Stratospheric-tropospheric exchange based on ra-dioactivity, ozone and potential vorticity, J. Atmos. Sci., 25, 502– 518, 1968.
Davies, T. D. and Schuepbach, E.: Episodes of high ozone con-centrations at the earth’s surface resulting from transport down from the upper troposphere/lower stratosphere: A review and case studies, Atmos. Environ., 28(1), 53–68, 1994.
Dibb, J. E., Meeker, L. D., Finkel, R. C., Southon, J. R., Caffee, M. W., Barrie, L. A.: Estimation of the stratospheric input to the Arctic troposphere: 7Be and10Be in aerosols at Alert, Canada. J. Geophys. Res. 99, 12 855–12 864, 1994.
ECMWF, User Guide to ECMWF Products 2.1, Meteorological Bulletin M3.2, ECMWF, Reading, UK, 1995.
Eisele, H., Scheel, H. E., Sladkovic, R., and Trickl, T.: High-resolution lidar measurements of stratosphere-troposphere ex-change, J. Atmos. Sci. 56, 319–330, 1999.
Elbern, H., Kowol, J., Sladkovic, R., and Ebel, A.: Deep strato-spheric intrusions: A statistical assessment with model guided analyses, Atmos. Environ., 31(19), 3207–3226, 1997.
Emanuel, K. A. and Zivkovic-Rothman, M.: Development and eval-uation of a convection scheme for use in climate models, J. At-mos. Sci. 56, 1766–1782, 1999.
Fabian, P. and Pruchniewicz, P. G.: Meridional distribution of ozone in the troposphere and its seasonal variations, J. Geophys. Res., 82, 2063–2073, 1977.
Follows, M. J. and Austin, J. F.: A zonal average model of the stratospheric contributions to the tropospheric ozone budget, J. Geophys. Res., 97(D16), 18 047–18 060, 1992.
Forster, C., Stohl, A., James, P., and Thouret, V.: The residence times of aircraft emissions in the stratosphere using a mean emis-sions inventory and emisemis-sions along actual flight tracks, J. Geo-phys. Res., 108(D12), doi: 10.1029/2002JD002515, 2003. Galani, E., Balis, D., Zanis, P., Zerefos, C. S., Papayannis, A.,
Wernli, H., Gerasopoulos, E.: Observations of Stratosphere-Troposphere Exchange events over eastern Mediterranean using a ground-based lidar system, J. Geophys. Res. 108(D12), doi: 10.1029/2002JD002596, 2003.
P. Zanis et al.: A deep stratospheric intrusion event over Europe 777
Gerasopoulos, E., Zanis, P., Stohl, A., Zerefos, C. S., Papastefanou, C., Ringer, W., Tobler, L., Huebener, S., Kanter, H. J., Tositti, L., and Sandrini, S.: A climatology of7Be at four high-altitude sta-tions at the Alps and the Northern Apennines, Atmos. Environ., 35/36, 6347–6360, 2001.
Harris, J. M., Oltmans, S. J., Dlugokencky, E. J., Noveli, P. C., John-son, B. J., and Mefford, T.: An investigation into the source of springtime tropospheric ozone maximum at Mauna Loa Obser-vatory, Geophys. Res. Lett., 25(11), 1895–1898, 1998.
Holton, J. R., Haynes, P. H., McIntyre, E. M., Douglass, A. R., Rood, R. B., and Pfister, L.: Stratosphere-troposphere exchange, Rev. Geophys., 33, 403–439, 1995.
James, P., Scheel, H. E., Stohl, A., and Trickl, T.: Deep Strato-spheric Air Intrusions Case Studies and Climatology, Procced. of EUROTRAC Symposium 2002, P. M. Midgley, M. Reuther (Eds), Margraf Verlag (Germany 2002), contribution TOR-12 (5 pp. on CD), 2002.
James, P., Stohl, A., Forster, C., Eckhardt, S., Seibert P., and Frank, A.: A 15-year climatology of stratosphere-troposphere exchange with a Lagrangian particle dispersion model, Part A: Methodology and mean climate, J. Geophys. Res., 108(D12), doi: 10.1029/2002JD002639, 2003.
Jordan, C. E., Dibb, J. E., and Finkel, R. C.: 10Be/7Be tracer of atmospheric transport and stratosphere-troposphere exchange, J. Geophys. Res., 108(D8), doi:10.1029/2002JD002395, 2003. Junge, C. E.: Global ozone budget and exchange between
strato-sphere and tropostrato-sphere, Tellus, 14, 363–377, 1962.
Kentarchos, A. S., Roelofs, G. J., Lelieveld, J., and Cuevas, E.: On the origin of elevated surface ozone concentrations at Izana Observatory, Tenerife during late March 1996, Geophys. Res. Lett., 27(22), 3699–3702, 2000.
Langford, A. O., Masters, C. D., Proffitt, M. H., Hsie, E. Y., Tuck, A. F.: Ozone measurements in a tropopause fold associated with a cut-off low system, Geophys. Res. Lett., 23(18), 2501–2504, 1996.
Lelieveld, J. and Dentener, F.: What controls tropospheric ozone, J. Geophys. Res., 105(3), 3543–3563, 2000.
Logan, J. A.: Tropospheric Ozone: Seasonal Behavior, Trends, and Anthropogenic Influence, J. Geophys. Res., 90(D6), 10 463– 10 482, 1985.
Monks, P. S.: A review of observations and origins of the spring ozone maximum, Atmos. Environ., 34(21), 3545–3561, 2000. Penkett, S. A. and Brice, K. A.: The spring maximum in
photo-oxidant in the Northern hemisphere troposphere, Nature, 319, 655–657, 1986.
Raisbeck, G. M., Yiou, F., Fruneaou, M., Loiseaux, J.M., Lieuvin, M., and Ravel, J. C.: Cosmogenic Be-10/Be-7 as a probe for atmospheric transport processes, Geophys. Res. Lett., 8, 1015– 1018, 1981.
Roelofs, G. J. and Lelieveld, J.: Model study of the influence of cross-tropopause O3 transports on tropospheric O3levels, Tellus, 49B, 38–55, 1997.
Roelofs, G. J., Kentarchos, A. S., Trickl, T., Stohl, A., Collins, W. J., Crowther, R., Hauglustaine, D., Klonecki, A., Law, K., Lawrence, M., von Kuhlmann, R., and van Weele, M.: Inter-comparison of tropospheric chemistry models: simulated ozone transport in a tropopause folding event, J. Geophys. Res., in press, 2003.
Schuepbach, E., Davies, T. D., and Massacand, A. C.: An unusual
springtime ozone episode at high elevation in the Swiss Alps; contributions both from cross-tropopause exchange and from the boundary layer, Atmos. Environ., 33, 1735–1744, 1999a. Schuepbach, E., Davies, T. D., Massacand, A. C., and Wernli,
H.: Mesoscale modelling of vertical atmospheric transport in the Alps associated with the advection of a tropopause fold a winter ozone episode, Atmos. Environ., 33, 3613–3616, 1999b. Singh, H. B., Ludwig, F. L., and Johnson, W. B.: Tropospheric
ozone: Concentrations and variabilities in clean remote atmo-spheres, Atmos. Environ., 12, 2185–2196, 1978.
Sprenger, M. and Wernli, H.: A northern hemispheric cli-matology of cross-tropopause exchange for the ERA15 time period (1979–1993), J. Geophys. Res., 108(D12), doi: 10.1029/2002JD002636, 2003.
Stohl, A., Hittenberger, M., and Wotawa, G.: Validation of the Lagrangian particle dispersion model FLEXPART against large scale tracer experiment data, Atmos. Environ., 32, 4245–4264, 1998.
Stohl, A. and Trickl, T.: A textbook example of long-range trans-port: Simultaneous observation of ozone maxima of strato-spheric and North American origin in the free troposphere over Europe, J. Geophys. Res., 104, 30 445–30 462, 1999.
Stohl, A., Spichtinger-Rakowsky, N., Bonasoni, P., Feldmann, H., Memmesheimer, M., Scheel, H. E., Trickl, T., Hubener, S., Ringer W., and Mandl, M.: The influence of stratospheric in-trusions on alpine ozone concentrations, Atmos. Environ., 34(9), 1323–1354, 2000.
Stohl, A., Bonasoni, P., Cristofanelli, P., Collins, W., Feichter, J., Frank, A., Forster, C., Gerasopoulos, E., G¨aggeler, H., James, P., Kentarchos, T., Kreipl, S., Kromp-Kolb, H., Kr¨uger, B., Land, C., Meloen, J., Papayannis, A., Priller, A., Seibert, P., Sprenger, M., Roelofs, G. J., Scheel, E., Schnabel, C., Siegmund, P., To-bler, L., Trickl, T., Wernli, H., Wirth, V., Zanis, P., Zerefos, C.: Stratosphere-troposphere exchange a review, and what we have learned from STACCATO, J. Geophys. Res., 108(D12), doi:10.1029/2002JD002490, 2003.
Wernli, H.: A Lagrangian-based analysis of extratropical cyclones. II: A detailed case study, Q. J. R. Meteorol. Soc., 123, 1677– 1706, 1997.
Wernli, H. and Bourqui, M.: A Lagrangian “1-year climatol-ogy” of (deep) cross- tropopause exchange in the extratropi-cal Northern Hemisphere, J. Geophys. Res., 107(D2), 4021, doi:10.1029/2001JD000812, 2002.
Wimmers, A. J., Moody, J. L., Browell, E. V., Hair, J. W., Grant, W. B., Butler, C. F., Fenn, M. A., Schmidt, C. C., Li, J., and Ridley B. A.: Signatures of tropopause folding in satellite imagery, J. Geophys. Res., 108(D4), doi: 10.1029/2001JD001358, 2003. World Meteorological Organization (WMO), Atmospheric ozone
1985, vol. 1, Rep. 16, 1986.
Zanis, P., Schuepbach, E., Gaeggeler, H. W., Huebener, S., and Tobler, L.: Factors controlling Berrylium-7 at Jungfraujoch in Switzerland, Tellus, 51(4), 789–805, 1999.
Zanis, P., Gerasopoulos, E., Priller, A., Schnabel, C., Stohl, A., Zerefos, C. S., G¨aggeler, H. W., Tobler, L., Kubik, P. W., Kan-ter, H. J., Scheel, H. E., Luterbacher, J., and Berger, M.: An estimate of the impact of Stratosphere-to-Troposphere Transport (STT) on the lower free tropospheric ozone over the Alps using 10Be and7Be measurements, J. Geophys. Res., 108(D12), doi: 10.1029/2002JD002604, 2003.