HAL Id: hal-00328732
https://hal.archives-ouvertes.fr/hal-00328732
Submitted on 1 Jan 1998
HAL is a multi-disciplinary open access
archive for the deposit and dissemination of sci-entific research documents, whether they are pub-lished or not. The documents may come from teaching and research institutions in France or abroad, or from public or private research centers.
L’archive ouverte pluridisciplinaire HAL, est destinée au dépôt et à la diffusion de documents scientifiques de niveau recherche, publiés ou non, émanant des établissements d’enseignement et de recherche français ou étrangers, des laboratoires publics ou privés.
from magnetic measurements
V. Doumouya, J. Vassal, Y. Cohen, O. Fambitakoye, M. Menvielle
To cite this version:
V. Doumouya, J. Vassal, Y. Cohen, O. Fambitakoye, M. Menvielle. Equatorial electrojet at African longitudes: first results from magnetic measurements. Annales Geophysicae, European Geosciences Union, 1998, 16 (6), pp.658-666. �hal-00328732�
Equatorial electrojet at African longitudes:
®rst results from magnetic measurements
V. Doumouya1, J. Vassal2, Y. Cohen3, O. Fambitakoye2, M. Menvielle4
1Laboratoire de Physique de l'AtmospheÁre, Universite d'Abidjan, Abidjan, Ivory Coast
2Laboratoire de GeÂophysique, ORSTOM, 32 av. Henri-Varagnat, F-93143 Bondy Cedex, France 3Laboratoire de GeÂomagneÂtisme, IPGP, B89, 4 Place Jussieu, F-75252 Paris Cedex 05, France 4CETP CNRS, 4 Avenue de Neptune, F-94107 Saint-Maur Des FosseÂs Cedex,France Received: 11 December 1996 / Revised: 10 October 1997 / Accepted: 13 October 1997
Abstract. In the framework of the French participation in the International Equatorial Electrojet Year (IEEY), ten magnetotelluric stations were installed between November 1992 and November 1994 along a 1200-km-long meridian pro®le, between Lamto (latitude 6.2°N, CoÃte d'Ivoire) to the south and Tombouctou (latitude 16.7°N, Mali) to the north. These stations measured digitally the three components of the magnetic ®eld and the two components of the telluric electric ®eld, and operated over a period of 20 months. The magnetic data is used to study the features of the equatorial electrojet (EEJ) in West African longitude. The measurement of the telluric electric ®eld variations will be presented elsewhere. Hourly mean values are used to study the morphological structure of the regular diurnal variation SRof the three components (H, D, and Z) of the earth
magnetic ®eld and to characterize the EEJ during magnetically quiet days. The occurrences of the count-er-electrojet (CEJ) are set forth, emphasizing its seasonal variability. Assumed to be a current ribbon, the EEJ main parameters (the position of its center, its width, and the amplitude of its current density at the center) are determined. A preliminary analysis of the time varia-tions of these parameters is presented over period of 20 months (from January 1993 to August 1994). Results are compared with those obtained during previous experi-ments of the same kind.
1 Introduction
An early observation, at Huancayo in 1922, of the enhancement of the magnetic diurnal variation near the geomagnetic equator was attributed to a narrow iono-spheric current which was later (in 1951) named by
Chapman the equatorial electrojet (EEJ). This phenom-enon has been studied through dierent types of experiments: its vertical structure has been investigated using instruments inside rockets (Sastry, 1970, Sampath and Sastry, 1979); its magnetic eects have been monitored with the help of meridian chains of magne-tometers crossing the geomagnetic equator (Chapman, 1951, Forbush and Casaverde, 1961, Fambitakoye and Mayaud, 1976a, b, c, Hesse, 1982). Ionospheric sound-ings have allowed studies on the associated ionospheric electric ®elds as well as on electron densities and on ionospheric plasma instabilities (Balsley, 1973). Mag-netic measurements onboard low-altitude satellites have also been used to study the EEJ on a global scale (Cain and Sweeney, 1973; Onwumechilli and Agu, 1980, 1981a), and to isolate its magnetic contribution from core and lithospheric ®elds (Cohen and Achache, 1990; Langel et al., 1993).
Theoretical models of the EEJ have been developed (Richmond, 1973; Stening, 1985) and have helped to understand many of its morphological characteristics. The basic physics leading to the existence of the equatorial electrojet has been extensively studied [see Forbes (1981) for a review]. Empirical models have been proposed to simulate the eect of the EEJ using simple current distributions [uniform and parabolic by Chap-man (1951), quadratic by Fambitakoye and Mayaud (1976a), two-dimensional by Onwumechilli and Agu (1982)].
Despite previous experiments, some characteristics of the EEJ still remain to be investigated, such as its day-to-day and seasonal variabilities, the occurrence of a reversal in the current called the counter electrojet (CEJ), and most of the statistical properties of the EEJ parameters, which need long-term measurements. The precise description of the interaction between the EEJ and the ionospheric current distribution on a global scale in the ionosphere needs a global and long-term campaign of measurements.
In 1989, the International Association of Geomag-netism and Aeronomy (IAGA) initiated an international
pluridisciplinary program aimed at studying the EEJ. In the frame of this program, called the International Equatorial Electrojet Year (IEEY), several countries started measurement campaigns in various equatorial areas (Africa, South America, India, Vietnam). More than 200 instruments were installed. In the African longitude sector, France started a collaboration with CoÃte d'Ivoire and Senegal (Amory-Mazaudier et al., 1993). The novelty of this experiment is the synchronous combination of the dierent types of measurements required to study the EEJ (ionosondes, HF radars, interferometer, and magnetometers network).
This paper presents the ®rst results obtained from data of ten magneto-telluric stations almost regularly spaced from the north of Mali (latitude 16.7°N) to the south of CoÃte d'Ivoire (latitude 6.2°N). In order to study the intrinsic characteristics of the EEJ, we used mea-surements from magnetically quiet days selected on the basis of magnetic activity indices. Hourly mean values of the three components of the magnetic ®eld will be used to characterize the EEJ. The position of the center, width, and amplitude of the EEJ are determined, as well as the morphology and occurrences of the CEJ. A preliminary analysis of the time variations of these parameters is presented over a period of 20 months. Results are compared with those obtained during previous experiments of the same kind.
The primary goal of this paper is to obtain an accurate description of the parameters characterizing the EEJ in the West African longitude sector, and particularly the time variations of these parameters. It is intended to set forth the main features of the EEJ on the basis of its magnetic signature in this region, for common interpretations with data of other instruments, as well as with results obtained in other longitude sectors.
2 An overview of past experiments
In this section, we present and critically discuss former experiments designed to study the EEJ, emphasizing the scienti®c possibilities and limitations of each of them. 2.1 Ground experiments
The description of the latitudinal structure of the EEJ was ®rst based on ground recordings of the regular diurnal variation (SR) of the Earth's magnetic ®eld.
Networks of stations were installed speci®cally across the magnetic equator. Forbush and Casaverde (1961) used ®ve stations in Peru, including the observatory of Huancayo, located at the geomagnetic equator. These stations covered only a part of the latitudinal band under electrojet in¯uence. In particular, the latitudinal eect on the Z component, which is wider than that on the H component, was not properly described. Never-theless, Forbush and Casaverde (1961) determined the EEJ parameters: a total width of 660 km was evidenced, and the center of the EEJ was found to follow the
secular variation in the position of the geomagnetic equator.
Four stations located in India allowed Rastogi and Iyer (1976) to show that the amplitude of the solar regular variation curves due to the EEJ (SR) was
encompassing a seasonal variability driven by the solar activity. Again, this pro®le was restricted to the northern part of the EEJ in¯uence area and data interpretation required to assume a north-south symmetry of the EEJ, an assumption which later appeared to be partly irrelevant.
Measurements performed at nine stations across Central Africa provided the best description of the EEJ to date (Fambitakoye and Mayaud, 1976a,b,c). A 3000-km-long pro®le, restricted to a 5° band of longi-tude, was occupied between November 1968 and March 1970. It allowed these authors to set forth the existence and variability of the CEJ. A statistical analysis of the characteristics of the EEJ was performed, providing monthly, seasonal, and annual means of the parameters driving the EEJ.
The lack of measurements of the electrodynamics parameters characterizing the equatorial ionosphere precluded the interpretation of, for example, the mech-anism of the CEJ. Fambitakoye et al. (1976) used a model proposed by Richmond (1973) to explain the CEJ occurrences, which is only statistically related to the various physical phenomena. In addition, this experi-ment was not designed to evaluate the internal contri-butions to the magnetic ®eld associated with the EEJ, which were then assumed to be negligible, on the basis of theoretical considerations.
2.2 Rocket measurements
The study of the EEJ requires in situ measurements of the characteristics of the ionosphere. Rocket experi-ments have been used to provide estimates of the current density along vertical pro®les (Maynard and Cahill, 1965; Maynard, 1967; Sampath and Sastry, 1979), which happened to be very similar. For example, Sampath and Sastry (1979) observed a maximum of the current density at the altitude of 106 km with a vertical half width of 12 km. Furthermore, they showed that the vertical structure remained constant during daytime and from one day to another. They showed that the current intensity was mainly responsible for the variability of the magnetic eects associated with EEJ.
Such rocket experiments are, of course, necessary to obtain in situ measurements, but cannot be used to describe the time variability of the characteristics of the EEJ.
2.3 Spatial measurements
The POGO satellites recorded continuously the Earth's total magnetic ®eld from 1967 to 1970, and provided more than 2000 pro®les across the magnetic equator. Consequently, it allowed the characterization, on a
global scale of the eect of the EEJ from altitudes between 400 and 800 km (Cain and Sweeney, 1973). The analysis of these data demonstrated several global characteristics of the EEJ (Onwumechili and Agu, 1980, 1981a, b, 1982):
the EEJ axis is very close to the geomagnetic equator, on a global scale;
the EEJ parameters (half width w, peak intensity J0,
total current I ) change with longitude and local time: w is minimum, and J0and I maximum at noon.
The MAGSAT satellite, launched in 1979 on a 300±500-km-high orbit, was not designed to study the EEJ. Nevertheless, the EEJ signature is clearly observed on the data, although weak because of the local times (6 and 18 h) of the orbits. Maeda et al. (1982) demonstrated that the D component at dusk was changing with latitude, suggesting the existence of a meridional current associated with the EEJ. The signa-ture of this current was not at all observed at dawn. Cohen and Achache (1990) used measurements of the X and Z components to show that ionospheric currents were systematically observed to ¯ow eastward at dusk, but westward at dawn, suggesting that a CEJ eect was, most of the time, measured at dawn (80% of the days). Langel et al. (1993) pointed out the fact that the EEJ description obtained from MAGSAT data is biased by the necessary use of a main ®eld model, and concluded that the CEJ eect was not really observed in the MAGSAT dawn data.
3 The 1992 IEEY experiment
The French contribution to the IEEY consisted in the deployment of several distinct experiments in order to study the various physical phenomena that are associ-ated with the equatorial electrojet (Amory-Mazaudier et al., 1993). It can be summarized as follows (see Fig. 1): Three ionosondes were installed under CNET (Cen-tre National d'Etude de Telecommunications) responsi-bility at Korhogo (CoÃte d'Ivoire), Dakar (Senegal), and Ouagadougou (Burkina Faso). Every 15 min the elec-tron densities of the ionospheric layers as a function of virtual heights were monitored.
An HF Radar was operated by the CEA (Commis-ariat aÁ l'Energie Atomique) during three months in 1993
and three other months in 1994 at Korhogo (Blanc et al., 1996). It allowed the study of the E- and F-layer density pro®les in the ionosphere, virtual re¯ection heights, echo power spectra, and consequently Doppler shifts, diurnal drift, plasma instabilities, and irregular structures (spread F, plume, small-scale inhomogeneities) by echo location.
A Fabry-Perrot interferometer was installed by UCL (University College of London) at Korhogo, and monitored the spatial and temporal properties of the neutral wind.
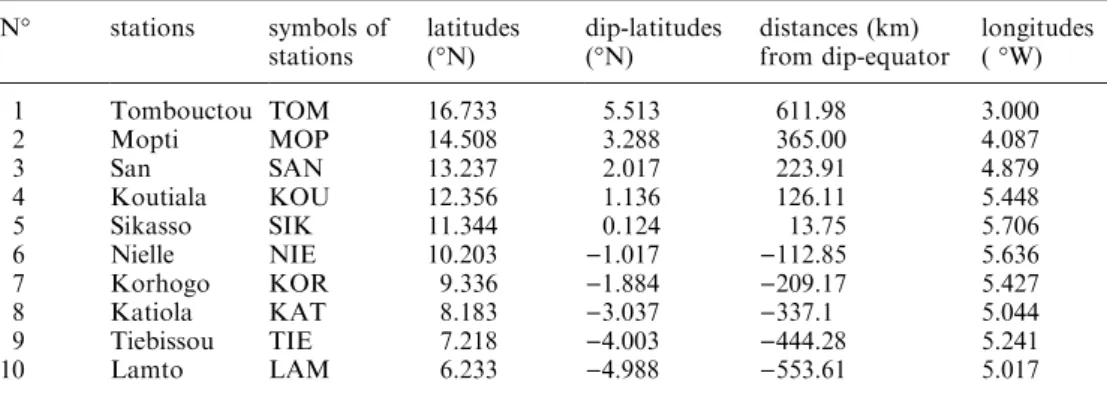
A chain of ten magnetotelluric stations was installed along the 5°W meridian, within a band of 3° of longitude and over a distance of 1200 km from Lamto to Tombouctou (see Fig. 1 and station coordinates in Table 1). At this longitude the local time (LT) is the universal time (UT). Each station measured two hori-zontal components of the transient magnetic ®eld with suspended magnet variometers, and the vertical compo-nent using a ¯uxgate magnetometer. The NS and EW components of the electric ®eld were measured using
Fig. 1. Geographic positions of stations established along meridian 5 °W, across the dip equator which is determined from IGRF at the 1993.5 epoch. Stations are represented by their ®rst three letters (see Table 1)
Table 1. Geographic positions of the magnetotelluric stations operating during the IEEY W-est African experiment
N° stations symbols of
stations latitudes(°N) dip-latitudes(°N) distances (km)from dip-equator longitudes( °W)
1 Tombouctou TOM 16.733 5.513 611.98 3.000 2 Mopti MOP 14.508 3.288 365.00 4.087 3 San SAN 13.237 2.017 223.91 4.879 4 Koutiala KOU 12.356 1.136 126.11 5.448 5 Sikasso SIK 11.344 0.124 13.75 5.706 6 Nielle NIE 10.203 )1.017 )112.85 5.636 7 Korhogo KOR 9.336 )1.884 )209.17 5.427 8 Katiola KAT 8.183 )3.037 )337.1 5.044 9 Tiebissou TIE 7.218 )4.003 )444.28 5.241 10 Lamto LAM 6.233 )4.988 )553.61 5.017
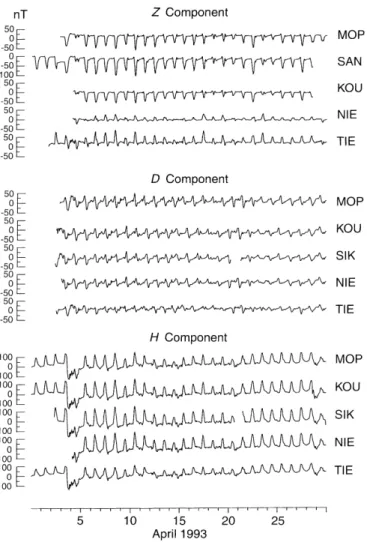
200-m-long electric lines (the analysis of the electrical measurements performed in the ten stations will be discussed in another paper). The sampling rate of every measurement was 1 min (see Fig. 2). One-minute data from the Tamanrasset observatory were also available in January, February and March 1993.
The whole system of the ground magnetotelluric experiments was maintained by ORSTOM (Institut FrancËais de Recherche Scienti®que pour le developpe-ment en CoopeÂration). Because of the presence of the ocean, this magnetometer chain was shorter than the one installed by Fambitakoye and Mayaud (1976a) further east. We will show in the next section that this does not preclude the characterization of the EEJ parameters. The magnetometers were continuously op-erated over 2 years (from November 1992 to November 1994) in order to allow the study of the seasonal variations of the EEJ parameters.
4 Data analysis and presentation
In this section, the regular daily variations SRof the H,
D, Z components of the earth magnetic ®eld are analyzed using the following procedures:
Magnetically quiet days are selected on the basis of the daily mean of magnetic activity indices (Am) being smaller than 20 nT. 250 quiet days were obtained out of the whole experiment.
The diurnal variation of a given component is determined with respect to the night level of this component, estimated by the mean value around 00 LT. Figure 3 displays minute values of the magnetic components recorded at San during some consecutive quiet days in 22±25 May 1993. We notice that the night level is almost constant around 00 LT.
In order to characterize the EEJ on the basis of its magnetic eects, we used the hourly mean values of the diurnal variations SRof the H, D, Z components.
4.1 Morphological structure of the earth magnetic diurnal variation
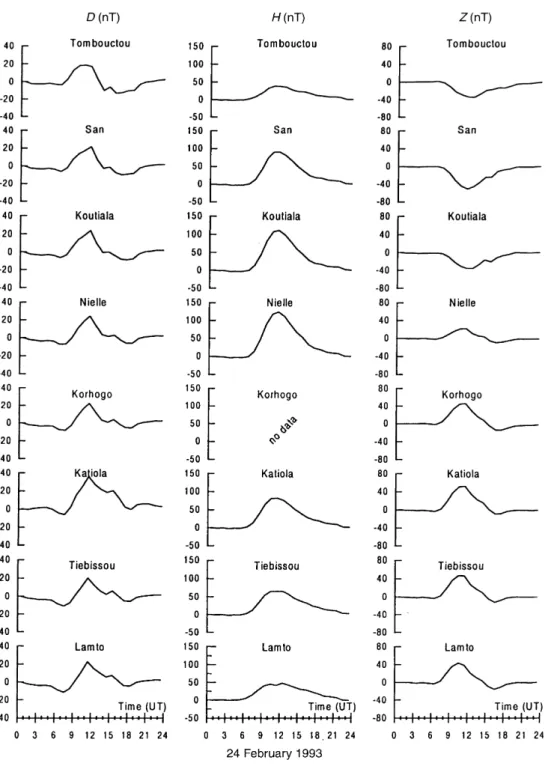
Figure 4 displays the earth magnetic diurnal variation (SR) obtained from the hourly mean values of H, D, Z
components. It can be seen that the variations obtained are consistent from one station to another. The diurnal variation of the H component is observed to present the same shape in every station. The H component regularly increases from the night level, reaches its maximum around noon, and then regularly decreases down to its night level. The noon amplitude is higher when the station is closer to the magnetic equator. The Z variations display an opposite sign from the northern side to the southern side of the magnetic equator. It is positive southward of the magnetic equator and nega-tive northward. In each hemisphere, the same shape of the Z variation is observed. The Z component becomes almost zero close to the magnetic equator.
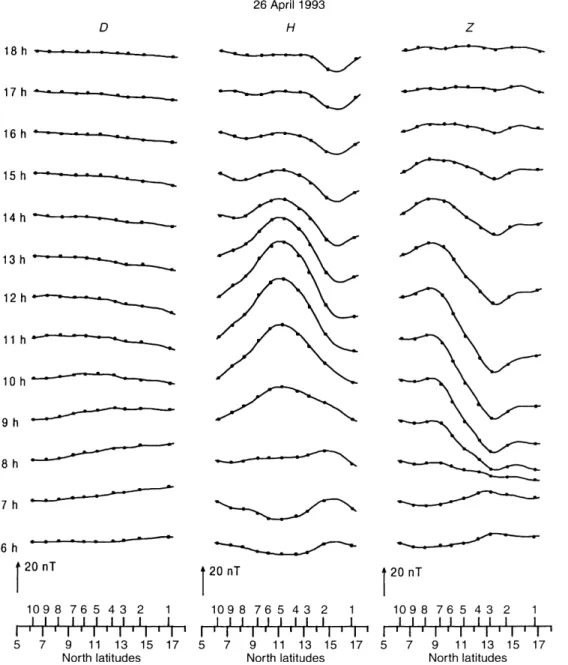
Figure 5 displays the SRhourly latitudinal pro®les of
the D, H, Z components from 06 to 18 LT on 26 April 1993 as a function of the latitude of each station from north to south. The position of each station is identi®ed by a number above the abscissa axis (number 1 for the
Fig. 2. Magnetic variations recorded at ®ve stations during April 1993
Fig. 3. Minute values of geomagnetic daily variations of horizontal (east D, north H ) and vertical Z components at San during a few consecutive quiet days in May 1993
northernmost station and number 10 for the southern-most). The hourly value of each component recorded in the southernmost (Lamto) station is substrated from corresponding values every other station. This method allow us to eliminate the eect of the Sq. An
inter-polation using spline functions has been used to plot the curves displayed in this ®gure, the points indicate the SR
hourly mean values for each station. The same method was used by Fambitakoye and Mayaud (1976a) to present the results of the Central African experiment and by Hesse (1982) for the experiment performed in the Brazilian north-east Pro®le.
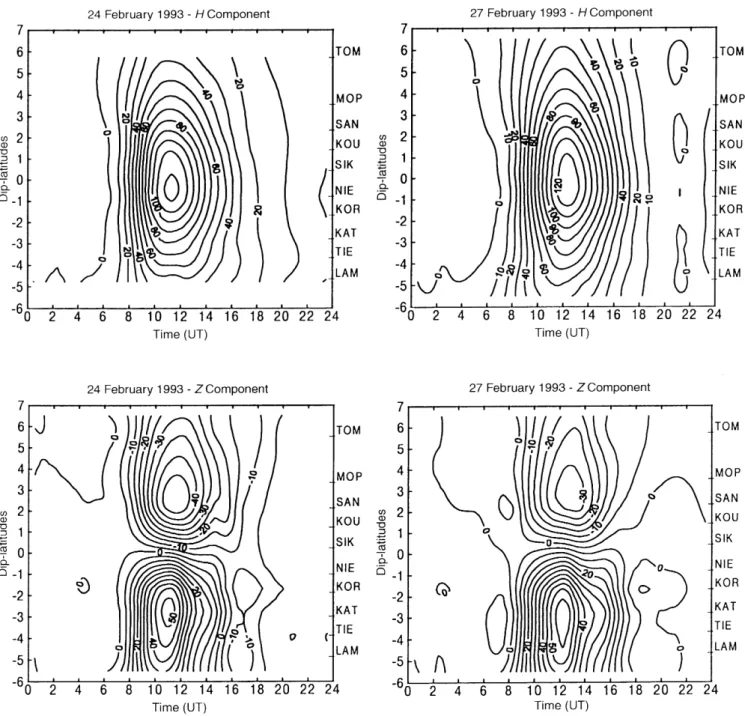
In Fig. 6, we used another way to display the results of this experiment. The contour maps of H and Z as a function of dip-latitude versus local time are presented for 24 and 27 February 1993 variations. This plot allows to easy comparison of the EEJ magnetic signature along any particular day. The contours of H show an elliptical shape stretched in the north-south direction and cen-tered over the magnetic equator around noon. One must notice that H displays a steep gradient in the morning, while in the afternoon it varies slowly, and does not systematically vanish at dusk. This fact is mainly observed near the magnetic equator.
Fig. 4. Diurnal variations of hori-zontal (east D, north H ) and vertical Z components of the magnetic ®eld recorded at eight stations of the pro®le on 24 Feb-ruary 1994
The contour map of the Z component displays two distinct extrema on each side of the magnetic equator: a negative minimum northward centered at +3° (dip-latitude); a positive maximum southward centered over )3°. This two extrema are separated by a zero line.
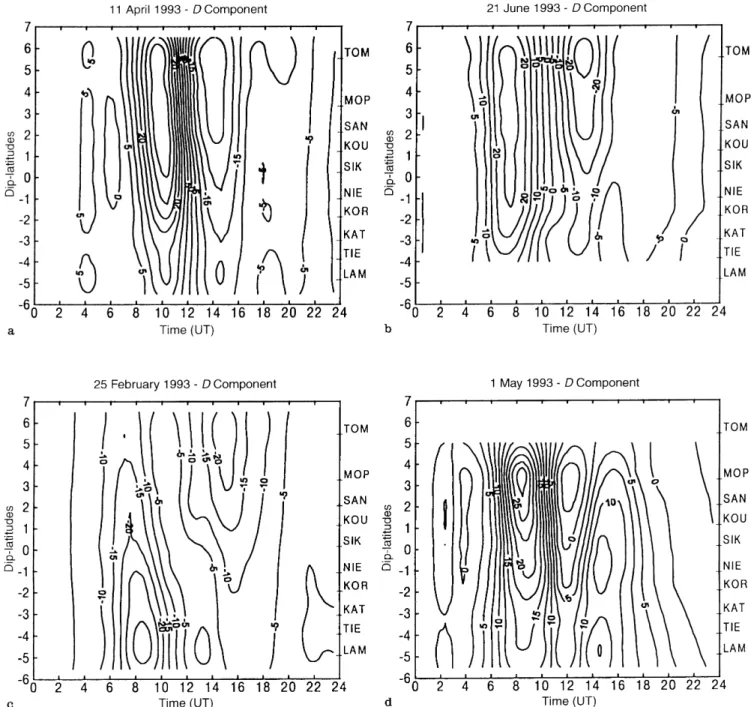
The diurnal variation of the D component (Fig. 7) displays a greater variability than those of H and Z. In the northernmost or southernmost stations (Tomb-ouctou, Mopti, and San to the north; Lamto, Tiebissou, and Katiola to the south), the variations of D are fairly regular. On the map of 11 April 1993 (Fig. 7a), one may notice that the D variation is positive in the northern hemisphere during the morning hours and negative during the afternoon. The same situation is observed on the map of 21 June 1993 (Fig. 7b). On the contrary, the contour map of 25 February 1993 (Fig. 7c) displays two negative zones during the morning as well as during the afternoon hours. Finally, the 1 May 1993 (Fig. 7d) contour map displays the opposite situation, with a
positive zone mostly centered on the northern stations in the morning, and another positive zone on the southern stations in the afternoon.
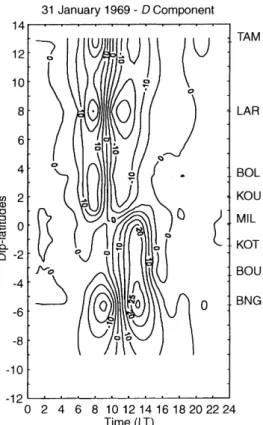
In Fig. 8 we have used the data recorded on 31 January 1969 during the Central African experiment (Fambitakoye and Mayaud, 1976a) to plot the contour map of the D component variations. The structural properties of the D diurnal variation are more clearly observed in this ®gure. Four distinct zones with opposite signs can be observed: a positive northern area and a negative southern area during the morning hours, a negative northern area and a positive southern area during the afternoon. This day is unusual, with a strong CEJ of about )40 nT followed by an EEJ of about 180 nT, as detected from the H component. However, amazingly, the resulting D contour map reveals the basic classical northern hemisphere D variation in the north, and the southern hemisphere D variation in the south. So the CEJ hardly makes any dierence: the D variation
Fig. 5. Hourly latitudinal pro®les of regular daily variation SRof horizontal east D, north H, and vertical Z geomagnetic ®eld com-ponents at the ten stations of the 5 °W pro®le in West Africa on 26 April 1993. Numbers 1±10 on the x-axis range from the northern-most to the southernnorthern-most stations, respectively
near the equator does not appear to change when a CEJ is present.
The limited extension in latitude of the IEEY pro®le does not allow the simultaneous observation of the same four zones that are observed in the 1969 data. None-theless, the four situations observed in Fig. 7 can be interpreted as follows: in Fig. 7a and b, the positive eect observed in the morning and the negative eect in the afternoon can be related to the two northern positive and negative zones with respect to the geomagnetic equator, as observed in Fig. 8. In Fig. 7c, the negative D variation observed in the morning can be identi®ed as the southern zone displayed in Fig. 8, while the negative area during the afternoon may be proposed to
corres-pond to the negative one, observed in the northern geomagnetic hemisphere during the afternoon in Fig. 8. Finally, a reversed situation is observed in Fig. 7d, assuming a southward displacement of the four areas observed in Fig. 8 during the morning hours and a northward displacement in the afternoon.
These contour maps show the strong variability of D variations associated with the EEJ involving, as sug-gested, day-to-day motions of the four structures observed in Fig. 8. Our data set suggests that the whole system of Fig. 8 is observed to move south of the geomagnetic equator during April and June. The situations observed in February and May require motions of the four structures such as displayed in
Fig. 6. Contour maps of the horizontal H and vertical Z components of the magnetic ®eld recorded at the stations of the pro®le, on 24 and 27 February 1993
Fig. 8 during daytime, southward in February and northward in May.
4.2 Current systems related to the observed SR,
of H, Z and D components
The morphological structures of H and Z observed diurnal variations, around noon, might be due to a current system ¯owing mainly eastward and along the magnetic equator, namely the equatorial electrojet. But such a current system should not produce magnetic eects in the east-west horizontal direction. The
ob-served diurnal variation of D is not negligible. One can wonder which current system is responsible for this variation. On a qualitative basis, the D variation can be produced by a meridional current system. According to the shape of the D contour maps (Fig. 7), it may be related to a meridional current ¯ow which converges to the geomagnetic equator in the morning (southward and northward, respectively, on the north and south sides of the geomagnetic equator) and diverges in the afternoon (northward and southward on the north and south sides of the geomagnetic equator). This structure seems to be related to the Sq current system. Thus, the contour maps of Fig. 7 might correspond to the eects of the Sq
Fig. 7a±d. Contour maps of the daily variation of the east component D of the magnetic ®eld: a and b example of days when a north eect is stronger all day long (11 April 1993 and 21 June 1993). c Example of a day when a south eect is stronger in the morning and a north eect
in the afternoon (25 February 1993). d A day when a north eect is stronger in the morning and a south eect is dominant in the afternoon (1 May 1993). See text for explanation
current vortex invasion from one hemisphere to another, as stated by Mayaud (1967). The observed D variation might also correspond to the existence of a most local ionospheric source as suggested by Vassal et al. (1998) and recently deduced from the study of the return current of the equatorial electrojet using the POGO data (Onwumechili, 1997).
5 The counter-electrojet
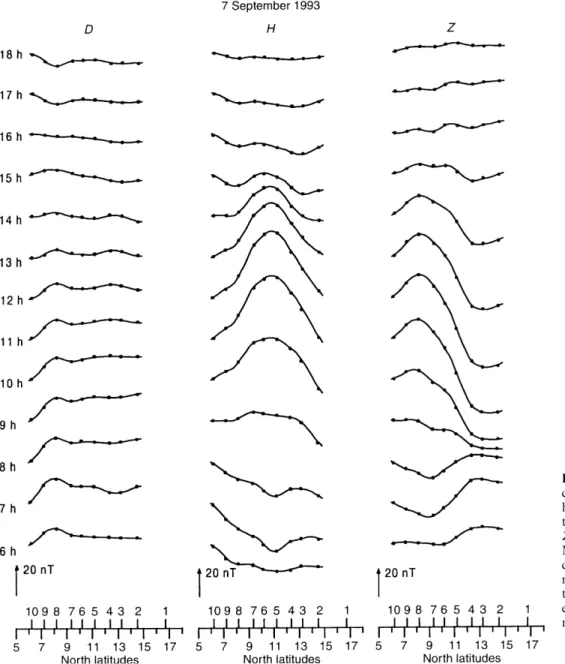
The H and Z pro®les are sometimes reversed during morning hours between 6 and 8 h (Fig. 9). Figure 10a displays the contour maps of the H and Z components during 7 September 1993. For the H component, two distinct areas are observed on the contour maps. The greatest, positive one represents the ®eld due to the EEJ. The other displays a negative ®eld between 6 and 8 h. For the contour maps of the Z component, two extrema are usually observed to be associated with the EEJ, one negative northward and one positive southward. On Fig. 10a, two additional zones are observed between 6 and 8 h, one positive northward and one negative southward. This is the obvious signature of a reversed current with respect to the EEJ, the counter-electrojet (CEJ). Fig. 10b displays an example of a CEJ occurring in the afternoon; Fig. 10c displays the magnetic eect of the CEJ as observed during both morning and afternoon hours. In a, b, and c of Fig. 10, the corresponding pattern of D component is also shown. These 3 days
display the same pattern without any inversion due to the CEJ, in contrast to H and Z components.
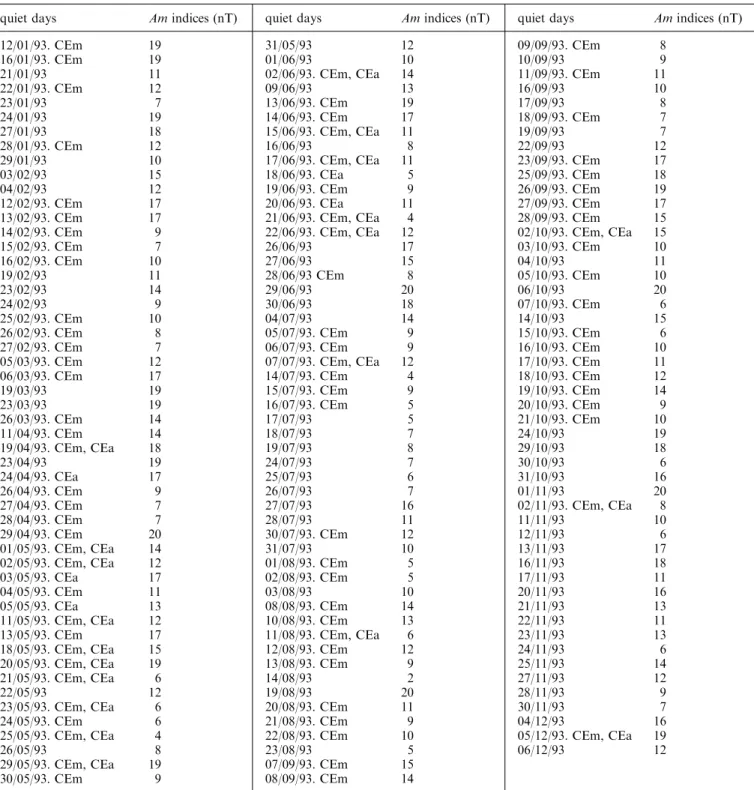
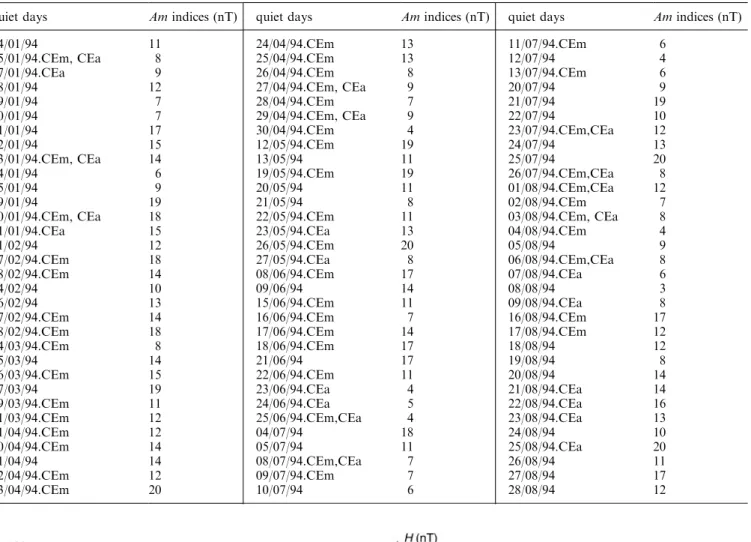
Tables 2 and 3 presents the days for which a CEJ is observed (CEm morning counter electrojet, CEa afternoon counter electrojet). The days with a CEJ are simply determined by visual inspection of the pro®les and contour maps of H and Z. In 1993, 154 quiet days were selected and 57% of these days present a CEJ. 41% present only a CEm, 3% present only a CEa. In 13% of the days, both morning and afternoon CEJs are observed. In 1994, between January and August, 96 days were quiet and 61% of these days display a CEJ, 35% of the days display only a CEm and 12% only a CEa. On 13% of these days, both CEm and CEa are observed.
The amplitudes of the EEJ are very weak when both a CEm and CEa are observed on the same days. Most of the CEJs observed in this study have weak amplitudes. The corresponding DH are about )10 to )15 nT. They are only observed in the morning and in the evening hours. Between 10 and 14 h, the H and Z variations correspond always to the eect of a normal EEJ.
During roughly 50% of the days, a CEJ is observed in the morning. This is comparable to the observations made by Fambitakoye and Mayaud (1976a) between 7 and 8 h during the Central African experiment.
The occurrence of the CEJ is very much related to the season. In order to describe this variation, we have presented in Fig. 11a the number of CEJ occurrences each month normalized to the total number of quiet days (Am < 20 nT) used in the month. Figure 11b displays the number of quiet days used each month for comparison. The two parts of Fig. 11 do not show any correlation, demonstrating that the seasonal variations of the number of CEJs observed is not due to the distribution of the quiet days along the experiment.
Figure 11a shows local maxima in April and Octo-ber, i.e., near the equinoxes, and local minima in July and December, i.e., near the solstices. The same extrema are observed over the ®rst 8 months of 1994. 65% of the CEJs observed during 1994 took place between May and June (the summer solstice).
6 Determination of the equatorial electrojet parameters Following Fambitakoye and Mayaud (1976a), the equatorial electrojet is considered as a current ribbon, ¯owing eastward along the geomagnetic equator, at an altitude h 105 km. These authors assumed a qua-dratic distribution of the electric current density in the EEJ, in order to obtain the best ®t to the SRlatitudinal
pro®les. Figure 12 shows the theoretical magnetic eect of such a current distribution. This current system will produce at its center a magnetic ®eld variation with a maximum and a zero of the H and the Z components, respectively. Furthermore, the Z component shows a maximum at the latitude of the southern edge of the ribbon, and a minimum at the latitude of the northern one. The parameters (width, position of the center,
Fig. 8. Contour map of the magnetic ®eld daily variation D obtained by Fambitakoye and Mayaud (1976a) from data recorded along a 17°E meridian pro®le in Central Africa on 31 January 1969
current intensity at the center) of such a ribbon can be completely determined using the latitudinal pro®les of the H and Z components, diurnal variations. The width is determined by the distance (2a) between the two extrema of the Z pro®le, the position of the center is estimated by the latitude of the horizontal SRmaximum
amplitude which also corresponds to the intersection between the latitudinal Z pro®le and the zero line. The maximum amplitude I0 of the ionospheric electric
current can be estimated from the amplitude DH of the horizontal component at the center, using the relationship:
DH 0:4 I0 arctg a=h:
In the following study, we will present some mean values, describe several characteristics of the time variability of these parameters, and compare them with previous experiments.
7 The yearly mean values and current densities
In this section, we compute the mean values of the parameters described in the preceding, along the whole duration of the experiment, separating 1993 and 1994. As in the other sections, only the quiet days are taken into account. The mean amplitude of DH at 12 h and the mean half-width a of the electrojet current allow the computation of the current density in the EEJ band, using the relationship of Sect. 6 at an altitude of h 105 km.
Over 1993, 34 quiet days were used. The obtained mean value of DH is 114 22 nT, while the mean half-width is 303 29 km, giving a current of 232 45 A/m.
Over the 1994 year, 29 quiet days were used. The obtained mean value of DH is 86 28 nT, while the mean half-width is 311 40 km, giving a current of 173 48 A/m.
Fig. 9. Example of morning counter-electrojet observed on hourly pro®les of the daily varia-tion of the magnetic ®eld D, H, and Z component on 7 September 1993. Notice that the pro®les of H and Z components are reversed in the morning (06 h to 08 h). Numbers 1 to 10 on the x-axis refer to north-ernmost to southnorth-ernmost stations, respectively
One must be careful when comparing the values obtained for the two periods, because of seasonal dierences in the measurements. These values will be compared and used to interpret the results of the other experiments, in particular the HF radar and interfer-ometer measurements.
8 The mean diurnal variability
The monthly averaged diurnal variability of the position of the center, the width, and the amplitude of DH associated with the EEJ is obtained by stacking diurnal hourly variations of each parameter over each of the months. The monthly mean diurnal variations are shown in Fig. 13a.
The position of the center is observed to stay roughly close to the geomagnetic equator (11° north) between 10 and 15 h, and to move southward in the afternoon during the ®rst 3 months of the year. From April to July, it is observed to remain at a constant latitude. During the other months of the year, the position of the EEJ center is observed to move northward during the afternoon hours. These tendencies are surprisingly observed less clearly during the ®rst 8 months of 1994.
The width of the current ribbon associated to the EEJ displays a less systematic variability. It is observed to remain between the values of 250 and 350 km most of the time.
The monthly averaged diurnal variations of the amplitude DH of the EEJ displays reasonably the same shape as the H component variation along a day at a given station. It can be seen that the maximum amplitude at noon displays a clear variability, being higher during the months near the equinoxes (March and April) and lower around the solstices (January and June 1993, June 1994). A steeper gradient is observed in DH in the morning compared to the evening, mainly during equinoxial months (see Fig. 13a, b).
9 The day-to-day variability
For each quiet day, we have computed the values obtained at 12 h of the three parameters in order to investigate the day-to-day variability. Figure 14 displays the values obtained along the whole experiment.
In Fig. 14a, one can see that the values of DH display a very important day-to-day variability. The whole values remain between 30 and 180 nT. Dierences between two consecutive quiet days are some times very strong. For example, the value of DH is 137 nT on 25 February 1993, while on 26 February 1993 it is 90 nT.
b
Fig. 10a±c. Example of morning counter-electrojet observed on contour maps of the daily variation of the magnetic ®eld H and Z components on 7 September 1993. The contour maps of D components are also shown. b Example this time of afternoon counter-electroject, for 20 June 1993. c For morning and afternoon counter-electroject, for 2 October 1993
This is equivalent to a decrease in DH of 47 nT between these consecutive days. The standard mean dierence is about 22 nT.
In Fig. 14b, the determination of the latitude of the EEJ center demonstrates that it is always close to the position of the geomagnetic equator, represented by the black line. The EEJ center remains between the latitudes 10.40°N (15 September 1993) and 11.828°N (12 August
1993). On the whole, the center is always found within an area 160 km wide.
The day-to-day variability of the half-width is very weak (Fig. 14c). For the two consecutive days of May 19 and 20, 1994, for example, the values of the half-width are 300 and 291 km, respectively. This corresponds to a dif-ference of 9 km. The variations of this parameter are ob-served between 250 and 350 km for the whole experiment.
Table 2. Daily means of the magnetic activity indices (Am) for selected days 1993. Counter-electrojet days are indicated by CEm for morning counter electrojet and CEa for afternoon counter-electrojet
quiet days Am indices (nT)
12/01/93. CEm 19 16/01/93. CEm 19 21/01/93 11 22/01/93. CEm 12 23/01/93 7 24/01/93 19 27/01/93 18 28/01/93. CEm 12 29/01/93 10 03/02/93 15 04/02/93 12 12/02/93. CEm 17 13/02/93. CEm 17 14/02/93. CEm 9 15/02/93. CEm 7 16/02/93. CEm 10 19/02/93 11 23/02/93 14 24/02/93 9 25/02/93. CEm 10 26/02/93. CEm 8 27/02/93. CEm 7 05/03/93. CEm 12 06/03/93. CEm 17 19/03/93 19 23/03/93 19 26/03/93. CEm 14 11/04/93. CEm 14 19/04/93. CEm, CEa 18 23/04/93 19 24/04/93. CEa 17 26/04/93. CEm 9 27/04/93. CEm 7 28/04/93. CEm 7 29/04/93. CEm 20 01/05/93. CEm, CEa 14 02/05/93. CEm, CEa 12 03/05/93. CEa 17 04/05/93. CEm 11 05/05/93. CEa 13 11/05/93. CEm, CEa 12 13/05/93. CEm 17 18/05/93. CEm, CEa 15 20/05/93. CEm, CEa 19 21/05/93. CEm, CEa 6 22/05/93 12 23/05/93. CEm, CEa 6 24/05/93. CEm 6 25/05/93. CEm, CEa 4 26/05/93 8 29/05/93. CEm, CEa 19 30/05/93. CEm 9
quiet days Am indices (nT)
31/05/93 12 01/06/93 10 02/06/93. CEm, CEa 14 09/06/93 13 13/06/93. CEm 19 14/06/93. CEm 17 15/06/93. CEm, CEa 11 16/06/93 8 17/06/93. CEm, CEa 11 18/06/93. CEa 5 19/06/93. CEm 9 20/06/93. CEa 11 21/06/93. CEm, CEa 4 22/06/93. CEm, CEa 12 26/06/93 17 27/06/93 15 28/06/93 CEm 8 29/06/93 20 30/06/93 18 04/07/93 14 05/07/93. CEm 9 06/07/93. CEm 9 07/07/93. CEm, CEa 12 14/07/93. CEm 4 15/07/93. CEm 9 16/07/93. CEm 5 17/07/93 5 18/07/93 7 19/07/93 8 24/07/93 7 25/07/93 6 26/07/93 7 27/07/93 16 28/07/93 11 30/07/93. CEm 12 31/07/93 10 01/08/93. CEm 5 02/08/93. CEm 5 03/08/93 10 08/08/93. CEm 14 10/08/93. CEm 13 11/08/93. CEm, CEa 6 12/08/93. CEm 12 13/08/93. CEm 9 14/08/93 2 19/08/93 20 20/08/93. CEm 11 21/08/93. CEm 9 22/08/93. CEm 10 23/08/93 5 07/09/93. CEm 15 08/09/93. CEm 14
quiet days Am indices (nT)
09/09/93. CEm 8 10/09/93 9 11/09/93. CEm 11 16/09/93 10 17/09/93 8 18/09/93. CEm 7 19/09/93 7 22/09/93 12 23/09/93. CEm 17 25/09/93. CEm 18 26/09/93. CEm 19 27/09/93. CEm 17 28/09/93. CEm 15 02/10/93. CEm, CEa 15 03/10/93. CEm 10 04/10/93 11 05/10/93. CEm 10 06/10/93 20 07/10/93. CEm 6 14/10/93 15 15/10/93. CEm 6 16/10/93. CEm 10 17/10/93. CEm 11 18/10/93. CEm 12 19/10/93. CEm 14 20/10/93. CEm 9 21/10/93. CEm 10 24/10/93 19 29/10/93 18 30/10/93 6 31/10/93 16 01/11/93 20 02/11/93. CEm, CEa 8 11/11/93 10 12/11/93 6 13/11/93 17 16/11/93 18 17/11/93 11 20/11/93 16 21/11/93 13 22/11/93 11 23/11/93 13 24/11/93 6 25/11/93 14 27/11/93 12 28/11/93 9 30/11/93 7 04/12/93 16 05/12/93. CEm, CEa 19 06/12/93 12
10 The seasonal variability
The seasonal variability of the parameters characterizing the EEJ at 12 h is obtained by computing the monthly means of DH at noon, of the electrojet center, and of the electrojet half-width. Figure 15 displays these monthly means with corresponding rms error-bars.
Table 3. Daily means of the magnetic activity indices (Am) for selected days in 1994. Counter-electrojet days are indicated by CEm for morning counter-electrojet and CEa for afternoon counter electrojet
quiet days Am indices (nT)
04/01/94 11 05/01/94.CEm, CEa 8 07/01/94.CEa 9 08/01/94 12 09/01/94 7 10/01/94 7 21/01/94 17 22/01/94 15 23/01/94.CEm, CEa 14 24/01/94 6 25/01/94 9 29/01/94 19 30/01/94.CEm, CEa 18 31/01/94.CEa 15 01/02/94 12 17/02/94.CEm 18 18/02/94.CEm 14 24/02/94 10 26/02/94 13 27/02/94.CEm 14 28/02/94.CEm 18 04/03/94.CEm 8 05/03/94 14 26/03/94.CEm 15 27/03/94 19 29/03/94.CEm 11 31/03/94.CEm 12 01/04/94.CEm 12 20/04/94.CEm 14 21/04/94 14 22/04/94.CEm 12 23/04/94.CEm 20
quiet days Am indices (nT)
24/04/94.CEm 13 25/04/94.CEm 13 26/04/94.CEm 8 27/04/94.CEm, CEa 9 28/04/94.CEm 7 29/04/94.CEm, CEa 9 30/04/94.CEm 4 12/05/94.CEm 19 13/05/94 11 19/05/94.CEm 19 20/05/94 11 21/05/94 8 22/05/94.CEm 11 23/05/94.CEa 13 26/05/94.CEm 20 27/05/94.CEa 8 08/06/94.CEm 17 09/06/94 14 15/06/94.CEm 11 16/06/94.CEm 7 17/06/94.CEm 14 18/06/94.CEm 17 21/06/94 17 22/06/94.CEm 11 23/06/94.CEa 4 24/06/94.CEa 5 25/06/94.CEm,CEa 4 04/07/94 18 05/07/94 11 08/07/94.CEm,CEa 7 09/07/94.CEm 7 10/07/94 6
quiet days Am indices (nT)
11/07/94.CEm 6 12/07/94 4 13/07/94.CEm 6 20/07/94 9 21/07/94 19 22/07/94 10 23/07/94.CEm,CEa 12 24/07/94 13 25/07/94 20 26/07/94.CEm,CEa 8 01/08/94.CEm,CEa 12 02/08/94.CEm 7 03/08/94.CEm, CEa 8 04/08/94.CEm 4 05/08/94 9 06/08/94.CEm,CEa 8 07/08/94.CEa 6 08/08/94 3 09/08/94.CEa 8 16/08/94.CEm 17 17/08/94.CEm 12 18/08/94 12 19/08/94 8 20/08/94 14 21/08/94.CEa 14 22/08/94.CEa 16 23/08/94.CEa 13 24/08/94 10 25/08/94.CEa 20 26/08/94 11 27/08/94 17 28/08/94 12
Fig. 11. a Seasonal variations of the numbers of CEJ occurrences observed each month. b Number of quiet days observed each month during the experiment
Fig. 12. Magnetic eect of a parabolic electric current (center C, width 2a and amplitude DH )
Fig. 13. a Diurnal variations of the electrojet parameter observed from the monthly means between January and June 1993: (A) latitude of the center, (B) half width, and (C) amplitude of DH. b As for a but now between July and December 1993
During 1993, DH (Fig. 15a) displays two maxima (120 nT and 100 nT) corresponding to the March and September equinoxes, and a minimum of 80 nT at the
summer solstice. Another minimum of 80 nT is ob-served in November, while a high value of 100 nT is observed during the 2 months (December 1993, January
1994) corresponding to the winter solstice. From March to June 1994, the amplitude of DH is observed to decrease regularly, following the solar cycle decrease.
The position of the center (Fig. 15b) is always closed to the geomagnetic equator computed at the epoch 1993.5. A slow but regular northward drift is observed between January 1993 and January 1994.
Figure 15c displays the electrojet half-width. This is maximum in February 1993 and 1994, and is 350 km. It is observed to decrease between February and June where a minimum is observed (250 km). It is then observed to stay around 300 km between July and December. These values compare well with the value of 330 km obtained by Fambitakoye and Mayaud (1976a) during the Central African experiment.
11 Conclusion
In this paper, we have provided a description of the EEJ phenomenon along the 5°W meridian in West Africa, derived from latitudinal ground-based magnetic mea-surements. We have thus determined the EEJ main parameters whose values are in agreement with those obtained during previous experiments of the same kind.
We have also studied time variations of these parameters and found that the amplitude DH, which is proportional to the integrated current density (I0), changes
continu-ously from dawn to dusk with a maximum at local noon. It also presents a very strong day-to-day and seasonal variability. DH is maximum in equinoxes and minimum in solstices. The EEJ center remains close to the dip-equator and does not vary much on a day-to-day and seasonal basis. The EEJ half-width presents very weak diurnal and day-to-day variability, but we found on a seasonal basis that it is maximum (350 km) in February both in 1993 and 1994, decreasing between February and June with a minimum of 250 km. It stays almost constant around 300 km from July to December.
Furthermore, very frequent counter-electrojet occur-rences have been found in the morning as well as in the afternoon. The CEJ occurrence frequency presents seasonal variability.
The observed east component D diurnal variation is not negligible and is fully independent of the occurrenc-es of the CEJ. According to its morphological shape, this variation could be related to the background planetary Sq current system. The D variation found in
Fig. 14a±c. Day-to-day variability of the EEJ parameters: a ampli-tude of the horizontal component DH, b the latiampli-tude of the center c,
and c the half-width a Fig. 15a±c. Seasonal variations of the EEJ parameters: a amplitude of the horizontal component DH, b the latitude of the center c, and c the half-width a, based on the monthly means, with corresponding rms error-bars
MAGSAT dusk data near the dip-equator was inter-preted by Maeda et al. (1982) as the eect of two meridional currents ¯owing in the meridian plane, northward in the northern hemisphere and southward in the southern hemisphere. This ®eld has the same latitudinal structure as the IEEY afternoon D variation, negative to the north and positive to the south. These two variations of D must not be attributed to the same origin, since the Magsat D variation, observed only on the satellite orbit at dusk, was not correlated with any surface measurements, while the IEEY D variation occurs from dawn to dusk. Further data recorded in middle- and other low-latitude stations beyond the EEJ area and satellite data will be necessary for accurate interpretation.
Any interpretation of the preceding EEJ features from only ground-based magnetic data would be too hasty now, because these data can only indicate an equivalent integrated current ¯ow. The actions of large-scale current systems, such as those related to the magnetospheric convection and to the ionospheric disturbed dynamo, through storm winds in the low thermosphere (Richmond and Matsuchita, 1975; Blanc and Richmond, 1980; Mazaudier, 1985; Mazaudier et al., 1985), have been pointed out in middle and low latitudes. Fambitakoye et al. (1990) have studied the magnetic eects of the ionospheric disturbed dynamo. Interactions between those current systems and the EEJ would be one of the causes of the EEJ day-to-day variability (Mayaud, 1982; Mazaudier, 1989). Neverthe-less, the mechanisms of these interactions are not yet established on an experimental basis. Such a study will require further analysis of all the data obtained by the dierent groups who collaborated in the African sector during IEEY.
Future work, using these and other results obtained during the IEEY in Africa as well as those obtained at other longitude sectors, will be useful for more accurate interpretation. This worldwide and pluridisciplinary eort is presumably the only way to enhance the comprehension of this ionospheric equatorial current as part of a global current system.
Acknowledgements. This study was supported by a grant from ORSTOM. The French participation in the IEEY experiment bene®ted from the ®nancial support of the French MinisteÁre d'Aide et de CoopeÂration through the OpeÂration CAMPUS `AnneÂe Internationale de l'Electrojet Equatorial ' between the Universities of Paris-Sud and Abidjan.
Topical Editor D. Alcayde thanks R. J. Stening and M. A. Abdu for their help in evaluating the paper.
References
Amory-Mazaudier, C., P. Vila, J. Achache, A. Achy SeÂka, Y. Albouy, E. Blanc, K. Boka, J. Bouvet, Y. Cohen, M. Dukhan, V. Doumouya, O. Fambitakoye, R. Gendrin, C. Goutelard, M. Hamoudi, R. Hanbaba, E. Hougninou, C. Huc, K. Kakou, A. Kobea-Toka, P. Lassudrie-Duchesne, E. Mbipom, M. Men-vielle, S. O. Ogunade, C. A. Onwumechili, J. O. Oyinloye, D. Rees, A. Richmond, E. Sambou, E. Schmuker, J. L. Tirefort, and J. Vassal, International equatorial electrojet year: the african sector, Rev. Bras. Geo®s., 11, 303±317, 1993.
Balsley, B. B., Electric ®eld in the equatorial ionosphere: a review of techniques and measurements, J. Atmos. Terr. Phys., 35, 1035±1044, 1973.
Blanc, M., and A. D. Richmond, The ionospheric disturbance dynamo, J. Geophys. Res., 85, 1669±1686, 1980.
Blanc, E., B. Mercandalli, and E. Houngninou, Kilometric irregu-larities in the E and F regions of the daytime equatorial ionosphere observed with a high-resolution HF radar, Geophys. Res. Lett., 23, 645±648, 1996.
Cain, J. C., and R. E. Sweeney, The POGO data, J. Atmos. Terr. Phys., 35, 1231±1247, 1973.
Chapman, S., The equatorial electrojet as detected from the abnormal electric current distribution above Huancayo, Peru, and elsewhere, Arch. Meteorol. Geophys. Bioklimatol., 44, 368± 390, 1951.
Cohen, Y., and J. Achache, New global vector anomaly maps derived from MAGSAT data, J. Geophys. Res., 95, 10783± 10800, 1990.
Fambitakoye, O., and P. N., Mayaud, The equatorial electrojet and regular daily variation SR: I A determination of the equatorial electrojet parameters, J. Atmos. Terr. Phys., 38, 1± 17, 1976a.
Fambitakoye, O., and P. N. Mayaud, The equatorial electrojet and regular daily variation SR: II The centre of the equatorial electrojet, J. Atmos. Terr. Phys., 38, 19±26, 1976b.
Fambitakoye, O., and P. N. Mayaud, The equatorial electrojet and regular daily variation SR: IV Special features in particular days, J. Atmos. Terr. Phys., 38, 123±134, 1976c.
Fambitakoye, O., P. N. Mayaud., and A. D. Richmond, The equatorial electrojet and regular daily variation SR: III Com-parison of observations with a physical model, J. Atmos. Terr. Phys., 38, 113±121, 1976.
Fambitakoye, O., M. Menvielle, and C. Mazaudier, Global distur-bance of the transient magnetic ®eld associated with thermos-pheric storm winds on March 23, 1979, J. Geophys. Res., 95, 209±218, 1990.
Forbes, J. M., The equatorial electrojet, Rev. Geophys., 19, 469± 504, 1981.
Forbush, S. E., and M. Casaverde, Equatorial electrojet in Peru, Pub. 620, pp. 1±37, Carnegie Inst., Washington, 1961. Hesse, D., An investigation of the equatorial electrojet by means of
ground-based magnetic measurements in Brazil, Ann. Geophys., 38, 315±320, 1982.
Langel, R. A.M., M. Purucker, and M. Rajaram, The equatorial electrojet and associated currents as seen in MAGSAT data, J. Atmos. Terr. Phys., 55, 1233±1269, 1993.
Maeda, H., T. Iyemori, T. Araki, and T. Kamei, New evidence of a meridional current system in the equatorial ionosphere, Geo-phys. Res. Lett., 9, 337±340, 1982.
Mayaud, P. N., CorreÂlation entre les variations journalieÁres du champ magneÂtique terrestre sous l'eÂlectrojet eÂquatorial et dans les reÂgions avoisinantes, Ann. Geophys., 23, 387±406, 1967. Mayaud, P. N., Comment on ``The ionospheric disturbances dynamo'' by M. Blanc and A. D. Richmond, J. Geophys. Res., 87, 6353±6355, 1982.
Maynard, N. C., Measurements of ionospheric currents o the coast of Peru, J. Geophys. Res., 72, 1863±1875, 1967.
Maynard, N. C., and J. L. Cahill Jr, Measurements of the equatorial electrojet over India, J. Geophys. Res., 70, 5923± 5836, 1965.
Mazaudier, C., Electric currents above Saint-Santin, 3 a prelimi-nary study of disturbances: June 6, 1978; March 22, 1979; March 23, 1979., J. Geophys. Res., 90, 1355±1366, 1985. Mazaudier, C., On the relationship between ionospheric phenomena
and the day-to-day variability of the Earth magnetic ®eld regular variation ``Sr'', Doc. de travail DT/CRPE/1177, Centre Na-tional d'Etudes des TeÂleÂcommunications, Issy-les-Moulineaux, France, 1989.
Mazaudier, C., R. Bernard, and S. V. Venkateswaran, Saint-Santin radar observations of lower thermospheric storms, J. Geophys. Res., 90, 2885±2895, 6685±6686, 1985.
Onwumechili, C. A., Spatial and temporal distributions of iono-spheric currents in subsolar elevations, J. Atmos. Solar-Terr. Phys., 59, 1891±1899, 1997.
Onwumechili, C. A., and C. E. Agu, General features of the magnetic ®eld of the equatorial electrojet measured by the POGO satellites, Planet. Space Sci., 28, 1125±1130, 1980. Onwumechili, C. A., and C. E. Agu, Longitudinal variation of the
equatorial electrojet parameters derived from POGO satellite observations, Planet. Space Sci., 29, 627±634, 1981a.
Onwumechili, C. A., and C. E. Agu, The relationship between the current and the width of the equatorial electrojet, J. Atmos. Terr. Phys., 43, 573±578, 1981b.
Onwumechili, C. A., and C. E. Agu, Regional variations of equatorial electrojet parameters, Ann. Geophys., 38, 307±313, 1982.
Rastogi, R. G., and K. N. Iyer, Quiet day variation of geomagnetic H-®eld at low latitudes, J. Geomagn. Geoelectr., 28, 461±479, 1976.
Richmond, A. D., Equatorial electrojet I. Development of a model including winds and instabilities, J. Atmos. Terr. Phys., 35, 1083±1103, 1973.
Richmond, A. D., and S. Matsuchita, Thermospheric response to a magnetic substorm, J. Geophys. Res., 80, 2839±2850, 1975. Sampath, S., and T. S. Sastry, Results from in situ measurements of
ionospheric currents in the equatorial region I, J. Geomagn. Geoelectr., 31, 373±379, 1979.
Sastry, J. S.G., Diurnal change in the parameters of the equatorial electrojet as observed by rocket-borne magnetometers, in Space Research X, Eds. T. M. Donahue, P. A. Smith, and L. Thomas, North-Holland, Amsterdam, pp. 778±785, 1970.
Stening, R. J., Modeling the equatorial electrojet, J. Geophys. Res., 90, 1705±1719, 1985.
Vassal, J., M. Menvielle, Y. Cohen, M. Dukhan, V. Doumouya, K. Boka, and O. Fambitakoye, A study of transient variations in the Earth's electromagnetic ®eld at Equatorial Electrojet latitudes in western Africa (Mali and the Ivory Coast), Ann. Geophysicae, this issue, 1998.