HAL Id: hal-00316963
https://hal.archives-ouvertes.fr/hal-00316963
Submitted on 1 Jan 2001
HAL is a multi-disciplinary open access
archive for the deposit and dissemination of
sci-entific research documents, whether they are
pub-lished or not. The documents may come from
teaching and research institutions in France or
abroad, or from public or private research centers.
L’archive ouverte pluridisciplinaire HAL, est
destinée au dépôt et à la diffusion de documents
scientifiques de niveau recherche, publiés ou non,
émanant des établissements d’enseignement et de
recherche français ou étrangers, des laboratoires
publics ou privés.
origin
S. Szita, A. N. Fazakerley, P. J. Carter, A. M. James, P. Trávnicek, G.
Watson, M. André, A. Eriksson, K. Torkar
To cite this version:
S. Szita, A. N. Fazakerley, P. J. Carter, A. M. James, P. Trávnicek, et al.. Cluster PEACE observations
of electrons of spacecraft origin. Annales Geophysicae, European Geosciences Union, 2001, 19 (10/12),
pp.1721-1730. �hal-00316963�
Annales Geophysicae (2001) 19: 1721–1730 c European Geophysical Society 2001
Annales
Geophysicae
Cluster PEACE observations of electrons of spacecraft origin
S. Szita1, A. N. Fazakerley1, P. J. Carter1, A. M. James1, P. Tr´avn´ıˇcek1,2, G. Watson1, M. Andr´e3, A. Eriksson3, and K. Torkar4
1Mullard Space Science Laboratory, University College London, Holmbury St Mary, Dorking, Surrey, RH5 6NT, UK 2Institute of Atmospheric Physics, Academy of Sciences of the Czech Republic
3Swedish Institute of Space Physics, Uppsala Division, Box 537, SE-75121 Uppsala, Sweden 4Space Research Institute, Austrian Academy of Sciences, Schmiedlstr. 6, 8042 Graz, Austria
Received: 11 April 2001 – Revised: 29 August 2001 – Accepted: 19 September 2001
Abstract. The two PEACE (Plasma Electron And Current
Experiment) sensors on board each Cluster spacecraft sam-ple the electron velocity distribution across the full 4π solid angle and the energy range 0.7 eV to 26 keV with a time res-olution of 4 s. We present high energy and angular resres-olution 3D observations of electrons of spacecraft origin in the var-ious environments encountered by the Cluster constellation, including a lunar eclipse interval where the spacecraft poten-tial was reduced but remained positive, and periods of AS-POC (Active Spacecraft POtential Control) operation which reduced the spacecraft potential. We demonstrate how the spacecraft potential may be found from a gradient change in the PEACE low energy spectrum, and show how the ob-served spacecraft electrons are confined by the spacecraft po-tential. We identify an intense component of the spacecraft electrons with energies equivalent to the spacecraft potential, the arrival direction of which is seen to change when ASPOC is switched on. Another spacecraft electron component, ob-served in the sunward direction, is reduced in the eclipse but unaffected by ASPOC, and we believe this component is pro-duced in the analyser by solar UV. We find that PEACE an-odes with a look direction along the spacecraft surfaces are more susceptible to spacecraft electron contamination than those which look perpendicular to the surface, which justifies the decision to mount PEACE with its field-of-view radially outward rather than tangentially.
Key words. Magnetosheric physics (general or
miscella-neous) Space plasma physics (spacecraft sheaths, wakes, charging)
1 Introduction
Measurements of the low energy plasma surrounding a spacecraft are complicated by the charging of the spacecraft surface. Several processes contribute to the production of a non-zero electrostatic potential on a sunlit spacecraft: there
Correspondence to: S. Szita (ss@mssl.ucl.ac.uk)
are currents due to the incident flux of ambient ions and elec-trons, and the outgoing flux of photoemitted, secondary and backscattered electrons. The spacecraft potential is reached when there is no net current, and it will vary as the contribu-tions of the various current sources change as the spacecraft moves along its orbit. In the magnetosphere or solar wind, the dominant processes are photoemission and the incident flux of ambient electrons. Here, a sunlit spacecraft will usu-ally charge positive due to the need to attract enough elec-trons from the ambient plasma to balance the constant pho-toemission current, and will usually become more positive in more tenuous plasma regions. The spacecraft potential is, therefore, seen to vary with the ambient electron density and temperature (e.g. Pedersen, 1995 and Escoubet et al., 1997). In the case of three Cluster spacecraft, an additional impor-tant factor is ASPOC (Riedler et al., 1997) which can provide active spacecraft potential control by emitting a beam of ions. The emitted ion current replaces some of the current other-wise supplied by the attraction of ambient electrons, altering the current balance in favour of a reduced positive spacecraft potential. When there is no active potential control, a poten-tial of a few volts positive is expected in the solar wind and magnetosheath; however, in the tail and lobe regions of the magnetosphere, potentials of tens of volts positive may be experienced (Scime, 1998). Schmidt et al. (1995) reported Geotail spacecraft potentials of up to +70 V in the magne-totail lobes, but the active spacecraft potential control ion emitter (similar to ASPOC on Cluster) was able to restrict the potential to a few volts, remaining reasonably stable to ambient plasma variations. Zhao et al. (1996) note, however, that the reduction in spacecraft potential by the increase of ion emitter current is limited by the associated growth of the potential barrier around the spacecraft.
Unless the spacecraft potential is zero, the velocity distri-bution of ambient electrons which reach the detectors will be modified as the electrons are accelerated near the spacecraft, i.e. the measured velocity distribution is not the same as the unaccelerated plasma electron velocity distribution which exists outside the region affected by the spacecraft potential.
Since the Cluster spacecraft will generally be charged pos-itive, electrons will be attracted to them. Scime (1998, and references therein) notes that in addition to gaining kinetic energy due to their acceleration by the spacecraft potential, the electron trajectories will be changed. As a consequence, at low energies (of the same order as the spacecraft poten-tial) electrons are accelerated from a wide field-of-view into a narrower one at the detector. Detectors which have a field-of-view tangential to the spacecraft surface are least likely to receive low energy ambient plasma electrons and may de-tect electrons released from the spacecraft surface instead. This leads to the electron density being overestimated and other directional moments being modified. This means that the instrument’s geometric factor is dependent both on the measured electron energy and the environment in which it is measured, i.e. it is affected by the spacecraft potential, which is determined by incident solar UV and the ambient plasma density and temperature. The modification of elec-tron trajectories by spacecraft charging may be manifested in observations of apparent non-gyrotropy where gyrotropy would be expected. This discrepancy is reported by Scime et al. (1994) for solar wind observations by the electron spec-trometer on Ulysses. Using a model of the spacecraft po-tential, they were able to recalculate the electron trajectories which yielded more gyrotropic distributions. The electron density was found to be equal to the ion density following the correction, whereas before it had been 60% greater. In contrast, “scalar” corrections, which only take into account the increase in particle energy attributed to the spacecraft potential, would not properly correct the gyrotropy or the moments. It is further noted that plasma gradients are eas-ily misinterpreted where the electron trajectories have been modified by the spacecraft potential: the example is given by Scime et al. (1994) of a satellite moving into a region of increased plasma density at constant temperature. Since the spacecraft potential decreases, so do the associated effects on the observed particles and the overestimation of density is therefore reduced. The real density increase may then be observed as a smaller increase or even as a decrease.
Modelling of the spacecraft sheath may use a thick sheath approximation where the Debye length of the ambi-ent plasma is long compared to the spacecraft radius, or a thin sheath model where the Debye length is short compared to the spacecraft radius (e.g. Garrett, 1985). The thin sheath approximation is applied by Comfort et al. (1982) to ISEE 1 low energy ion measurements in the plasmasphere: it is noted that for the restricted aperture acceptance in that case, the in-strument characteristics are independent of Debye length and therefore, the details of the sheath structure are not important. The potential drop responsible for the plasma acceleration was, therefore, said to occur in an infinitely thin sheath. The method relates the assumed Maxwellian plasma outside the spacecraft sheath to the detected plasma for which the accep-tance angles and any associated energy dependency are de-fined by the detector. The authors state that reliable ion tem-peratures and densities could thus be obtained for positive spacecraft potentials. Sojka et al. (1984) investigated why the
boom-mounted proton detector on board the geosynchronous satellite GEOS 2, positioned antiparallel to the spacecraft spin axis in order to reduce spin modulation of the observed proton flux, saw a strong spin modulation of low energy ions. A NASCAP (NASA Charging Analyzer Program) model of the satellite sheath potential showed that the structure of the proton retarding spacecraft sheath was asymmetric about the spin axis, which meant that the magnetic field vector could pass through very different sheath potential conditions in the course of a spin. Field-aligned cold protons were, therefore, retarded during half of the spin. Scime et al. (1994) produced a NASCAP model for Ulysses which showed that the magne-tometer boom distorted the equipotential surfaces around the spacecraft within the field-of-view. These examples point to the inadequacy of simple spherical models of the spacecraft potential for satellites, such as Cluster, which have booms which may distort the satellite sheath potential.
2 The PEACE instrument
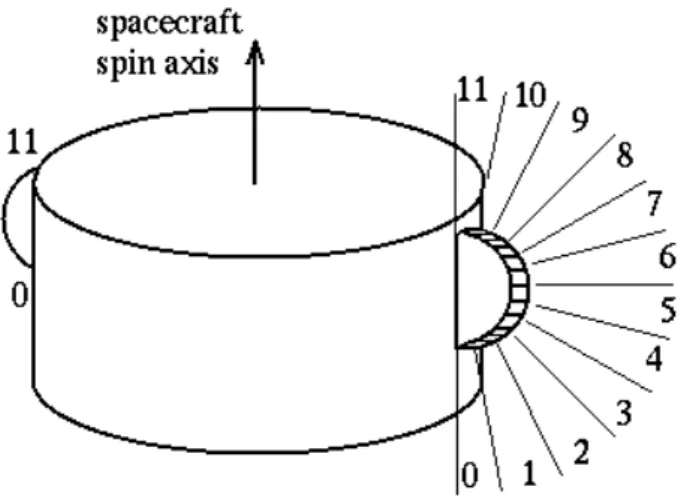
PEACE is designed to make detailed observations of Clus-ter’s low energy electron environment. PEACE has two sen-sors, a Low Energy Electron Analyser (LEEA) and a High Energy Electron Analyser (HEEA), which are positioned on opposite sides of the spacecraft with radial fields-of-view. Each instrument has a field-of-view of 180◦in the polar di-rection, consisting of twelve 15◦zones, while the azimuthal coverage is provided by the spin of the satellite. The instru-ment energy range is 0.7 eV to 26 keV and the energy steps are linearly spaced in the range of 0–10 eV, then logarithmic above 10 eV. Each sensor is capable of operating anywhere across the whole energy range, but in standard mode LEEA covers 0.7 eV to 1 keV and HEEA 30 eV to 26 keV. There-fore, although the complete 3D distribution for the PEACE energy range is observed once every 4 s spin, this is achieved every 2 s where the energy ranges of the sensors overlap. Each PEACE sensor has three modes for scanning the en-ergy range, permitting different combinations of enen-ergy and azimuthal resolution. LAR mode (low angular resolution) provides the highest energy resolution, returning 60 energy bins at one energy step per bin, with an azimuthal resolution 22.5◦. MAR mode (medium angular resolution) returns 30 energy bins at two energy steps per bin, with an azimuthal of resolution of 11.25◦. HAR mode (High Angular Resolution)
returns 15 energy bins at two energy steps per bin and, there-fore, has a smaller energy range than LAR or MAR, with an azimuthal resolution of 5.625◦. LEEA and HEEA may be operated in different modes but they typically use the same mode, usually MAR. PEACE is described further in John-stone et al. (1997).
The spacecraft electrons seen by PEACE include secon-daries and photoelectrons from the exterior surfaces of the spacecraft and PEACE analysers, and those produced inside the analyser heads. The internal component may consist of secondaries caused by the impact of energetic ambient elec-trons near the aperture, and photoelecelec-trons produced by solar
S. Szita et al.: Cluster PEACE observations of electrons of spacecraft origin 1723
Fig. 1. PEACE anode numbers (equal to polar zone numbers). The spacecraft spin axis points a few degrees sunward of GSE south. There is a larger spacecraft surface in front of the field-of-view of anode 0 than of anode 11.
UV at the part of the spin phase when sunlight can enter the collimator. The PEACE design incorporates a baffle in the input collimator and an absorbent, diffusely reflecting coat-ing on all internal surfaces to minimise both effects (Alsop et al., 1998). PEACE underwent pre-flight testing for both secondaries and photoelectrons. Tests using a primary elec-tron beam with various energies between 30 eV and 10 keV produced a secondary electron spectrum peaked at a few eV, with an increased beam energy producing more secondary counts with a similar spectrum, e.g. for a 1 keV beam, the secondaries reached up to 1% of the incident electron count rate. Pre-flight UV tests showed that although photoelec-trons are produced again with a spectrum peaked at a few eV, counts due directly to UV photons reaching the detec-tor were very low and primarily seen in HEEA since it has a larger aperture than LEEA.
To avoid differential charging, the external surface of each Cluster spacecraft, including the solar panels, has a con-ductive coating, and all thermal blankets and other external components are grounded to the spacecraft (Credland et al., 1997). The only exception close to a PEACE detector is the star mapper which has an exposed insulating surface. In ad-dition, the decision was made to mount PEACE with a ra-dial field-of-view (Johnstone et al., 1997; also see Fig. 1). This aims to minimize the effects of the spacecraft potential on the measured electron distribution to which a tangentially mounted detector (with its field-of-view parallel to the sur-face) would be much more susceptible.
The nzero spacecraft potential adversely affects on-board moment calculations, both by increasing the electron count and by the acceleration of the natural plasma through the spacecraft potential, thus effectively modifying the en-ergies and trajectories of the observed natural electrons, i.e. modification of the electron velocity distribution. PEACE moments supplied by the CSDS (Cluster Science Data Sys-tem) are based on moment sums which are calculated on
board the spacecraft. The onboard calculations are designed to exclude electrons below 10 eV in an attempt to discard the spacecraft electrons. It was originally expected that ASPOC would be used to hold the spacecraft potential below 10 V whenever necessary, thus always excluding spacecraft elec-trons from the moment integrations. The lowest energy am-bient electrons would also be excluded, but these are most af-fected by the spacecraft potential and show the largest devia-tion from the true ambient electrons. However, since in prac-tice ASPOC operates only for limited time intervals, and not at all on spacecraft 1, a significant flux of photoelectrons is sometimes included in the moment integration energy band. Specifically, in lower density magnetospheric regions, such as the lobes, the spacecraft potential exceeds 10 V and we see spacecraft electrons at energies above 10 eV, whereas in the higher density regions, such as magnetosheath, the po-tential will generally fall well below 10 V. For these reasons, we currently supply the CSDS with moments calculated from HEEA only, i.e. above 30 eV. Guidance is given in the CSDS caveats. Full 3D distributions are usually transmitted by PEACE routinely, albeit at a very low rate except when there is burst mode telemetry. These can be used to calculate mo-ments on the ground for any part of the energy range, and in principle, corrections for the effects of the spacecraft poten-tial on the electron distribution could be attempted.
Several PEACE data products are referred to in this pa-per. 3DF distributions are 3D distributions transmitted at full measured resolution, the details of which depend on the anal-yser mode. These may be reduced on board to form 3DR distributions (15 energy bins, 6 polar zones and 16 azimuthal sectors) or 3DX distributions which can cover part or all of the 3DF energy range and also provide half the measured en-ergy or polar resolution as required. The LER (Low Enen-ergy Reduced resolution) data product was designed to provide full energy resolution data for the linear part of the energy range, though with restricted azimuthal resolution, and it is suitable for determining the spacecraft potential when it is below 10 V. This small product can generally be transmitted every spin. PAD (Pitch Angle Distribution) is a 2D subset of the full 3D distribution which is derived on board with knowledge of the magnetic field. The polar zone and az-imuthal sector into which the magnetic field direction falls is determined on board from the previous spin using data from FGM (Flux Gate Magnetometer; Balogh et al., 1997). Data are then selected from the azimuth sector containing the magnetic field direction for both HEEA and LEEA, and from sufficient polar zones on HEEA and LEEA combined to cover the 180◦from −B to +B every half spin. Figure 1 identifies the PEACE anode numbers which correspond to the polar zones. PAD was designed to be transmitted every spin so PAD spectrograms have very good time resolution. 3D data products may only be available once every several spins, with frequency depending on the telemetry mode. All spectrograms shown here have been produced using SDDAS (Southwest Data Display and Analysis System).
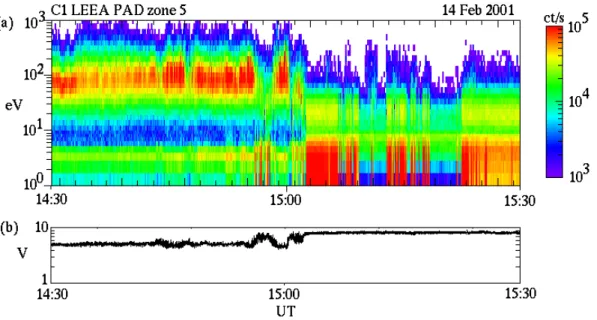
Fig. 2. Spacecraft 1 data from 14 February 2001 showing an outward bow shock crossing (a) PEACE LEEA data (b) EFW data showing spacecraft potential.
Fig. 3. Spacecraft 1 data from 16 January 2001 showing spacecraft electrons in a low density environment (a) PEACE LEEA data (b) EFW data showing spacecraft potential.
3 Spacecraft electrons observed along the Cluster orbit
Figures 2 and 3 each show one hour of data from a single LEEA anode on spacecraft 1, on which ASPOC does not op-erate. Note that the figures in this paper do not use scientific units for flux or phase space density since only preliminary calibration factors are available for the plotting software. In addition, below 10 eV, the sweep energy level calibrations for each sensor were not applied to the plots: the plotting
package instead applies the design specification sweep en-ergy level table, from which each PEACE sensor exhibits small differences. Improved calibration information for use in the plotting software is in preparation.
Figure 2 shows a spacecraft 1 transition from the mag-netosheath to the solar wind on 14 February 2001. Fig-ure 2a shows an energy-time spectrogram of the PEACE LEEA count rate data from the PAD data product for an-ode 5, which observes close to the spin plane and radially
S. Szita et al.: Cluster PEACE observations of electrons of spacecraft origin 1725
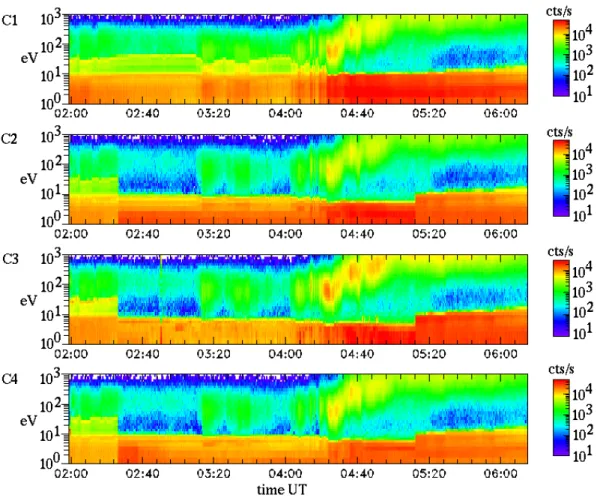
Fig. 4. Four spacecraft LEEA PAD zone 11 data from 02:00–06:15 on 07 February 2001 showing the effect of ASPOC working on space-craft 2, 3 and 4 between 02:27 and 05:13.
outward from the spacecraft surface. Magnetosheath trons are seen at around 100 eV and, later, solar wind elec-trons are seen at around 20 eV. Fluctuations in intensity, seen primarily after 14:55 UT, are due to the magnetic field vec-tor moving between sunward and anti-sunward pointing di-rections, so that the PEACE azimuth sector selected in the production of the spin resolution PAD data also alternates between sunward and anti-sunward directions. The most in-tense (red) sections of spacecraft electrons after 15:00 UT are in the sunward looking direction, interspersed with anti-sunward looking bins; the solar wind is naturally also more intense in the sunward looking bins. The spacecraft elec-tron population peaks at a few eV, as for the internally gener-ated photoelectrons and secondaries observed during ground testing. Figure 2b shows the corresponding spacecraft po-tential determined by EFW (Electric Field and Wave exper-iment, Gustaffson et al., 1997). EFW makes fast measure-ments of electric field and spacecraft potential fluctuations, using four probes on ∼ 50 m long booms which sit at the ambient plasma potential rather than the spacecraft poten-tial. The electrons seen below the spacecraft potential must be of spacecraft origin since the ambient plasma electrons will have been accelerated by the spacecraft potential before detection. Comparing Figs. 2a and 2b shows how the
space-craft electron part of the energy spectrum is confined by the potential which varies between 5 V and 9 V. The spacecraft potential is lower where the natural plasma density is higher, as expected.
Figure 3a also shows LEEA PAD zone 5 count rate data, from 16 January 2001. Cluster was inside the northern mag-netosphere, heading north about two hours after perigee and six hours prior to crossing the magnetopause, in a region of low plasma density, and the spectrogram is dominated by spacecraft electrons. The EFW spacecraft potential for this period is shown in Fig. 3b and is between 10 V and 40 V, which is higher in this low density region than for the solar wind and magnetosheath example shown in Fig. 2. The vari-ations are apparantly not due to electrons in the PEACE en-ergy range, but may be due to a varying flux of higher enen-ergy electrons or ions. The most intense count rate values are seen in a single energy bin at or near the top edge of the spacecraft electron spectrum. This is a commonly seen feature, and is often strongest in the middle (spin plane) anodes. The energy of this feature closely correlates with the spacecraft potential determined by EFW. We intend to investigate the hypothesis that these are electrons emitted by the EFW probes and then accelerated by the spacecraft potential before being detected by the PEACE analysers.
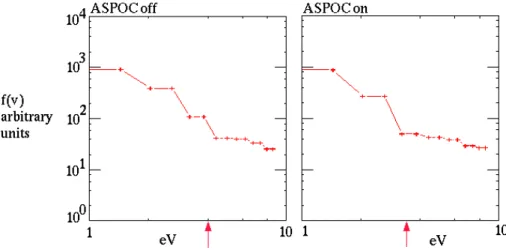
Fig. 5. Energy spectrum showing the spacecraft potential as a change of gradient, before and after ASPOC is switched on, 17 January 2001. The arrow marks the EFW spacecraft potential in each case.
4 Effect of ASPOC
Figure 4 shows LEEA PAD count rate data from anode 11 (looking along the spacecraft axis), taken on 07 February 2001 as the spacecraft moved outward from the magneto-sphere through a high energy electron population prior to crossing the magnetopause at 06:30 UT. ASPOC was operat-ing on Cluster 2, 3 and 4 between 02:27 and 05:13 UT, duroperat-ing which time the potential of these spacecraft was reduced by the emission of the ASPOC ion beam. Spacecraft 1, on which ASPOC was not operating, had a potential of up to 40 V at times. With ASPOC operating, the potential of spacecraft 2, 3 and 4 was held at about 10 V, and so any spacecraft elec-trons with higher energies, as seen on spacecraft 1, could escape the reduced potential, so the spacecraft electrons oc-cupy less of the measured energy spectrum. Between 03:12 and 04:24 UT, there were several intervals of increased flux in the energy range of 10–200 eV. Except on spacecraft 1, these are well separated from the spacecraft electrons. The measured arrival energies of these natural plasma electrons should be closer to their true values with ASPOC operating.
In this respect, ASPOC is of obvious benefit to PEACE. However, it is noted that ASPOC also seems to affect the EFW determination of the natural electric field around the satellite, particularly in low density environments. Further investigation is required to establish whether PEACE ob-serves any associated modification to the electron distribu-tion in low density regions. The spacecraft potential may be estimated by looking at the electron energy spectrum. Fig-ure 5 shows the energy spectrum before and after ASPOC is switched on in the solar wind on spacecraft 3, at 15:10 UT on 17 January 2001. The plot was generated using the LER data product. The spacecraft potential was relatively low for the solar wind, and the solar wind density was relatively high at this time. We expect to see a change in the spectrum gradi-ent between differgradi-ent electrons populations, in this case, the spacecraft electrons and the solar wind core population. The arrows show the EFW measured potential: 4 V before
AS-POC switches on, 3.2 V afterwards. These values agree well with the gradient changes in the energy spectra, showing that the LER product gives a useful indication of spacecraft po-tential in this case. Note though that in Fig. 4, there is a gradi-ent change near 10 eV (e.g. 02:00–04:00 UT on spacecraft 1) which, in this case, is well below the spacecraft potential, so care is needed in interpreting such gradient changes, some of which relate to an intrinsic spacecraft electron spectrum.
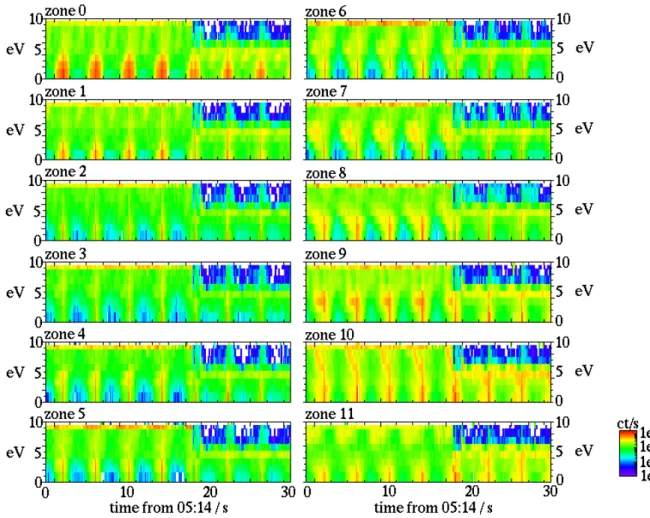
Figure 6 shows 30 s of full resolution 3DX data taken from spacecraft 2 on 14 January 2001. These data are from LEEA in MAR mode and there is one plot for each of the twelve anodes. The Cluster spacecraft were in the northern mag-netosphere, heading north in a low density region inside the magnetopause, so virtually all of the electrons at these ener-gies are spacecraft electrons. ASPOC switched on at about 05:14:18 UT and the reduction of the potential can be seen in the spacecraft electrons. The spectrum includes an enhance-ment at the top energy of the spacecraft electrons, as was seen in Fig. 3, which may be due to EFW probe electrons at ∼ 9 eV before ASPOC is switched on and at ∼ 5 eV after-wards. This feature is strongest in anode 5 (looking close to the spin plane) before ASPOC is switched on, but strongest in anode 10 (looking near the spin axis direction) afterwards. This may indicate a change in the structure of the spacecraft electrostatic field when ASPOC switches on, thus altering the distortion of the low energy electron trajectories, and may re-late to the EFW problem of measuring the ambient electric field when ASPOC is switched on.
There is an obvious asymmetry in that there are signifi-cantly more low energy (up to 5 eV) spacecraft electrons on the sunward side of the spin. The Sun direction is seen close to 05:14:02, 05:14:06, 05:14:10 UT (and every 4 s there-after) and an enhanced electron flux is seen at these times both before and after ASPOC is switched on. There are also more low energy electrons in the end anodes than spin plane electrons, with zone 0, which overlooks a larger surface than zone 11 (Fig. 1), containing the majority. The fact that the end anodes see more spacecraft electrons justifies the
deci-S. Szita et al.: Cluster PEACE observations of electrons of spacecraft origin 1727
Fig. 6. High resolution 3DX PEACE data showing the effect of ASPOC being switched on, one panel for each anode.
sion to use a radial rather than tangential field-of-view in the design of PEACE. The sunward component extends to 10 eV but is strongest below 5 eV. This component is sharply de-fined in azimuth and is thought to comprise electrons pro-duced in the analyser head by incident solar UV photons at times when sunlight can enter the collimator. The count rate observed for this component is reduced at higher energies, as expected for a photoelectron distribution. If it was produced directly by solar UV photons reaching the detector, then the signal would probably be seen with equal strength at all en-ergies.
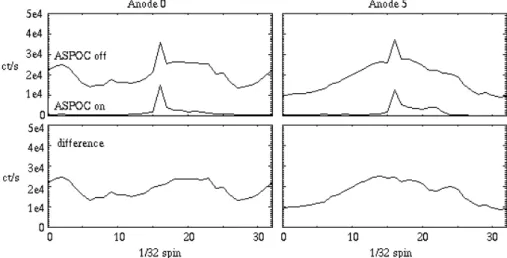
Figure 7 shows a superposition of data from one energy bin for 50 spins of data before and after the ASPOC switch-on shown in Fig. 6. The energy band of the bin is 8–9 eV which falls within the spacecraft electron energy range when ASPOC is off but above it when ASPOC is switched on. We are in effect comparing a situation with spacecraft electrons (ASPOC off) to one where they are removed (ASPOC on), by the lowering of the spacecraft potential. Anodes 0 and 5 are shown since these look along the spin axis (and, there-fore, along the spacecraft surface) and perpendicular to the spin axis, respectively. Anode 5 exhibits a simple variation in spacecraft electron flux with spin phase, i.e. greatest in the sunward direction, falling to a minimum in the anti-sunward
direction. We note that anode 0, which looks along the space-craft surface, sees a different spphase characteristic, in-cluding an interesting flux peak on the anti-sunward side. In fact, before ASPOC switches on, Fig. 6 showed that there is a complex variation in spacecraft electron flux between 5 and 10 eV, and between the anodes. When ASPOC is switched on, a reduction is seen in the spacecraft electrons for both look directions, but the component produced by UV entering the analyser is unchanged by the shift in spacecraft potential, which supports the idea that these electrons are produced in-side the analyser.
5 PEACE in eclipse
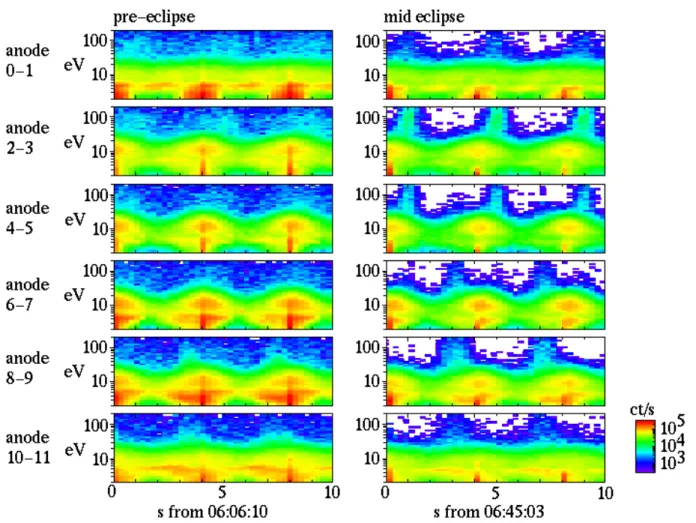
During an eclipse, a spacecraft’s potential is altered by the reduction of emitted photoelectron current. Cluster experi-enced a partial lunar eclipse on 25 January 2001 while in the solar wind. PEACE was operating in eclipse mode, which uses an internal clock rather than the spacecraft’s Sun sen-sor to time events, thus observations may not be perfectly spsynchronised. 3DX data from spacecraft 1 for 10 s in-tervals just before (left-hand column) and midway through (right-hand column) the eclipse are shown in Fig. 8. This is 3DX data taken in LAR mode with reduced resolution in
Fig. 7. Superposed data collected at 8–9 eV both before and after ASPOC switched on as shown in Fig. 6: anode 0 (look direction along spin axis) on the left, anode 5 (look direction in spin plane) on the right. Top panel shows ASPOC off (upper line) and ASPOC on (lower line) data, lower panel shows the difference between the two.
the polar direction, hence data from anode pairs are shown. Energy and azimuth data are at full resolution, which gives the best possible energy resolution but an azimuthal resolu-tion of 1/16 spin (half that of the MAR mode plot in Fig. 6). The Sun direction is seen as an enhancement in the electron count rate in a narrow azimuth range close to 0, 4, 8 s on each plot. In the pre-eclipse plots, we identify the solar wind core centred at a measured energy of 8–11 eV in anodes 2–9. There is also a directional component, probably strahl, at a higher energy (30–200 eV), which is most obvious in anodes 8–9. Spacecraft electrons are observed at ∼ 6 eV and below before the eclipse: the solar wind electrons will have been accelerated by the spacecraft potential which was approxi-mately 6 V. The spacecraft potential was reduced to ∼ 4 V in deepest shadow. In the mid-eclipse plots, both the solar wind core and the spacecraft electrons are seen at lower energies than before, consistent with the reduced spacecraft potential. The higher energy directional component has become much more clearly defined than before the eclipse and is seen in all anodes. In comparing pre-eclipse with mid-eclipse, it is noted that a reduction in count rate is seen across the whole energy range shown, up to 200 eV. The explanation for this is unclear but one possibility is that it may indicate the extent of the tail of the photoelectron distribution.
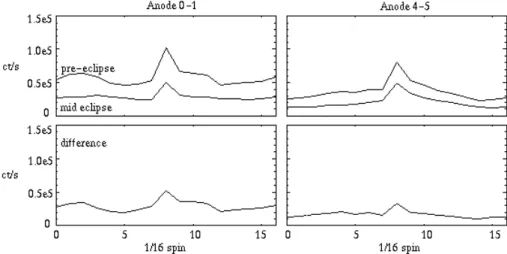
Since the spacecraft were never in total shadow, the flux of photoelectrons produced by solar UV was reduced but persisted throughout the event to different degrees on each spacecraft. This is further illustrated by Fig. 9 which is of the same form as Fig. 7, but since this figure is made from reduced resolution data, pairs of anodes are used rather than single ones. The azimuthal resolution is different from Fig. 7 because the sensor was in a different sweep mode. Figure 9 shows the result for an energy of ∼ 6 eV, which lies at the upper limit of spacecraft electron energies pre-eclipse, but in the minimum between the spacecraft electron and solar wind electron energies at mid-eclipse. More spacecraft electrons
are observed by the anodes with a field-of-view along the surface than by the anodes viewing radially, both before and during the eclipse. In contrast to the ASPOC case shown in Fig. 6, both the spacecraft electrons at all azimuths and the component which peaks in the Sun look direction are reduced during the eclipse. This is consistent with our interpretation of the sunward peak, i.e. these electrons are produced by UV inside the analyser head.
6 Concluding remarks
An understanding of the spacecraft electrons and spacecraft potential is crucial to the meaningful interpretation of low en-ergy electron data. High resolution PEACE data reveals the complex structure of the photoelectron population and sec-ondary electrons from the surface, and the variability of the spacecraft electrons in response to variations in the space-craft potential caused by changes in the plasma environment. We have demonstrated how the part of the energy spectrum occupied by spacecraft electrons is defined by the spacecraft potential, and have shown the effectiveness of ASPOC in controlling the spacecraft potential.
We have shown that there is a component of the photo-electrons which is produced inside the analyser by sunlight entering the aperture: this internally generated component is not affected by ASPOC, but was reduced when the satellites were in a partial eclipse and the solar UV intensity declined. When the spacecraft potential is low, this component can be present at energies above the spacecraft potential.
We have discussed the possible distortion of the low en-ergy electron velocity distribution by a non-zero spacecraft potential. Looking at the velocity distribution perpendicular to the magnetic field will show the extent of non-gyrotropy in the low energy electrons. It is planned to compare the dis-tributions for PEACE look directions, both along the space-craft surface and radially outward: most of the contamination
S. Szita et al.: Cluster PEACE observations of electrons of spacecraft origin 1729
Fig. 8. High resolution 3DX PEACE data showing the structure of the spacecraft electron population in the solar wind before the eclipse (left-hand column) and at mid-eclipse (right-hand column) for each anode pair.
by spacecraft electrons is seen in the PEACE anodes with a field-of-view along the spacecraft surface, and so most of the distortion of the velocity distribution would be expected in these end anode observations. This confirms the value of a radial field-of-view. It is also planned to see what effect AS-POC has on the low energy electron velocity distribution in this respect.
If no EFW spacecraft potential data are available, then the spacecraft potential can, at times, be estimated from the gra-dient change in the energy spectrum in the LER data product (if below 10 eV, otherwise other PEACE data products could be used). It might also be taken from observations of the electron component which is sometimes seen at the energy corresponding to the spacecraft potential (Fig. 3a) and which we have suggested may comprise of electrons emitted from the EFW probes.
The need to correct the electron data for the effects of the spacecraft potential, not only for the energy shift due to the acceleration of the electrons by the potential, but also for the deviations in their trajectories, has been discussed. This will involve the use of a model, such as NASCAP, to evaluate the likely form of the spacecraft potential and its effects on the low energy electrons, taking into account boom struc-tures. Such modelling should facilitate the reconstruction of
the electron velocity distributions prior to their acceleration by the spacecraft potential. Our observations of the electrons seen at an energy defined by the spacecraft potential, whose origin has been tentatively attributed to the EFW probes, and whose arrival direction was seen to vary with charging con-ditions (ASPOC on and off), may prove useful for the in-vestigation of the spacecraft potential structure and for the validation of NASCAP models.
Given the contamination of onboard moments by space-craft electrons, the calculation of new moments from trans-mitted 3D electron distributions may improve the accuracy compared to onboard calculations, but generally at the ex-pense of time resolution, since 3D data is not usually avail-able at spin rate. This process should include discounting the electrons produced in the analyser by solar UV, then cor-recting the energy and trajectory information in the electron distribution using a spacecraft potential model. We note the benefit of ASPOC in the reduction and control of the space-craft potential, but it is important to remember that ASPOC operates only for limited time intervals on spacecraft 2, 3 and 4, and is not operating on spacecraft 1.
The initial results from PEACE showed that density es-timation by the onboard moments was generally too high in the solar wind, although closer to expected values in the
Fig. 9. Superposed spins of ∼ 6 eV data, centred on the Sun direction, just before the start of the eclipse and mid-eclipse: anode 0–1 (look direction along spin axis) on the left, anodes 4–5 (look direction in spin plane) on the right. Top panel shows pre-eclipse (upper line) and mid-eclipse (lower line) data, lower panel shows the difference between the two.
magnetosheath. Currently, in-flight and ground calibration data are being used to improve the knowledge of both geo-metric factors and energy dependent efficiencies, after which we plan to determine the degree to which spacecraft potential effects cause errors in the onboard moments.
Acknowledgement. The authors wish to thank the referees for their constructive comments. We thank the ASPOC, EFW and FGM teams for use of their data and co-operation. We acknowledge the work of MSSL/UCL PEACE engineering and operations teams. This work was supported in the UK by PPARC.
Topical Editor G. Chanteur thanks E. Scime and P. Anderson for their help in evaluating this paper.
References
Alsop, C., Scott, S., and Free, L.: UV rejection design and perfor-mance of the PEACE electrostatic analysers, AGU, Geophysical Monograph, 102, 269, 1998.
Balogh, A., Dunlop, M. W., Cowley, S. W. H., Southwood, D. J., Thomlinson, J. G., Glassmeier, K. H., Musmann, G., L¨uhr, H., Buchert, S., Acu˜na, M. H., Fairfield, D. H., Slavin, J. A., Riedler, W., Schwingenschuh, K., Kivelson, M. G., and the Cluster Mag-netometer Team: The Cluster magnetic field investigation, Space Sci. Rev., 79, 65, 1997.
Comfort, R. H., Baugher, C. R., and Chappell, C. R.: Use of thin sheath approximation for obtaining ion temperatures from the ISEE 1 limited aperture RPA, J. Geophys. Res., 87, 5109, 1982. Credland, J., Mecke, G., and Ellwood, J.: The Cluster mission:
ESA’s spacefleet to the magnetosphere, Space Sci. Rev., 79, 33, 1997.
Escoubet, C. P., Pedersen, A., Schmidt, R., and Lindqvist, P. A.: Density in the magnetosphere inferred from ISEE 1 spacecraft potential, J. Geophys. Res., 102, 17 595, 1997.
Garrett, H. B.: The charging of spacecraft surfaces, Handbook of Geophysics and the Space Environment, Chapter 7, AFGL, 1985. Gustaffson, G., Bostr¨om, R., Holback, B., Holmgren, G.,
Lund-gren, A., Stasiewicz, K., Ahlen, L., Mozer, F. S., Pankow, D., Harvey, P., Berg, P., Ulrich, R., Pedersen, A., Schmidt, R., But-ler, A., Fransen, A. W. C., Klinge, D., Thomsen, M., Faltham-mar, C.-G., Lindqvist, P.-A., Christenson, S., Holtet, J., Lybekk, B., Sten, T. A., Tanskanen, P., Lappalainen, K., and Wygant, J.: The electric field and wave experiment for the Cluster mission, Space Sci. Rev., 79, 137, 1997.
Johnstone, A. D., Burge, S., Carter, P. J., Coates, A. J., Coker, A. J., Fazakerley, A. N., Grande, M., Gowan, R. A., Gurgiolo, C., Han-cock, B. K., Narheim, B., Preece, A., Sheather, P. H., Winning-ham, J. D., and Woodliffe, R. D.: PEACE: A plasma electron and current experiment, Space Sci. Rev., 79, 351, 1997.
Pedersen, A.: Solar wind and magnetosphere plasma diagnostics by spacecraft electrostatic potential measurements, Ann. Geophysi-cae, 13, 118, 1995.
Riedler, W., Torkar, K., R¨udenauer, F., Fehringer, M., Pedersen, A., Schmidt, R., Grard, R. J. L., Arends, H., Narheim, B. T., Troim, J., Torbert, R., Olsen, R. C., Whipple, E., Goldstein, R., Vala-vanoglou, N., and Zhao, H.: Active spacecraft potential control, Space Sci. Rev., 79, 271, 1997.
Schmidt, R., Arends, H., Pedersen, A., Rudenauer, F., Fehringer, M., Narheim, B. T., Svenes, R., Kvernsveen, K., Tsuruda, K., Mukai, T., Hayakawa, H., and Nakamura, M.: Results from ac-tive spacecraft potential control on the Geotail spacecraft, J. Geo-phys. Res., 100, 17 253, 1995.
Scime, E. E., Phillips, J. L., and Bame, S. J.: Effects of spacecraft potential on three-dimensional electron measurements in the so-lar wind, J. Geophys. Res., 99, 14 769, 1994.
Scime, E. E.: How to really measure low energy electrons in space, Measurement Techniques in Space Plasmas: Fields, AGU, Geo-physical Monograph, 103, 229, 1998.
Sojka, J. J., Wrenn, G. L., and Johnson, J. F. E.: Pitch angle proper-ties of magnetospheric thermal protons and satellite sheath inter-ference in their observation, J. Geophys. Res., 89, 9801, 1984. Zhao, H., Schmidt, R., Escoubet, C. P., Torkar, K., and Riedler, W.:
Self-consistent determination of the electrostatic potential barrier due to the photoelectron sheath near a spacecraft, J. Geophys. Res., 101, 15 653, 1996.