HAL Id: hal-02989245
https://hal.archives-ouvertes.fr/hal-02989245
Submitted on 5 Nov 2020HAL is a multi-disciplinary open access archive for the deposit and dissemination of sci-entific research documents, whether they are pub-lished or not. The documents may come from teaching and research institutions in France or abroad, or from public or private research centers.
L’archive ouverte pluridisciplinaire HAL, est destinée au dépôt et à la diffusion de documents scientifiques de niveau recherche, publiés ou non, émanant des établissements d’enseignement et de recherche français ou étrangers, des laboratoires publics ou privés.
Hydroclimate change in subtropical South Africa during
the mid-Piacenzian Warm Period
Xueqin Zhao, Andreas Koutsodendris, Thibaut Caley, Lydie Dupont
To cite this version:
Xueqin Zhao, Andreas Koutsodendris, Thibaut Caley, Lydie Dupont. Hydroclimate change in sub-tropical South Africa during the mid-Piacenzian Warm Period. Quaternary Science Reviews, Elsevier, 2020, 249, pp.106643. �10.1016/j.quascirev.2020.106643�. �hal-02989245�
Hydroclimate change in subtropical South Africa during the
1
Mid-Piacenzian Warm Period
2
Xueqin Zhao1, Andreas Koutsodendris2, Thibaut Caley3, Lydie Dupont1
3
1 MARUM - Center for Marine Environmental Sciences, University of Bremen,
4
Leobener Straße, D-28359 Bremen, Germany 5
2 Institute of Earth Sciences, Heidelberg University, Im Neuenheimer Feld 234-236,
D-6
69120 Heidelberg, Germany 7
3 EPOC, UMR 5805, CNRS, University of Bordeaux, Pessac, France
8
9
Abstract
10
The mid-Piacenzian Warm Period (mPWP, 3.264-3.025 Ma) of the Pliocene epoch has 11
been proposed as an analog for future climate scenarios. Disagreement between the 12
paleoenvironmental reconstruction and model simulations of the climate in subtropical 13
regions for this period suggests that more investigation of the subtropical climate 14
variability of the mPWP is needed. This study presents pollen, microcharcoal and 15
benthic foraminifera oxygen isotope records generated from marine sediment cores of 16
International Ocean Discovery Program (IODP) Exp. 361 Site U1479 from the Cape 17
Basin offshore of South Africa for the period between 3.337 and 2.875 Ma. With an 18
average sample resolution of 3 ka, this record represents the highest-resolution record 19
of mPWP vegetation change from the region. Our results indicate that the vegetation 20
during the mPWP was dominated by fynbos (species-rich heathy vegetation in the 21
Cape Floristic Region) with variable proportions of Ericaceae. Moreover, the 22
development of the Afrotemperate forest (tall, multilayered indigenous forests in South 23
Africa) reflects shifts in the amounts of precipitation between winter and summer in the 24
year-round rainfall zone. The vegetation variation is probably influenced by the 25
latitudinal insolation gradient in response to precession forcing. Several glacials 26
depicted by the benthic foraminifera oxygen isotope record were characterized by 27
lower percentage values of Restionaceae, higher percentage values of ericoid fynbos 28
and Afrotemperate forest. These events correspond well with cooler SE Atlantic sea 29
surface temperatures driven by interactions of both atmospheric and oceanographic 30
processes. The cooler sea surface temperatures attributed to Antarctic ice sheet 31
expansion, reduced Agulhas leakage (heat and salt transfer from the Indian Ocean to 32
the Atlantic Ocean) and/or intensified southern Benguela upwelling, resulted in less 33
precipitation in the winter rainfall zone of South Africa. 34
Keywords: Vegetation, hydroclimate, mid-Piacenzian Warm Period, IODP Site U1479, 35
South Africa 36
1. Introduction
37
The mid-Piacenzian (mid-Pliocene) Warm Period (mPWP, 3.264–3.025 Ma) of the 38
Pliocene epoch was the most recent period in geological history in which global climate 39
was warmer than today as depicted by both paleoclimate data and modelling studies 40
(Haywood et al., 2013). During that period, paleogeography, paleoceanography and 41
paleobiology were the same or very similar to the modern situation (Crowley, 1996) 42
making the mPWP a suitable analog for future climate scenarios (Haywood et al., 2009, 43
2013). On this basis, the mPWP has become the focus of comparative and detailed 44
numerical climate modelling and data/model comparisons. The simulated global 45
temperatures during the mPWP were approximately 2–3°C higher than today 46
(Haywood and Valdes, 2004) and atmospheric CO2 concentrations (between 330 and
47
400 parts per million) were estimated to be 50-120 ppm higher than pre-industrial levels 48
(275-285 ppm) and probably close to today’s level (Pagani et al., 2010). Average global 49
sea level was 10–40 m higher than today (Raymo et al., 2011), the extent of continental 50
ice sheets was limited (Dolan et al., 2011), and the Atlantic meridional overturning 51
circulation (AMOC) was comparable to or stronger than during pre-industrial times 52
(Raymo et al., 1996). 53
However, it remains unclear what mechanisms drove the amplification of warm 54
conditions during the mPWP. Previous studies including paleoclimate modelling, 55
micropaleontological paleotemperature records and paleo-CO2 estimates based on the
56
boron isotopes of planktic foraminifers, have focused on the role of the atmosphere 57
and oceans, in particular that of ocean-atmospheric CO2 levels and changes in the
58
meridional ocean heat flux (Bartoli et al., 2011; Dowsett et al., 1992; Rind and Chandler, 59
1991). Later studies, however, suggest additional drivers of the warmer Pliocene 60
conditions independently or in combination with CO2 concentration variations
(Haywood et al., 2009). Salzmann et al. (2008) proposed that the potential causes for 62
the mPWP have only been partially identified. These causes may relate to a 63
combination of changes in orography, atmospheric CO2 concentrations, water vapor
64
content, ocean circulations and ocean heat transport (Crowley, 1996; Lunt et al., 2012; 65
Raymo et al., 1996), which in turn affect changes in sea-ice cover, surface albedo, 66
cloud cover and temperature (Haywood and Valdes, 2004). 67
Although the climate of the middle Pliocene is relatively stable compared to the 68
Quaternary, it does display climate variability on orbital timescales (Lisiecki and Raymo, 69
2005), which can be interpreted to represent glacial-interglacial periods (Lunt et al., 70
2012). Just prior to the mPWP, the middle Pliocene was interrupted by a short intense 71
global glaciation (3.305–3.285 Ma) during marine isotope stage M2 (MIS M2) (Lisiecki 72
and Raymo, 2005), which may be seen as a premature step of the climate system in 73
establishing an ice age world (De Schepper et al., 2009; Prell, 1984). The mPWP 74
encompasses six interglacials and glacials including the glacial MIS KM2. Earlier 75
studies compared separately modelled interglacials within the mPWP. The results 76
show that different orbital boundary conditions lead to considerable differences in 77
simulated climate and vegetation between the warm stages (Prescott et al., 2018). 78
We collected summarized paleovegetation studies of the middle and late Pliocene 79
based on pollen or carbon isotopic composition of pedogenic carbonate and mammal 80
teeth. The results show consistency with modern vegetation (Figure 1), however, due 81
to the lack of records in the southern hemisphere, it should be interpreted with caution. 82
Many paleoclimate studies indicate that the vast northern and southern subtropical 83
regions were wetter during the Miocene and Pliocene with a spread of tropical 84
savannahs and woodland where subtropical deserts and arid regions exist today 85
(Salzmann et al., 2008), in particular in Africa (Levin, 2015) and Australia (Martin, 2006). 86
However, most models predict drier conditions during past warm climates including the 87
warm Pliocene (Lau et al., 2013). This puzzle is explained by weaker atmospheric 88
circulation in response to reduced meridional and zonal temperature gradients (Burls 89
and Fedorov, 2017). 90
91
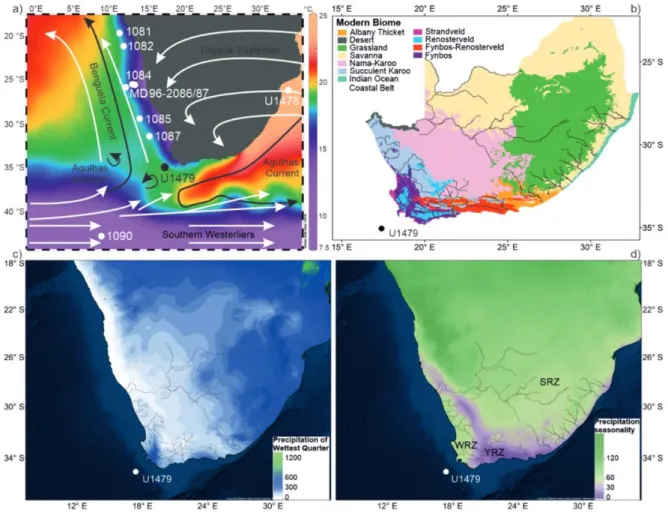
Figure 1. Modern biomes (a) and paleovegetation records between 5 and 2.2 Ma (b). The colors in (b) 92
correspond to the modern terrestrial biomes which are derived from the World Wildlife Fund (WWF)
93
ecoregions depicted in (a). The Y-axis “Sites” in (b) corresponds to the numbers in (a). Detailed data
94
sources of (b) can be found in Supplementary file 1.
95
Southern Africa has experienced strong regional differences in moisture availability 96
(Chase and Meadows, 2007; Zhao et al., 2016b) due to the interactions of both 97
atmospheric and oceanic circulations between the South Atlantic, Indian and Southern 98
Oceans. The combination of palynological, geomorphological and sedimentological 99
evidence indicates warm mesic conditions in southern Africa during the mid-Pliocene 100
(Scott and Partridge, 1994). A mixture of shrubland (fynbos), woodland and forest 101
prevailing in South Africa during the mid-Pliocene suggests more humid conditions 102
(Salzmann et al., 2008). On the other hand, the model study by Prescott et al. (2018) 103
infers dominance of shrubland and desert instead of forest and woodland in South 104
Africa during all four mPWP interglacials (G17, K1, KM3 and KM5c). Moreover, other 105
models also predict less annual rainfall and less winter rainfall for Pliocene South Africa 106
(Hunter et al., 2019). First data-model comparisons (the Pliocene Model 107
Intercomparison Project Phase 2; PlioMIP2), mainly concerning sea surface 108
temperatures, have been carried out (Haywood et al., 2020, accepted). The results 109
show significant agreement between simulated and reconstructed temperature change 110
although with notable local signals of data/model disagreement occurring in the 111
Benguela upwelling system. The large data/model discrepancy in the Benguela 112
upwelling system is also observed in SST anomalies focusing on MIS KM5c (3.205 Ma) 113
(the warmest phase of the mPWP), which might be accounted for by a combination of 114
displaced upwelling and warm upwelled water (McClymont et al., 2020). These data-115
model mismatches indicate that more detailed mPWP hydroclimate reconstructions of 116
subtropical regions are needed, especially in the southern hemisphere where well-117
dated high-resolution Pliocene paleorecords are scarce. As such, a new record from 118
the South African Cape region at the intersection of the different atmospheric and 119
oceanic systems between the South Atlantic, Indian and Southern Oceans is essential 120
to fill in a gap of information on the southern hemisphere subtropical regions. Thus, to 121
better understand the hydroclimate of subtropical southern Africa during the mPWP, 122
we produced a continuous high-resolution pollen, microcharcoal and benthic 123
foraminifera oxygen isotope record from marine sediment cores of IODP Exp. 361 Site 124
U1479 for the period between 3.337 and 2.875 Ma at millennial-scale resolution (ca. 3 125
ka) (Figure 2). The aim of our study is to assess the variability of vegetation and climate 126
changes in southernmost Africa during the mPWP and to determine possible driving 127
mechanisms. 128
129
Figure 2. (a) Map of modern atmospheric and oceanic circulations with modern sea surface 130
temperatures (World Ocean Atlas 2013) and the location of IODP Site U1479 and the other sites
131
discussed in this study. (b) Modern vegetation of South Africa with main rivers draining to the ocean
132
(Mucina and Rutherford, 2006). Modern precipitation of wettest quarter (c) and precipitation seasonality
133
(d) showing three different rainfall zones in southern Africa derived from WorldClim version 1.3 (Hijmans
134
et al., 2005). Winter rainfall zone, WRZ, at the southwestern tip of the continent which receives over 66%
135
of annual rainfall between April and September; year-round rainfall zone, YRZ, which receives both
136
winter and summer rainfall throughout the year (purple); summer rainfall zone, SRZ, in the rest of the
137
subcontinent which receives over 66% of annual rainfall between October and March.
138
2. Regional setting
139
2.1 Climate and oceanic circulation
140
Modern climate of southern Africa is controlled by the position and strength of the 141
South Atlantic and the Indian Ocean anticyclones (Shannon and Nelson, 1996) (Figure 142
2), which results in three different rainfall zones from west to east of South Africa: 143
winter rainfall zone (WRZ), year-round rainfall zone (YRZ) and summer rainfall zone 144
(SRZ) (Tyson and Preston-Whyte, 2000). The pressure difference between the South 145
Atlantic anticyclone and the continental pressure field causes alongshore southeast 146
trade winds (SE trade winds). The SE trade winds drive an offshore, surface-drift 147
inducing Benguela upwelling causing aridity in western southern Africa north of the 148
Cape region. In the Cape region, moisture is mainly supplied by the southern westerlies 149
during austral winter. The northern part of the WRZ is relatively arid due to the all-year 150
influence of the cold waters of the Benguela upwelling system. The influence of 151
westward to south-westward directed offshore winds (known as Berg winds) is very 152
limited because they are blocked by the southern westerlies and almost no dust plumes 153
can be observed south of 28°S (Eckardt and Kuring, 2005). The SRZ receives most of 154
its rainfall from tropical moisture easterlies during austral summer. In contrast to the 155
pronounced seasonality in the WRZ and SRZ, an intermediary area between them is 156
the YRZ influenced by the interaction of both temperate and tropical circulation 157
systems. In the YRZ, at least 11 but mostly all 12 months of the year contribute 5% or 158
more to the long-term average of the total annual rainfall during 1979–2011 159
(Engelbrecht et al., 2015). 160
Rainfall amounts, seasonality and distribution patterns in southern Africa are further 161
influenced by two major oceanic circulation systems (Figure 2). One is the northward 162
flowing Benguela Current (BC) along the west coast of southern Africa, the other is the 163
Agulhas Current (AgC) (Nelson and Hutchings, 1983; Shannon and Nelson, 1996). At 164
the southern boundary of the Benguela upwelling system, the relatively cool and 165
oligotrophic waters of the South Atlantic Current and the cold waters of the Antarctic 166
Circumpolar Current meet the south-westward flowing warm and saline waters of the 167
Agulhas Current. Most of the AgC waters are retroflected to the south and east forming 168
the Agulhas Return Current, while a small part of the AgC continues in a north-westerly 169
direction through the South Atlantic Ocean in the form of eddies. The leakage is 170
determined mainly by the latitudinal position and intensities of the southern westerlies. 171
During austral summer, the southward contraction and intensification of the southern 172
westerlies would favor more Agulhas leakage, coinciding with aridity in the WRZ 173
(Biastoch et al., 2009; Durgadoo et al., 2013). 174
IODP Exp. 361 Site U1479 is located on the western slope of the Agulhas Bank in 175
Cape Town under the pathway of mixed water masses: southward flowing North 176
Atlantic deep water, cold northward-flowing Benguela Current, warm and salty Agulhas 177
leakage (Hall et al., 2017). 178
2.2 Vegetation and fire
179
The strong west-east gradient in rainfall amount and seasonality has a great effect on 180
the vegetation resulting in nine biomes in southern Africa (Figure 2) (Cowling et al., 181
1997; Mucina and Rutherford, 2006). The continental area near the study site is 182
dominated by vegetation types including Fynbos, Renosterveld, Succulent Karoo and 183
Nama Karoo. In addition, small patches of Afrotemperate Forest occur. 184
Subtropical regions are equatorward defined by the transition from subtropical to 185
tropical (monsoonal) climates. The rainfall season changes from summer rains in the 186
tropics to winter rains in the subtropics, which has a large impact on vegetation. In 187
southern Africa, the subtropical winter rainfall zone (Chase and Meadows, 2007) is 188
nowadays restricted to the Western and Southern Cape Province, which is mainly 189
dominated by fynbos (Linder, 2003). Fynbos is a species-rich heathy vegetation, 190
which was established in South Africa during the late Miocene (Dupont et al., 2011). 191
The Fynbos biome, part of the Cape Floristic Region, has extremely high levels of 192
species richness and endemism. It is an evergreen, fire-prone shrubland in the 193
southwest Cape, which is typified by the presence of restios (wiry, evergreen 194
graminoids of the Restionaceae), a high cover of ericoid shrubs (fine-leaved shrubs of 195
Ericaceae, Asteraceae, Rhamnaceae, Thymelaeaceae and Rutaceae), and the 196
common occurrence of proteoid shrubs (Proteaceae). Rainfall usually varies from 600 197
to 800 mm/yr. Other important features of fynbos are the presence of leaf spinescence, 198
high sedge (Cyperaceae) cover and low grass (Poaceae) cover (Mucina and 199
Rutherford, 2006). Fynbos is found especially along the southwestern and southern 200
coast of South Africa and thus receives most rainfall during austral winter. 201
Renosterveld is an evergreen, fire-prone shrubland or grassland, which is dominated
202
by small, cupressoid-leaved and evergreen asteraceous shrubs (principally 203
renosterbos, Elytropappus rhinocerotis). Other important shrub represented in 204
renosterveld include Boraginaceae, Fabaceae, Malvaceae, Cliffortia and 205
Anthospermum (Goldblatt and Manning, 2002). The Succulent Karoo biome, located
206
in a narrow strip inland of the west coast, is a semidesert region characterized by dwarf 207
leaf-succulents of which Aizoaceae (including Mesembryanthemoideae) and 208
Crassulaceae are particularly prominent; many other families are also common 209
including Asteraceae, Amaranthaceae, Euphorbiaceae (Euphorbia) and 210
Zygophyllaceae (Zygophyllum) (Wheeler, 2010) but grass cover is low. In comparison 211
to the Fynbos biome, the Succulent Karoo biome is better adapted to arid conditions 212
and higher summer temperatures (Carr et al., 2014), receiving most of the rainfall 213
during austral winter. The Nama Karoo biome, which is a semi-desert dwarf and 214
grassy shrubland found on the central plateau, is dominated by Asteraceae, Poaceae, 215
Aizoaceae, Liliaceae and Scrophulariaceae. The Nama Karoo biome located northeast 216
of the study area, receives rainfall mainly during austral summer. The Afrotemperate 217
Forest biome, which is restricted to areas with mean annual rainfall of more than 725
218
mm in the SRZ and more than 525 mm in the WRZ (Mucina and Rutherford, 2006) 219
comprises mostly of evergreen trees in multi-layered canopies, while the ground layer 220
is often poorly developed due to the dense shade. The southern Afrotemperate forest 221
occurs in patches near Port Elizabeth in the east to Cape Peninsula in the west along 222
the feet of south and east-facing slopes, and in ravines and deep gorges of the Cape 223
Fold Belt mountains (Bergh et al., 2014). These forests reach their greatest extent in 224
the southern Cape along the narrow (ca. 250 km long) coastal strip between 225
Humansdorp in the east to the west of Mossel Bay (Bergh et al., 2014). 226
Fire is important in the fynbos ecosystem, which burns on a 5–50 year rotation, usually 227
in the order of 15–25 years (Mucina and Rutherford, 2006). Fire regimes in 228
Renosterveld are largely unknown; it is however assumed that fire rotation lies within 229
a 2–10 year range. Presently, fires occur in late summer and early autumn, towards 230
the end of the dry season naturally due to sparks of rockfalls and lightning (Bond, 1996; 231
Van As et al., 2012). 232
The YRZ also plays an important role in fostering the extraordinary botanical diversity 233
of the region (Mucina and Rutherford, 2006; Bergh et al., 2014). In the southern Cape 234
region, there is a mosaic of various vegetation types of fynbos as well as Afrotemperate 235
forest and coastal thicket. Generally, Afrotemperate forest patches require the highest 236
values of soil moisture (average annual rainfall varies between 500 and 1200 mm) 237
(Mucina and Rutherford, 2006) and are thus most prominent in the valleys, whereas 238
fynbos and coastal thicket occur in the coastal lowlands and dunes (Quick et al., 2018). 239
Afrotemperate forest in this region can be found within the Touws River and Duiwe 240
River valleys which are dominated by Afrocarpus falcatus, Podocarpus latifolius and 241
Olea capensis (Cowling et al., 1997).
242
3. Materials and methods
243
3.1 Materials and age model
The samples investigated in this study were collected from sediment cores of IODP 245
Exp. 361 Site U1479 (35°03.52’S, 17°24.03’E, ~2630 m water depth). Site U1479 is 246
located in the Cape Basin on a 30 km wide morphological high, rising ~200 m above 247
the regional seafloor on the mid to lower western slope of the Agulhas Bank, ~130 km 248
southwest of Table Mountain and Cape Town, South Africa (Hall et al., 2017). Material 249
from the undisturbed Holes U1479B and U1479C were selected to obtain a complete 250
spliced stratigraphic section from the best core parts using color and natural gamma 251
ray data. The photos of the cores can be found on the IODP website with the following 252
link (http://publications.iodp.org/proceedings/361/EXP_REPT/CORES/IMAGES/). The 253
original meter composite depth was updated to an adjusted, so-called composite depth 254
below seafloor (m CCSF-A). The study interval was first defined based on the 255
shipboard age model, which was developed using bio- and magnetostratigraphy (Hall 256
et al., 2017). The final age model across the study interval was further refined by tuning 257
of benthic foraminifera oxygen isotope curves to the global LR04 benthic 𝛿18O stack
258
(Lisiecki and Raymo, 2005) using the AnalySeries software (Paillard et al., 1996) and 259
yielded a correlation coefficient of R = 0.81 for the studied time interval. It provides a 260
continuous record between 3.337 and 2.875 Ma. The sedimentation rates of the 261
investigated interval between 141.24 and 164.07 m CCSF-A lie between 4.1 and 6.8 262
cm/ka (an average of 5.0 cm/ka). 263
3.2 Benthic foraminifera
𝛿
18O analysis
264
Specimens of benthic Cibicides wuellerstorfi foraminifera were picked from the 250– 265
315 μm size fraction. 266
76 samples were measured with a MultiPrep system on line with a dual Inlet 267
IsoPrime™ Isotope Ratio Mass Spectrometer (IRMS) at the Laboratoire de Geologie 268
of the University of Lyon. Calcium carbonates were reacted with anhydrous phosphoric 269
acid at 90°C to generate CO2. Isotope compositions are quoted in the delta notation
270
in ‰ relative to Vienna Pee Dee Belemnite (VPDB). Isotopic data result from a one-271
point calibration using the internal reference ‘Carrara Marble’ (Analytical standard 272
deviation of 0.05‰ for 𝛿18O with a carbonate weight >100μg and 0.1‰ with a
273
carbonate weight <100μg), itself regularly calibrated against the international reference 274
NBS19. 275
17 samples were carried out on a Thermo Scientific 253 Plus isotope ratio mass 276
spectrometer coupled to a Kiel IV carbonate device at EPOC laboratory, University of 277
Bordeaux. The automated preparation system (Kiel IV) transforms solid carbonate 278
samples into CO2 gas by treatment with orthophosphoric acid at a constant
279
temperature of 70°C. The sample CO2 gas is then transferred using a microvolume,
280
and introduced by dual inlet in the Mass spectrometer to measure its 18O/16O isotopic
281
ratio in comparison with a calibrated reference gas. Aliquots of NBS19 standard, which 282
is calibrated against the VPDB, were analyzed with the samples to correct any 283
deviation of the reference gas. Oxygen isotopic ratio values are expressed using the 𝛿 284
notation with a per mil deviation (‰) from VPDB. Analytical standard deviation is ≈ 285
0.06‰ for 𝛿18O.
286
In three of the samples analyzed in this study no Cibicides wuellerstorfi could be found. 287
We, therefore, analyzed 𝛿18O on Uvigerina peregrina taxa in the same size fraction.
288
Because Uvigerina peregrina is isotopically heavier than Cibicides by 0.47‰, we 289
adjusted Uvigerina peregrina 𝛿18O to the Cibicides scale by subtracting 0.47‰
290
according to Marchitto et al. (2014). Benthic foraminifera 𝛿18O are available and stored
291
in the Pangaea database (https://doi.pangaea.de/10.1594/PANGAEA.919576). 292
3.3 Palynological analysis
A total of 151 samples were taken at 15 cm intervals between 141.24 and 164.07 m 294
CCSF-A for palynological analysis, aiming at a temporal resolution of ca. 3 ka. The 295
samples were prepared with the following steps: 1) determination of the sample volume 296
by water replacement; 2) decalcification with diluted cold HCl (~10%) and addition of 297
Lycopodium spore tablets (12 samples with 2 tablets of batch Nr. 4832162 and the
298
other 139 samples with 2 tablets of batch Nr. 177745); 3) after washing, the samples 299
were treated with cold HF (~40%); 4) the samples were shaken for 2 hours, and then 300
kept standing for two days to remove silicates; 5) concentrated HCl (~37%) was added 301
to keep fluor-complexes in solution; 6) all samples were first sieved over a 125 µm 302
metal mesh and then sieved over a 7-µm nylon mesh screen while ultrasonically 303
disaggregating organic matter; 7) samples were stored in water, mounted in glycerol 304
and examined under a light microscope (magnification 400 x and 1000 x) for pollen, 305
spores, fresh-water algae, and microcharcoal. Pollen grains were identified using the 306
African pollen reference collection of the Department of Palynology and Climate 307
Dynamics of the University of Göttingen, the African Pollen Database 308
(http://apd.sedoo.fr/pollen/interface/indexPollen.html) and literature (Bonnefille and 309
Riollet, 1980; Scott, 1982). Pollen zonation was conducted by Constrained Incremental 310
Sum of Squares Cluster Analysis (CONISS, TILIA 2.0.41, with dendrogram scale of 311
total sum of squares) including all counted pollen and spore taxa (Figure 3). All pollen 312
and spore taxa were included in the pollen sum (ranging between 145 and 347 with an 313
average of 290 per sample) used to calculate pollen percentages. Pollen concentration 314
was determined based on the Lycopodium spore counts. Samples volumes were 315
measured using water displacement to calculate concentration values. Pollen 316
accumulation rates were calculated by multiplying the pollen concentration (grains/cm3)
317
by the sedimentation rate (cm/ka) for each sample. The 95% confidence intervals of 318
percentages were calculated following Maher (1972). All counts of pollen and spores 319
are available and stored in the Pangaea database 320
(https://doi.pangaea.de/10.1594/PANGAEA.919633). Microcharcoal analysis was 321
conducted on the same slides as the pollen analysis using the 202-touch point count 322
method (Clark, 1982) to calculate the microcharcoal concentration in square 323
centimeter/cubic centimeter (cm2/cm3). At least 225 fields per sample were analyzed
324
to improve the statistical reliability of the results. Microcharcoal concentrations are 325
available and stored in the Pangaea database 326
(https://doi.pangaea.de/10.1594/PANGAEA.919575). 327
3.4 Spectral analysis
328
To analyze cyclicity in the palynological records, we carried out a spectral analysis 329
(window: hanning; oversample: 2; segments: 3) using the module REDFIT (Schulz and 330
Mudelsee, 2002) of the paleontological statistics package PAST vs 3.0 (Hammer et al., 331
2001). 332
A cross spectral analysis between pollen groups and southern hemisphere latitudinal 333
winter insolation gradient (LIG) was also carried out with AnalySeries software (Paillard 334
et al., 1996). Linear interpolation was used to resample data and LIG according to the 335
pollen resolution. For each analysis, B-Tukey spectrum was used within a Bartlett 336
window. The time step used for the B-Tukey analysis is 2000 years. The bandwidth is 337
1.07 × 10⁻⁵, non-zero coherence significant at the 95% confidence level is higher than
338
0.55. 339
4. Results
340
Pollen and spores are relatively abundant and generally well preserved in IODP Site 341
U1479 for the period 3.337 to 2.875 Ma. Pollen concentrations range from 289 to 1037 342
grains/cm3 with an average of 533 grains/cm3 and pollen accumulation rates range
from 1.2×10³ to 5×10³ grains/cm2/ka with an average of 2.7×10³ grains/cm2/ka. The
344
pollen diagram of selected pollen taxa for the period from 3.337 to 2.875 Ma is provided 345
in Figure 3. The most abundant pollen taxa throughout the record are Restionaceae 346
(~18–44%, average 33%), Cyperaceae (~9–26%, average 18%), Tubuliflorae (~4– 347
15%, average 9%), Podocarpaceae (~1–15%, average 5%), Poaceae (~2–11%, 348
average 6%). Other common pollen taxa include Stoebe-Elytropappus-type (~0–7%, 349
average 2%), Ericaceae (~1–8%, average 4%), CCA (including Amaranthaceae, and 350
Caryophyllaceae) (~0–9%, average 3%), Cliffortia-type (~0–3%, average 0.7%), 351
Passerina (~0–3%, average 0.6%), Protea-type (~0–4%, average 1%),
Phragmitis-352
type (~0–7%, average 2%), Artemisia-type (~0–3%, average 0.7%), Anthospermum 353
(~0–4%, average 0.8%), Pentzia-type (~0–4%, average 2%) and Euphorbia (~0–3%, 354
average 0.6%). 355
The identified pollen was grouped into vegetation categories (Figure 4) as ericoid 356
fynbos (including Stoebe-Elytropappus-type, Ericaceae, Cliffortia, Passerina, other 357
Thymelaeaceae, Protea-type), wetland taxa (including Cyperaceae, Phragmites-type, 358
Typha, Haloragaceae), cosmopolitan taxa (including Poaceae, Asteraceae
359
Tubuliflorae, Artemisia-type, Anthospermum, Euphorbiaceae pp), succulent and 360
drought-resistant taxa (including Pentzia-type, Amaranthaceae, Aizoaceae, Euphorbia) 361
and Afrotemperate forest (including Podocarpaceae, Olea-type). This grouping is 362
based on the modern pollen distribution in the Namaqualand mudbelt along the west 363
coast of South Africa (Zhao et al., 2016a, 2016b) and on palynological studies from the 364
Cederberg Mountains (Valsecchi et al., 2013) and the south coast (Quick et al., 2018). 365
366
Figure 3. Pollen percentages of selected taxa from IODP Site U1479. Pollen assemblage zones were 367
derived by CONISS (Grimm, 2015).
368
The record has been divided into four pollen assemblage zones (PZ) using the 369
CONISS calculation (Grimm, 2015). Zone PZ-1 (3.337–3.280 Ma) is characterized by 370
pollen percentage maxima of Restionaceae, ericoid fynbos and Afrotemperate forest. 371
The percentages of succulent and drought taxa, and Cyperaceae reach minima in this 372
zone. Zone PZ-2 (3.280–3.107 Ma) is characterized by a pollen percentage decrease 373
of Restionaceae reaching minima around 3.147 Ma, while ericoid fynbos reaches high 374
values around the same time. Afrotemperate forest representation has much lower 375
values in PZ-2 than in PZ-1 but shows several peaks. Succulent and drought taxa start 376
to increase to high values between 3.279 and 3.156 Ma. This zone is also 377
characterized by the increase of wetland taxa reaching maxima around 3.136 Ma. In 378
zone PZ-3 (3.107–2.941 Ma), the pollen percentage of Restionaceae starts to increase 379
again, while the percentage of wetland taxa fluctuates around relatively high values 380
with slightly decreasing trend. Succulent and drought taxa fluctuate with no clear trend. 381
Zone PZ-4 (2.941–2.875 Ma) shows alternating percentage maxima of Restionaceae 382
and Afrotemperate forest. 383
Microcharcoal concentration values fluctuate between 0.04 and 0.17 cm2/cm3 with an
384
average of 0.09 cm2/cm3 (Figure 4). Microcharcoal concentrations are characterized
385
by relatively low values at the beginning of the record with a generally increasing trend 386
until 3.239 Ma and a maximum of 0.17 cm2/cm3 at 3.298 Ma. After 3.239 Ma,
387
microcharcoal concentrations start to decline reaching minimum values (0.04 cm2/cm3)
388
at 2.950 Ma which then increase to higher values again after 2.941 Ma. 389
390
Figure 4. Oxygen isotopes of benthic foraminifera of IODP Site U1479 (black) compared to the global 391
stack LR04 (gray) (Lisiecki and Raymo, 2005), pollen percentages (shading) and accumulation rates
392
(lines) of four groups (Restionaceae, ericoid fynbos, wetland taxa and Afrotemperate forest) as well as
393
the microcharcoal concentrations from IODP Site U1479 overlaid with precession (dashed lines) (Laskar
394
et al., 2004).
395
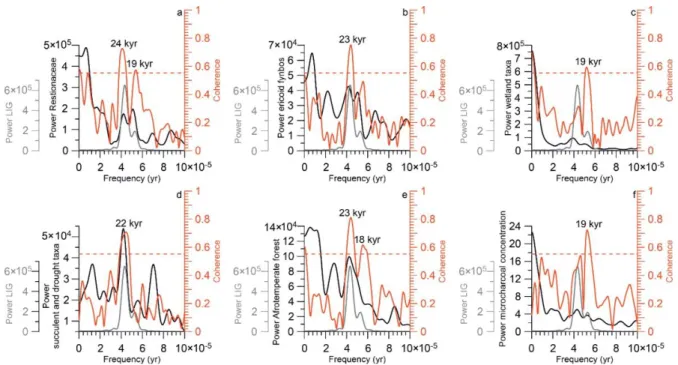
The spectral analysis of the Restionaceae, ericoid fynbos, wetland taxa, succulent and 396
drought taxa, and Afrotemperate forest pollen percentages as well as of microcharcoal 397
concentrations show persistent significant power within the 18–24 kyr precession 398
frequency bands (Figure 5). The same pattern is also found in the frequency analysis 399
of pollen concentrations and accumulation rates (Supplementary Figures 1 and 2). 400
401
Figure 5. REDFIT spectral analysis (window: hanning; oversample: 2; segments: 3) of the percentages 402
of different pollen groups and microcharcoal concentration from IODP Site U1479. Theor_AR_1_ means
403
theoretical first-order autoregressive (AR1). False-alarm levels of 80%, 90% and 95% are denoted.
404
The benthic foraminifera 𝛿18O record shows characteristic ‘glacial-interglacial’ changes
405
similar to the global LR04 benthic 𝛿18O stack. The specific values are higher at Site
406
U1479. Several glacials including MIS M2, KM2, G20 and G16 correspond to the 407
minima of Restionaceae and maxima of ericoid fynbos taxa (Figure 6). 408
5. Discussion
409
5.1 Pollen transport and source area
410
Pollen and spores can be transported from the continent to the ocean either by wind 411
or by rivers. Although in the semi-arid regions of southwestern Africa, wind transport is 412
a major transport process for terrigenous material to the ocean (Prospero, 1981; Scott 413
and van Zinderen Barker, 1985), fluvial transport could also be possible. The Pliocene 414
pollen record at ODP Site 1082 (west of Namibia, Figure 2) indicates mixed fluvial and 415
aeolian pollen transport before 2.2 Ma (Dupont, 2006). Considering that southern 416
South Africa is predominantly influenced by southern westerlies and SE trade winds 417
throughout the year, however, direct wind transport of pollen from the Cape province 418
to Site U1479 seems unlikely as the study site is situated outside the direct influence 419
of the SE trade winds (Figure 2). Pollen and spores in sediments of Site U1479 are 420
more probably transported by the rivers of the Southern Cape in to the ocean and from 421
there by the strong Agulhas Current to the study site. This is supported by the 422
continuous presence of freshwater cyst Pseudoschizaea (Rossignol, 1962) in Site 423
U1479 (Figure 3). As previous studies indicate that fine grained, wind-blown 424
terrigenous material can travel as far as the Agulhas Ridge entrained within the 425
Agulhas Current (Petschick et al., 1996), we assume that pollen and spores can also 426
be transported and deposited here. The material of Site U1479 is relatively rich in 427
pollen and spores and the floral composition of the palynological assemblage 428
dominated by the family of Restionaceae clearly points to an origin in fynbos vegetation. 429
We presume, therefore, that the Agulhas Current is instrumental in the westward 430
transport of aeolian or fluvial pollen and spores reaching the ocean along south coast 431
of South Africa. 432
433
Figure 6. a) Oxygen isotopes of benthic foraminifera of IODP Site U1479 (black) compared to the global 434
stack LR04 (gray) (Lisiecki and Raymo, 2005); b) sedimentation rates, c-f) pollen percentages and g)
435
microcharcoal concentrations of IODP Site U1479; h-i) alkenone-derived SSTs from ODP Sites 1087
(Petrick et al., 2015, 2018) and 1090 (Martínez‐García et al., 2010); j) precession (black) and southern
437
hemisphere latitudinal winter insolation gradient (LIG) (pink) (Laskar et al., 2004). Shadings of pollen
438
percentages denote 95% confidence intervals. The light blue vertical bars correspond to higher benthic
439
foraminifera 𝛿18O values, lower percentages of Restionaceae, high percentages of ericoid fynbos,
440
succulent and drought taxa and Afrotemperate forest, higher values of microcharcoal concentrations in
441
IODP Site U1479 and colder SST in ODP Sites 1087 and 1090.
442
5.2 Vegetation and hydroclimate response on latitudinal insolation
443
gradient forcing
444
At IODP Site U1479, the late Pliocene is characterized by a long-term trend of 445
decrease prior to 3.147 Ma and after that an increase of both the percentage values 446
and accumulation rates of Restionaceae correspond to a decrease of Ericaceae values 447
(Figures 4 and 6). The maxima of both Restionaceae and ericoid fynbos taxa before 448
3.304 Ma indicate that fynbos was the dominant vegetation group in the Cape region, 449
suggesting wetter conditions. However, the general decreasing trend in both 450
percentages and accumulation rates of Restionaceae until 3.147 Ma suggests that that 451
the climate got drier. Pollen accumulation rates depend not only on the production of 452
pollen but also on the transport efficiency. On one hand, drier conditions could result 453
in a decline of vegetation cover leading to less pollen production. On the other hand, it 454
could result in decreased river discharge which might induce less terrestrial input to 455
our core site. This might explain the inverse trend of Cyperaceae, which starts from 456
minima at the beginning of the record and reaches maxima around 3.136 Ma. 457
Cyperaceae growing in wet habitats have an ambiguous relation to wetness. The 458
climate deterioration prior to 3.147 Ma might have caused drying of shallow lakes, 459
which then became wetlands leading to an increase of sedges. The drier conditions 460
are also implied by high microcharcoal concentrations until 3.239 Ma, suggesting an 461
increase in fire under more arid and seasonal conditions and a vegetation providing 462
enough fuel biomass (Daniau et al., 2013). After 3.239 Ma, a further decline of the 463
representation of Restionaceae was observed reaching a minimum at 3.147 Ma; at the 464
same time ericoid fynbos percentages increased to a maximum. This might suggest a 465
shift in the composition of the fynbos. According to Mucina and Rutherford (2006), 466
modern ericoid fynbos is the wettest type of fynbos. However, in this study, the shift to 467
ericoid fynbos appears to be associated with the onset of drier conditions, which is 468
supported by Valsecchi et al. (2013) who propose that ericoid fynbos is favored by drier 469
conditions and higher fire frequencies. The pollen assemblage of the late Pleistocene 470
inferred from the same site (IODP Site U1479) indicates a dramatic decrease in 471
Restionaceae pollen percentages (less than 30%) (unpublished results from Lydie 472
Dupont) in comparison to the pollen assemblage of the middle Pliocene (this study). 473
This suggests the existence of a no-analogue vegetation during the middle Pliocene. 474
The high representation of succulent and drought taxa between 3.273 and 3.156 Ma 475
also indicates relatively dry conditions. At a first glance, this interpretation seems to be 476
inconsistent with the minima in microcharcoal concentrations between 3.195 and 3.154 477
Ma indicating a decrease in fire frequencies. However, fires in southern Africa are 478
affected by the interaction of different factors such as the peak of the dry season, fuel 479
loads and rainfall seasonality (Daniau et al., 2013; Woillez et al., 2014). Additionally, 480
drier conditions resulting in decreased river discharge could also be responsible for 481
less transport of charcoal particles to the ocean. Considering the lower total pollen 482
accumulation rates between 3.239 and 3.059 Ma, the relatively low microcharcoal 483
concentrations are attributed to less fuel biomass and less terrestrial input into ocean. 484
From 3.147 Ma onwards, the increase of Restionaceae pollen percentages 485
accompanied with relatively high wetland taxa percentages, relatively low percentages 486
of ericoid fynbos pollen and succulent and drought taxa indicate a relative increase in 487
humidity. 488
489
Figure 7. Cross spectral analysis between the percentages of different pollen groups (a, Restionaceae; 490
b, ericoid fynbos; c, wetland taxa; d, succulent and drought taxa; e, Afrotemperate forest) and
491
microcharcoal concentration (f) from IODP Site U1479 and LIG. The dash lines denote the non-zero
492
coherence limit (values higher than 0.55 are significant at the 95% confidence interval).
493
On orbital and shorter timescales, we find general relationships among the records 494
shown in Figure 6: pollen percentage minima of Restionaceae are associated with 495
maxima of ericoid fynbos, succulent drought taxa, Afrotemperate forest and 496
microcharcoal concentrations. Spectral analysis of the percentage values of 497
Restionaceae, ericoid fynbos, succulent and drought taxa, and Afrotemperate forest 498
as well as microcharcoal concentrations indicates significant periods of 18–24 kyr, 499
suggesting a strong effect of precession (Figure 5). The results of cross spectral 500
analysis support our interpretation indicating significant correlation between pollen 501
groups and LIG at precession cycles (18-24 kyr) (Figure 7). Minima in Restionaceae 502
occur in phasewith maxima in precession and minima in LIG between 60 and 30°S of 503
the southern hemisphere winter (21 June) (Supplementary Figure 3). Leads or lags 504
occur in ericoid fynbos (lag of 9500 yr), wetland taxa (lag of 9500 yr), Succulent and 505
drought taxa (slight lead of 1400 yr), Afrotemperate forest (lead of 9200 yr at 23 kyr 506
cycle and 6100 at 18 kyr cycle) and microcharcoal concentration (lag of 8300 yr). 507
The dominance of precession cycles in the pollen signal might be the effect of the 508
latitudinal temperature gradient during the southern hemisphere winter approximated 509
by the LIG, which is important in the forcing of the climate in the winter rainfall regions 510
of the mid-latitudes (Davis and Brewer, 2009). A Holocene model climate study shows 511
that a weaker latitudinal temperature gradient leads to weaker mid-latitude westerly 512
flow, weaker cyclones and reduced mid-latitude precipitation (Routson et al., 2019). A 513
reduced equator-to-pole winter temperature gradient was also observed to be related 514
to a reduced equator-to-pole insolation gradient and reduced storm track activity over 515
the Mediterranean Sea using a high-resolution coupled climate mode (Bosmans et al., 516
2015). A weak southern hemisphere winter gradient would weaken the southern 517
westerlies and reduce winter precipitation in both the WRZ and the YRZ (Figure 8). 518
Restionaceae, which have a strong winter-rainfall affiliation (Cowling et al., 1997), 519
decline due to the relatively dry conditions and reduced rainfall seasonality. Whereas, 520
in comparison to Restionaceae, ericoid fynbos is more favored by drier conditions. 521
Thus, the reduced winter precipitation and less Restionaceae will cause a relative 522
increase of ericoid fynbos. Based on pollen records, we could only refer that the relative 523
abundance of ericoid fynbos is higher which might be resulted from their areal extent. 524
The drier conditions also likely caused higher fire frequencies. The high-resolution 525
marine sediment core MD96-2098 off Namibia during the past 170,000 years in 526
southern Africa indicates high fire activity during precession maxima (Daniau et al., 527
2013), which is well supported by the microcharcoal-based reconstructions of past fire 528
activity during MIS4 in southern Africa (Woillez et al., 2014). In the YRZ, the high values 529
of Afrotemperate forest suggest more summer rainfall (Dupont et al., 2011; Quick et 530
al., 2018). Conversely a strong gradient would strengthen the westerlies and 531
associated rainfall in the WRZ and YRZ. Enhanced storm track activity of the southern 532
westerlies would result in humid conditions and intensified rainfall seasonality, leading 533
to high values of Restionaceae and lower values of ericoid fynbos as well as low fire 534
frequencies. A pollen and microcharcoal record from the coastal lake Eilandvlei shows 535
that the general long-term trend of increasing Afrotemperate forest with decreasing 536
fynbos was probably associated with reduced rainfall seasonality and more influences 537
of summer rainfall in maintaining higher moisture availability in the region (Quick et al., 538
2018). Thus, in the YRZ, the intensified rainfall seasonality and more winter rainfall 539
would hamper the growth of Afrotemperate forest. The pollen record suggests a 540
response of the vegetation to trends in the average winter precipitation by variations in 541
the proportion of Ericaceae in the fynbos. Shifts between the amounts of winter and 542
summer rainfall in the YRZ influenced the development of Afrotemperate forest (Figure 543
6). In conclusion, we infer that the vegetation variation at the Cape region reflects 544
moisture variability during the mPWP which is related to the LIG in response to 545
precession forcing. 546
547
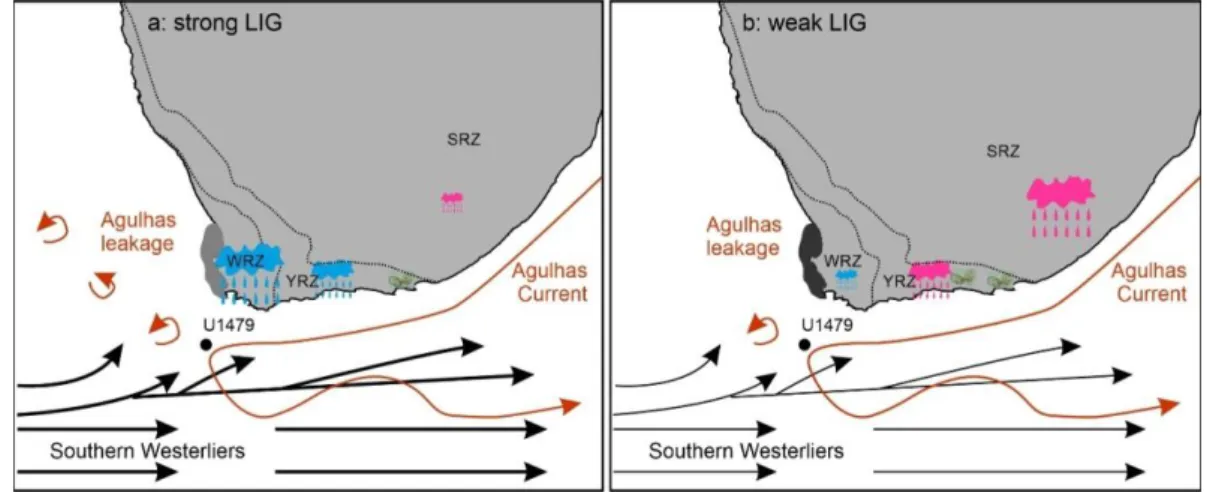
Figure 8. Conceptional model explaining the environmental variability for two different cases during the 548
mPWP in southern Africa. a) strong latitudinal insolation gradient (LIG) inducing strong southern
549
westerlies and warmer SST resulting from Antarctic sea ice retreat, stronger Agulhas leakage and/or
550
weakened upwelling. b) weak LIG inducing weak southern westerlies and cooler SST resulting from
551
Antarctic sea ice expansion, reduced Agulhas leakage and/or strengthened upwelling.
5.3 Vegetation and hydroclimate response during glacials: forcing by
553
sea surface temperatures (SST)
554
Even within the mPWP there are several glacials. In particular, the pronounced glacial 555
stage just before the onset of the mPWP known as “M2 glaciation” at 3.295 Ma in the 556
global stack LR04 𝛿18O
benthics record (Lisiecki and Raymo, 2005) has been interpreted
557
as an early major global cooling event prior to the onset of the northern hemisphere 558
glaciations at ca. 2.6 Ma (De Schepper et al., 2009; Prell, 1984). A short interval with 559
lower values of Restionaceae and high values of ericoid fynbos as well as 560
Afrotemperate forest between 3.331 and 3.160 Ma was observed, which is broadly 561
coincident with this glacial MIS M2 (Figure 6). This is supported by the X-ray 562
Fluorescence (XRF) data from IODP Site U1478 off Limpopo which suggest increased 563
runoff during the MIS M2 in the Mozambique Channel probably related to increased 564
rainfall in the SRZ (Koutsodendris et al., 2020). However, the most pronounced period 565
in our pollen record occurs between 3.147 and 3.129 Ma when Restionaceae 566
percentages reach minima together with high values of ericoid fynbos (Figure 6). The 567
period corresponds to another glacial, MIS KM2, which is also considered to be one of 568
the pronounced glacials during the Pliocene (De Schepper et al., 2009). This is 569
supported by the high pollen percentage values of Ericaceae, which are often used as 570
an indicator of colder climate (Gasse and Van Campo, 1998; Scott, 1999). Apart from 571
these two glacials, there are several other glacials characterized by low percentage 572
values of Restionaceae, high percentage values of ericoid fynbos and Afrotemperate 573
forest in our pollen record. The glacials correspond well with cold SST recorded at 574
ODP Sites 1087 and 1090 (Figure 6) (Martínez-García et al., 2010; Petrick et al., 2015, 575
2018). The TEX86 data from IODP Site U1478 off Limpopo also show a long-term SST
576
drop centered at ca. 3.2–3.1 Ma (Taylor et al., in review). We infer that SST influenced 577
hydroclimate variability and in turn vegetation during the mPWP. The colder SST would 578
reduce temperatures as well as winter rainfall in the WRZ and YRZ, which would lead 579
to a decline in Restionaceae and an increase in ericoid fynbos. The reduced 580
temperature and precipitation in the WRZ of southern Africa would thus enhance the 581
effect of weak winter LIG. 582
Numerical modelling supports our interpretation. Rreconstructed SST were simulated 583
and used to force a numerical climate model (Kamae et al., 2011). The results reveal 584
that wetter surface conditions in subtropical Africa during the mPWP are related to the 585
reduction of the meridional and zonal gradients of tropical SST rather than to orography, 586
land and/or sea ice. In this region, however, it is hard to distinguish between the 587
different factors resulting in variations of SST, which is affected by the interactions of 588
Agulhas leakage, Benguela Current as well as the advection of cold sub-Antarctic 589
water (Rosell-Melé et al., 2014). 590
Firstly, a decline in SST might be attributed to the global cooling triggered by Antarctic 591
ice sheet expansion. Proxy records and model studies generally infer a more northward 592
position of the southern westerlies during cooler climates/glacial periods (Bard and 593
Rickaby, 2009; Lamy et al., 2004; Williams and Bryan, 2006). A 800,000 year record 594
of SST and ocean productivity from marine sediment core MD96-2077 situated under 595
the Agulhas Current of the subtropical gyre of the Indian Ocean suggests a northward 596
shift of the southern westerlies by up to 7° of latitude during cooler stages (Bard and 597
Rickaby, 2009). This supports the model results of a 7° equatorward shift of the 598
subtropical fronts resulting from a global cooling of 3°C (Williams and Bryan, 2006). 599
The inference of weakened southern westerlies induced by the weak LIG during 600
glacials based on our pollen and microcharcoal records implies that there might be 601
some decoupling between the strength and the latitudinal position of the southern 602
westerlies. During glacials, northerly positioned southern westerlies might still show 603
fluctuations in strength. 604
Secondly, a decline in SST might be attributed to less Agulhas leakage. Previous 605
studies have shown that the northward shift of the southern westerlies during glacials 606
nearly shuts off the Agulhas leakage (Bard and Rickaby, 2009; Peeters et al., 2004). 607
The initial results of geochemical provenance studies on clays at our Site U1479 608
indicate reduced Agulhas leakage during the last glacial cycle and enhanced Agulhas 609
leakage during warmer periods (Franzese et al., 2018). The reconstructions of ice 610
sheet, SST and sea ice from an Antarctic sediment core showed that the intensification 611
of Antarctic cooling resulted in the expansion of southern westerlies and the northward 612
migration of ocean fronts in the Southern Ocean, which likely restricted the warm 613
Agulhas leakage (McKay et al., 2012). In this case, the low SST might be associated 614
with less Agulhas leakage influenced by the northward shift and weakened southern 615
westerlies during weak LIG. This is supported by the relatively cool SST and very low 616
abundances of Agulhas leakage indicator foraminifera (e.g., Globigerina falconensis 617
and Globorotalia menardii) at ODP Site 1087 suggesting an absence or weak influence 618
of Agulhas leakage during the mPWP (Petrick et al., 2015). The high representation of 619
Podocarpaceae during glacials in combination with restricted Agulhas leakage refutes 620
the idea of abundant Podocarpaceae pollen transport by the Agulhas Current from 621
southeastern South Africa. More likely, therefore, is that abundant pollen of 622
Podocarpaceae originated from Afrotemperate forest in the YRZ. Although it is widely 623
accepted that the southward shift of the southern westerlies would enable more 624
Agulhas leakage (Biastoch et al., 2009), the modeling study of Durgadoo et al. (2013) 625
emphasized that increased Agulhas leakage corresponds with increased intensity of 626
the southern westerlies, which would concur with our "strong LIG" case shown in 627
Figure 8. 628
Thirdly, a decline in SST might mark the switch from a warm to a cold mode of SE 629
trade wind-induced upwelling along the southwest African coast. Grain size data and 630
alkenone-based SST from sediment cores MD96-2086/87 located off Lüderitz (off 631
Namibia, SW Africa) indicate that the past long-term SST variations are primarily 632
induced by strengthened SE trade winds through intensified coastal upwelling 633
(Pichevin et al., 2005). The latest model results indicate intensification of upwelling of 634
colder waters in the Benguela Upwelling region during the Pleistocene resulting in 635
strongly lowered SST compared to the Pliocene, which is not simulated by global 636
models with a relatively coarse geographical resolution (Jung et al., 2014; Haywood et 637
al., 2020, accepted; McClymont et al., 2020). Although the upwelling was still weak 638
during the middle Pliocene, several studies have shown evidence of an upwelling 639
maximum in the southern Benguela system until ca. 2.8 Ma, which later progressed 640
northwards to its modern position offshore Lüderitz (Diekmann et al., 2003; Petrick et 641
al., 2015, 2018; Rommerskirchen et al., 2011). Fossil mollusc records from the west 642
coast of southern Africa indicate the existence of cold upwelling offshore south of 32°S 643
in the early Pleistocene (Tankard and Rogers, 1978). Alkenone-derived SST records 644
from the Agulhas Basin to the northern Benguela system indicate different patterns of 645
SST since 5 Ma (Etourneau et al., 2009; Martínez-García et al., 2010; Petrick et al., 646
2015, 2018; Rommerskirchen et al., 2011; Rosell-Melé et al., 2014), suggesting 647
upwelling was controlled by different processes in the southern and northern Benguela 648
system. This is for instance supported by the absence of cold SST in the northern 649
Benguela system (ODP Sites1084, 1082 and 1081) during the glacials MIS M2 and 650
KM2 (Petrick et al., 2015). Multiproxy studies suggest more extensive upwelling in the 651
southern Benguela system during the mPWP (Petrick et al., 2015). The global cooling 652
with increased Antarctic glaciations promoting intermediate and bottom water 653
formation combined with intensified SE trade winds (intensified Hadley circulation) and 654
uplift of East Africa would have caused intensified upwelling offshore of southern Africa 655
(Etourneau et al., 2009; Jung et al., 2014; Marlow et al., 2000; Rommerskirchen et al., 656
2011; Rosell-Melé et al., 2014). In our "weak LIG" case, the weakened southern 657
westerlies combined with strong SE trade winds would cause intensified upwelling, 658
resulting in cold water conditions over our core site and less rainfall in the WRZ. 659
Whereas in the "strong LIG" case, the strong southern westerlies and weak SE trade 660
winds would cause weakened upwelling (Figure 8). 661
6 Conclusions
662
The development of vegetation and climate in southwestern South Africa during the 663
mid-Piacenzian have been documented in detail by pollen, microcharcoal and benthic 664
foraminifera oxygen isotope records from marine sediment cores of IODP Site U1479 665
retrieved from the Cape Basin offshore of South Africa covering the period from 3.337 666
to 2.875 Ma. 667
Pollen assemblages throughout the record are characterized by the family of 668
Restionaceae indicating a clear pollen source from fynbos vegetation during the 669
mPWP. Variations in the representation of Restionaceae, ericoid fynbos and 670
Afrotemperate forest show dominant precession cycles indicating influence by the 671
latitudinal insolation gradient (LIG) in response to precession forcing. The weak/strong 672
southern hemisphere winter gradient would weaken/strengthen the southern 673
westerlies and winter precipitation in the WRZ and YRZ as well as influence the relative 674
amounts between winter and summer rainfall in the YRZ. 675
The glacial events reflected by the benthic foraminifera oxygen isotope record 676
correspond well with cooler SE Atlantic sea surface temperatures (SST) off South 677
Africa and are consistent with the vegetation and hydroclimate variability deduced from 678
our pollen and microcharcoal records. The cooler SST inducing less rainfall in the 679
winter rainfall zone, were likely driven by interactions of both atmospheric and 680
oceanographic processes including Antarctic ice sheet expansion, less contribution of 681
the Agulhas leakage and/or intensified southern Benguela upwelling. 682
On the basis of our study and comparisons with published records offshore of 683
southwestern Africa, we propose that LIG forcing (precession) and SST forcing were 684
the main drivers of hydroclimate in southwestern South Africa during the mPWP. 685
During “weak LIG”, the weakened southern westerlies combined with cold SST result 686
in less rainfall in the WRZ, while during “strong LIG”, the strong southern westerlies 687
together with warm SST would bring more rainfall in the WRZ. 688
Acknowledgments
689
This study was financially supported by the International Ocean Discovery Program, 690
IODP (SPP527) of the Deutsche Forschungsgemeinschaft (DFG), grant Nr. DU221/7. 691
Thibaut Caley is supported by CNRS-INSU. Funding from IODP France and LEFE 692
IMAGO CNRS INSU project SeaSalt are acknowledged. We thank the Captain, officers, 693
crew and especially all scientists sailing on IODP expedition 361. Thanks to Jutta 694
Scheffing for assistance with the pollen sample preparations in the lab. We would like 695
to thank the two reviewers for their helpful and constructive comments that have helped 696
to improve the manuscript. 697
References
698
Bard, E., Rickaby, R.E., 2009. Migration of the subtropical front as a modulator of glacial
699
climate. Nature 460, 380-383, https://doi.org/10.1038/nature08189.
700
Bergh, N.G., Verboom, G., Rouget, M., Cowling, R.M., 2014. Vegetation types of the greater
701
cape floristic region, in: Allsopp, N., Colville, J.F., Verboom, G.A. (Eds.), Fynbos:
702
Ecology, evolution, and conservation of a megadiverse region. Oxford University Press.
703
https://doi.org/10.1093/acprof:oso/9780199679584.003.0001.
Biastoch, A., Böning, C.W., Schwarzkopf, F.U., Lutjeharms, J., 2009. Increase in Agulhas
705
leakage due to poleward shift of Southern Hemisphere westerlies. Nature 462,
495-706
498, https://doi.org/10.1038/nature08519.
707
Bond, W., 1996. Fire, in: Cowling, R., Richardson, D., Pierce, S. (Eds.), The vegetation of
708
southern Africa. Cambridge University Press: Cambridge, pp. 421-446.
709
Bonnefille, R., Riollet, G., 1980. Pollen des savanes d'Afrique orientale. Éditions du Centre
710
national de la recherche scientifique, Paris.
711
Bosmans, J., Drijfhout, S., Tuenter, E., Hilgen, F., Lourens, L.J., Rohling, E., 2015. Precession
712
and obliquity forcing of the freshwater budget over the Mediterranean. Quaternary
713
Science Reviews 123, 16-30, http://dx.doi.org/10.1016/j.quascirev.2015.06.008.
714
Burls, N.J., Fedorov, A.V., 2017. Wetter subtropics in a warmer world: Contrasting past and
715
future hydrological cycles. Proceedings of the National Academy of Sciences 114,
716
12888-12893, https://doi.org/10.1073/pnas.1703421114.
717
Carr, A.S., Boom, A., Grimes, H.L., Chase, B.M., Meadows, M.E., Harris, A., 2014. Leaf wax
718
n-alkane distributions in arid zone South African flora: Environmental controls,
719
chemotaxonomy and palaeoecological implications. Organic Geochemistry 67, 72-84,
720
https://doi.org/10.1016/j.orggeochem.2013.12.004.
721
Chase, B.M., Meadows, M.E., 2007. Late Quaternary dynamics of southern Africa's winter
722
rainfall zone. Earth-Science Reviews 84, 103-138,
723
https://doi.org/10.1016/j.earscirev.2007.06.002.
724
Clark, R.L., 1982. Point count estimation of charcoal in pollen preparations and thin sections
725
of sediments. Pollen et spores 24, 23-35.
726
Cowling, R.M., Richardson, D.M., Pierce, S.M., 1997. Vegetation of southern Africa.
727
Cambridge University Press, Cambridge.
728
Crowley, T.J., 1996. Pliocene climates: the nature of the problem. Marine Micropaleontology
729
27, 3-12, https://doi.org/10.1016/0377-8398(95)00049-6.
730
Daniau, A.-L., Sánchez Goñi, M.F., Martinez, P., Urrego, D.H., Bout-Roumazeilles, V., Desprat,
731
S., Marlon, J.R., 2013. Orbital-scale climate forcing of grassland burning in southern
Africa. Proceedings of the National Academy of Sciences 110, 5069-5073,
733
https://doi.org/10.1073/pnas.1214292110.
734
Davis, B.A.S., Brewer, S., 2009. Orbital forcing and role of the latitudinal insolation/temperature
735
gradient. Climate Dynamics 32, 143-165, https://doi.org/10.1007/s00382-008-0480-9.
736
De Schepper, S., Head, M.J., Groeneveld, J., 2009. North Atlantic Current variability through
737
marine isotope stage M2 (circa 3.3 Ma) during the mid-Pliocene. Paleoceanography 24,
738
https://doi.org/10.1029/2008pa001725.
739
Diekmann, B., Fälker, M., Kuhn, G., 2003. Environmental history of the south-eastern South
740
Atlantic since the Middle Miocene: evidence from the sedimentological records of ODP
741
Sites 1088 and 1092. Sedimentology 50, 511-529,
https://doi.org/10.1046/j.1365-742
3091.2003.00562.x.
743
Dolan, A.M., Haywood, A.M., Hill, D.J., Dowsett, H.J., Hunter, S.J., Lunt, D.J., Pickering, S.J.,
744
2011. Sensitivity of Pliocene ice sheets to orbital forcing. Palaeogeography,
745
Palaeoclimatology, Palaeoecology 309, 98-110,
746
https://doi.org/10.1016/j.palaeo.2011.03.030.
747
Dowsett, H.J., Cronin, T.M., Poore, R.Z., Thompson, R.S., Whatley, R.C., Wood, A.M., 1992.
748
Micropaleontological Evidence for Increased Meridional Heat Transport in the North
749
Atlantic Ocean During the Pliocene. Science 258, 1133-1135.
750
https://doi.org/10.1126/science.258.5085.1133.
751
Dupont, L.M., 2006. Late Pliocene vegetation and climate in Namibia (southern Africa) derived
752
from palynology of ODP Site 1082. Geochemistry, Geophysics, Geosystems 7,
753
https://doi.org/10.1029/2005gc001208.
754
Dupont, L.M., Linder, H.P., Rommerskirchen, F., Schefuß, E., 2011. Climate‐driven rampant
755
speciation of the Cape flora. Journal of Biogeography 38, 1059-1068,
756
https://doi.org/10.1111/j.1365-2699.2011.02476.x.
757
Durgadoo, J.V., Loveday, B.R., Reason, C.J., Penven, P., Biastoch, A., 2013. Agulhas leakage
758
predominantly responds to the Southern Hemisphere westerlies. Journal of Physical
759
Oceanography 43, 2113-2131, https://doi.org/10.1175/JPO-D-13-047.1.