HAL Id: hal-00301753
https://hal.archives-ouvertes.fr/hal-00301753
Submitted on 7 Sep 2005HAL is a multi-disciplinary open access
archive for the deposit and dissemination of sci-entific research documents, whether they are pub-lished or not. The documents may come from teaching and research institutions in France or abroad, or from public or private research centers.
L’archive ouverte pluridisciplinaire HAL, est destinée au dépôt et à la diffusion de documents scientifiques de niveau recherche, publiés ou non, émanant des établissements d’enseignement et de recherche français ou étrangers, des laboratoires publics ou privés.
Size distribution and hygroscopic properties of aerosol
particles from dry-season biomass burning in Amazonia
J. Rissler, A. Vestin, E. Swietlicki, G. Fisch, J. Zhou, P. Artaxo, M. O.
Andreae
To cite this version:
J. Rissler, A. Vestin, E. Swietlicki, G. Fisch, J. Zhou, et al.. Size distribution and hygroscopic properties of aerosol particles from dry-season biomass burning in Amazonia. Atmospheric Chemistry and Physics Discussions, European Geosciences Union, 2005, 5 (5), pp.8149-8207. �hal-00301753�
ACPD
5, 8149–8207, 2005 Physical properties of Amazonian biomass burning aerosol J. Rissler et al. Title Page Abstract Introduction Conclusions References Tables Figures J I J I Back CloseFull Screen / Esc
Print Version
Interactive Discussion
EGU
Atmos. Chem. Phys. Discuss., 5, 8149–8207, 2005 www.atmos-chem-phys.org/acpd/5/8149/
SRef-ID: 1680-7375/acpd/2005-5-8149 European Geosciences Union
Atmospheric Chemistry and Physics Discussions
Size distribution and hygroscopic
properties of aerosol particles from
dry-season biomass burning in Amazonia
J. Rissler1, A. Vestin1, E. Swietlicki1, G. Fisch2, J. Zhou1, P. Artaxo3, andM. O. Andreae4 1
Div. of Nuclear Physics, Lund University, P.O. Box 118, SE-221 00 Lund, Sweden
2
Centro T ´ecnico Aeroespacial (CTA/IAE), Prac¸a Marechal Eduardo Gomes, 50, 12228-904, S ˜ao Jos ´e dos Campos, Brazil
3
Institute of Physics, University of Sao Paulo, Rua do Matao, Travessa R, 187, CEP 05508-900, Sao Paulo, Brazil
4
Max Planck Institute for Chemistry, P.O. Box 3060, 55020 Mainz, Germany Received: 1 July 2005 – Accepted: 26 July 2005 – Published: 7 September 2005 Correspondence to: J. Rissler ([email protected])
ACPD
5, 8149–8207, 2005 Physical properties of Amazonian biomass burning aerosol J. Rissler et al. Title Page Abstract Introduction Conclusions References Tables Figures J I J I Back CloseFull Screen / Esc
Print Version
Interactive Discussion
EGU
Abstract
Aerosol particle number size distributions and hygroscopic properties were measured at a pasture site in the southwestern Amazon region (Rondonia). The measurements were performed 11 September–14 November 2002 as part of LBA-SMOCC (Large scale Biosphere atmosphere experiment in Amazonia – SMOke aerosols, Clouds, rain-5
fall and Climate), and cover the later part of the dry season (with heavy biomass burn-ing), a transition period, and the onset of the wet period.
Particle number size distributions were measured with a DMPS (Differential Mobil-ity Particle Sizer, 3–850 nm) and an APS (Aerodynamic Particle Sizer), extending the distributions up to 3.3 µm in diameter. An H-TDMA (Hygroscopic Tandem Di fferen-10
tial Mobility Analyzer) measured the hygroscopic diameter growth factors (Gf ) at 90% relative humidity (RH), for particles with dry diameters (dp) between 20–440 nm, and at several occasions RH scans (30–90% RH) were performed for 165 nm particles. These data provide the most extensive characterization of Amazonian biomass burning aerosol, with respect to particle number size distributions and hygroscopic properties, 15
presented until now. The evolution of the convective boundary layer over the course of the day causes a distinct diel variation in the aerosol physical properties, which was used to get information about the properties of the aerosol at higher altitudes.
The number size distributions averaged over the three time periods showed three modes; a nucleation mode with count median diameters (CMD) of ∼12 nm, an Aitken 20
mode (CMD= 61–92 nm) and an accumulation mode (CMD = 128–190 nm). The two larger modes were shifted towards larger CMD with increasing influence from biomass burning.
The hygroscopic growth at 90% RH revealed a somewhat external mixture with two groups of particles; here denoted nearly hydrophobic (Gf ∼1.09 for 100 nm particles) 25
and moderately hygroscopic (Gf ∼1.26). While the hygroscopic growth factors were surprisingly similar over the defined periods, the number fraction of particles belonging to each hygroscopic group varied more, with the dry period aerosol being more
domi-ACPD
5, 8149–8207, 2005 Physical properties of Amazonian biomass burning aerosol J. Rissler et al. Title Page Abstract Introduction Conclusions References Tables Figures J I J I Back CloseFull Screen / Esc
Print Version
Interactive Discussion
EGU
nated by nearly hydrophobic particles. As a result the total particle water uptake rose going into the cleaner period.
The fraction of moderately hygroscopic particles was consistently larger for particles in the accumulation mode compared to the Aitken mode for all periods. Scanning the H-TDMA over RH (30–90% RH) showed no deliquescence behavior. A parameterization 5
of both Gf (RH) and Gf(dp), is given.
1. Introduction
During the recent decade a great deal of effort has been devoted to establish the effects of aerosols on global, as well as regional climate. Aerosols particles affect the global radiation budget directly through back scattering or absorption of solar radiation (Kauf-10
man et al., 1998, 2002). They can also affect the radiation budget and the regional water cycle through inducing changes in the microphysical properties of clouds by act-ing as cloud droplet condensation nuclei (Kaufman et al., 2002; Lohmann and Feichter, 2005). This is often referred to as the indirect radiative effect of aerosols on climate and is today the largest uncertainty in predicting the future global climate (IPCC, 2001). 15
The direct scattering of solar radiation by aerosol particles may also induce changes in the vertical temperature profile, inducing changes in cloud properties and precipitation patterns (Koren et al., 2004; Procopio et al., 2004).
The Amazon basin contains a large portion of the world’s rainforests, and the area is for many reasons of special importance, for instance as a CO2 sink, supplier of air-20
cleansing OH-radicals (Crutzen and Andreae, 1990; Davidson and Artaxo, 2004), and of course as living space for numerous species. However, it is also an area where con-siderable deforestation occurs, with no sign of slowing down (Andreae et al., 2004b). Burning activities in South America constitute almost 30% of the world’s biomass burn-ing activities (Guyon et al., 2005). Vegetation fires in the tropics are one of the world’s 25
major sources of new particles, and if injected to the higher troposphere, the particles can be transported over long distances and affect large areas (Andreae et al., 2001).
ACPD
5, 8149–8207, 2005 Physical properties of Amazonian biomass burning aerosol J. Rissler et al. Title Page Abstract Introduction Conclusions References Tables Figures J I J I Back CloseFull Screen / Esc
Print Version
Interactive Discussion
EGU
Since the Amazon Basin normally has low background particle concentrations (Rissler et al., 2004; Zhou et al., 2002; Artaxo et al., 2002), the high particle concentrations induced by biomass burning (increasing by as much as ∼100 times during the heavy biomass burning period) together with the intensive hydrological cycle of the area, has a considerable effect on the cloud properties and possibly on the precipitation patterns 5
in Amazonia (Andreae et al., 2004a).
This study was part of LBA-SMOCC (Large Scale Biosphere Atmosphere Experi-ment in Amazonia – Smoke Aerosols, Clouds, Rainfall and Climate: Aerosols from Biomass Burning Perturb Global and Regional Climate). The LBA-SMOCC overall goal was to investigate the connection between the high concentrations of biomass burn-10
ing aerosol lowering the effective radius of the cloud droplets forming on this aerosol, and the climatic consequences of the resulting perturbations in cloud microphysics (Andreae et al., 2004a). Even though biomass burning, as a consequence of defor-estation, is a large source of new particles, there have only been few studies of the particles emissions in the region. The SMOCC campaign is, until now, the most ex-15
tensive experiment in Amazonia for the characterization of the physical and chemical properties of the biomass burning aerosol, in combination with large scale airborne cloud microphysics measurements.
In this paper, we focus on the measured number size distributions and hygroscopic properties – two essential properties when considering the direct and indirect effect 20
of aerosols on climate – measured at a ground based site in Rondonia, Brazil, during September–November 2002. This period covers part of the dry period, the transition period, as well as the onset of the wet period in Western Amazonia. The hygroscopic properties are important also when interpreting measurements at ambient RH. No previous studies covering both number size distributions and the hygroscopic growth 25
have yet been made in the area. From the ground base data, together with information about the vertical structure of the atmosphere (from radio sondes and flight vertical profile measurements) the aerosol properties of the residual layer were estimated. This provides information about how particles from biomass burning change as they age
ACPD
5, 8149–8207, 2005 Physical properties of Amazonian biomass burning aerosol J. Rissler et al. Title Page Abstract Introduction Conclusions References Tables Figures J I J I Back CloseFull Screen / Esc
Print Version
Interactive Discussion
EGU
in the atmosphere. The particles’ density was estimated from comparing the mass predicted from the number size distributions with independently obtained PM2.5(TEOM measurements). The size distributions as well as the hygroscopic growth data will later be used in a study predicting the CCN (Cloud Condensation Nuclei) concentrations.
This paper is a continuation of two previous studies covering the background aerosol 5
of the tropical rainforest (Rissler et al., 2004; Zhou et al., 2002), as well as an aged biomass-burning plume injected to a clean air mass with very few new particles sources (Rissler et al., 2004).
2. Experiment and data treatment
2.1. Description of the measurement campaign 10
The LBA-SMOCC ground site was located at the Fazenda Nossa Senhora Aparecida (FNS, 10◦4504400S, 62◦2102700W, 315 m a.s.l.) in the state of Rond ˆonia in southwest-ern Amazonia, Brazil. The land at the site is used as a cattle ranch and is a rather flat pasture, surrounded by a series of small hills (ridge heights 300–440 m) at distances of 3–4 km. The site was chosen since it can be considered to be representative of the 15
region in southwestern Amazonia with extensive biomass burning during the dry sea-son. More details about the sampling site are found in Andreae et al. (2002), Kirkman et al. (2002) and Trebs et al. (2004).
Measurements of aerosol particle size distributions and hygroscopic properties were conducted at this site from 11 September to 14 November 2002. In this part of the 20
Amazon, the rainy season normally arrives in the middle of October (Ferreira da Costa et al., 1998; Silva Dias et al., 2002) but it was somewhat delayed in 2002 due to a weak El Ni ˜no. Thus, the rainy period with low biomass burning activity, and subsequently also low aerosol particle levels, did not arrive until the beginning of November.
The SMOCC campaign was divided into three different meteorological periods; 25
ACPD
5, 8149–8207, 2005 Physical properties of Amazonian biomass burning aerosol J. Rissler et al. Title Page Abstract Introduction Conclusions References Tables Figures J I J I Back CloseFull Screen / Esc
Print Version
Interactive Discussion
EGU
– The dry period, 11 September–8 October 2002, a period with widespread heavy
biomass burning,
– The transition period, 9–30 October 2002, a period during which the intensity of
biomass burning was still high but started to decline, and finally
– The wet period, 31 October–14 November 2002, a relatively clean period in the
5
beginning of the wet season. Some pyrogenic aerosols and other pollutants are expected both from local sources as well as emissions transported into the region from upwind regions in the southern perimeter of the Amazon Basin, especially from the state of Mato Grosso.
2.2. Instrumentation 10
2.2.1. Experimental setup
The main instruments used for this study were a DMPS and an H-TDMA. Both in-struments were sampling from the same inlet located ∼5 m above ground. The inlet removed particles with equivalent aerodynamic diameters >10 µm. The DMPS and H-TDMA instruments were identical to those used in two previous studies in the Amazon 15
region (Rissler et al., 2004; Zhou et al., 2002). An APS (Aerodynamic Particle Sizer) was also used, sampling from the same inlet as the DMPS and the H-TMDA, as well as a TEOM (Patashnick and Rupprecht, 1991) sampling from a R&P PM2.5inlet. The TEOM was operating at a temperature of 50 degrees centigrade.
In order to study several processes that influences aerosol concentration and dy-20
namics, further measurements referred to in this article are local meteorological and vertical profiles, obtained from radio sondes launched several times per day at the site, as well as flight vertical profiles.
ACPD
5, 8149–8207, 2005 Physical properties of Amazonian biomass burning aerosol J. Rissler et al. Title Page Abstract Introduction Conclusions References Tables Figures J I J I Back CloseFull Screen / Esc
Print Version
Interactive Discussion
EGU
2.2.2. The DMPS
The DMPS consists of two Vienna type DMAs (Differential Mobility Analyzer; Winkl-mayr et al., 1991) operating in parallel. A UDMA (ultrafine DMA) measured in the diameter range 3 to 22 nm and a DMA from 22 to 850 nm, together covering a total of 38 mobility channels in equal steps of logarithmic diameter. Condensation par-5
ticle counters (TSI CPC 3025 and CPC 7610) were used to detect and count the mobility-classified particles exiting each DMA. The particle counters were calibrated with respect to counting efficiency versus particle diameter prior to the experiment. The number size distributions were measured at dry conditions (RH<10%), and the time required to measure one full number size distribution was 10 min.
10
The various flows were set each day using a separate volume flow meter (the flows were corrected to mass flow by taking into account the small pressure drop within the instrument). Interruptions in the DMPS data occurred only in connection with setting of flows, power failures, and filling of butanol in the CPC’s. The fraction of time during the SMOCC campaign (11 September to 14 November 2002) for which reliable DMPS 15
data exists is 91%.
The algorithm for inversion of the DMPS data calculates the DMPS kernel matrix and uses the inverse of this to convert the measured mobility distributions to particle number size distributions. Factors taken into account when calculating the matrix are: sampling line losses, bipolar charging probabilities, DMA transfer functions and CPC 20
counting efficiencies (Zhou, 2001). 2.2.3. The APS
An aerodynamic particle sizer (TSI APS 3310) was used to measure aerosol number size distributions (Baron and Willeke, 2001) in the aerodynamic diameter size range 1.2 to 3.3 µm. Since the sheath air supplied to the APS was dehydrated, the dry particle 25
size was measured. The APS was calibrated with respect to particle sizing prior to the experiment. Even though the effective size range of the APS is nominally 0.50 to
ACPD
5, 8149–8207, 2005 Physical properties of Amazonian biomass burning aerosol J. Rissler et al. Title Page Abstract Introduction Conclusions References Tables Figures J I J I Back CloseFull Screen / Esc
Print Version
Interactive Discussion
EGU
20 µm, a laboratory intercomparsion between the APS used in SMOCC and a newly calibrated APS 3321 showed that the counting efficiency was deficient outside the narrow size range 1.20 to 3.3 µm. The time resolution used was 10 min to match that of the DMPS system, and the data was stored by the same data acquisition system. 2.2.4. The H-TDMA
5
The hygroscopic properties were measured with a Hygroscopic Tandem Differential Mobility Analyser (H-TDMA) for dry particle sizes between 20 and 440 nm. The instru-ment consists mainly of two DMAs, a bipolar charger and humidifiers. In the first DMA, dry aerosol particles in a narrow quasi-monodisperse size interval are selected. The selected particles are humidified and led to a second DMA, where the new, humidified 10
particle size distribution is determined. Two CPCs (TSI CPC 7610) are used to count particles in the aerosol outlet flows of the DMAs. The aerosol and sheath flows enter-ing DMA-2 are humidified separately by passenter-ing through Gore-Tex®tubes submerged in temperature-controlled water baths. For more details, see Svenningsson (1997) and Zhou (2001).
15
Dry particles were selected and the particle diameter growth factor Gf (defined as the ratio between the humidified and dry particle diameter dwet/ddry) was measured when taken from a dry state (RH<15%) to a controlled state of humidity. During the campaign, the H-TDMA was set to operate in two modes; measuring the Gf at 90%
RH while scanning the selected dry diameter, or measuring the Gf of 165 nm particles
20
(dry diameter) scanning the RH between 30 and 90%. When running 90% scans, the time resolution scanning the entire size range was ∼30–45 min.
Parameters showing the H-TDMA status were logged continuously and used to as-sure the quality of the data. Requirements for valid scans are shown in Table 1. The parameters logged were; temperatures and RH (measured at 5 different locations in 25
the H-TDMA flow lines), flows, pressures, and particle concentrations. Moreover, the instrument flows were calibrated once every day with a separate volume flow meter,
ACPD
5, 8149–8207, 2005 Physical properties of Amazonian biomass burning aerosol J. Rissler et al. Title Page Abstract Introduction Conclusions References Tables Figures J I J I Back CloseFull Screen / Esc
Print Version
Interactive Discussion
EGU
and the performance of the instrument checked daily by measuring the hygroscopic growth of pure ammonium sulfate particles. The correct RH was established as de-scribed in Vestin (2005).
The scans deviating in RH from the nominal value (still within the criteria for quality assurance) were corrected to 90% RH, in order to facilitate a comparison between the 5
various SMOCC H-TDMA observations and with previous experiments. The correc-tions to nominal RH were carried out as described in Swietlicki et al. (2000).
A program based on the principles of Stolzenberg and McMurry (1988), was used to fit the peaks of the humidified aerosol distribution with normal distribution func-tions. Two peaks were needed to adequately describe the observed distributions for 10
the SMOCC data set. This means that the aerosol was somewhat externally mixed. The arithmetic mean diameter growth factor Gf, diameter growth dispersion factor, and aerosol number fraction were determined for each peak, and these output parameters were used in the further data evaluation.
When presenting H-TDMA data, apart from Gf the hygroscopic properties are often 15
described as the soluble particle volume fraction, ε (Massling et al., 2005; Svennings-son et al., 1994; Swietlicki et al., 1999). This approach has the advantage over Gf that only the hygroscopic properties due to soluble material of the particles (Raoult’s law) are considered, and excludes the Kelvin curvature effect. However, when calcu-lating ε from H-TMDA data without not knowing the real molecular weight or particle 20
density, ε must be calculated using a reference compound, in this study, ammonium sulfate (εAS). The presented εAS should not be viewed as the real soluble volume frac-tions of the aerosol particles, or as if only ammonium sulfate was responsible for the water uptake. The εAS should rather be interpreted representing the number of solu-ble ions or molecules that are present in the particles, determining their hygroscopic 25
ACPD
5, 8149–8207, 2005 Physical properties of Amazonian biomass burning aerosol J. Rissler et al. Title Page Abstract Introduction Conclusions References Tables Figures J I J I Back CloseFull Screen / Esc
Print Version
Interactive Discussion
EGU
of ammonium sulfate. The εAS is calculated from the measured growth factor as;
εAS = Gf
3− 1
GfAS3 − 1. (1)
Here, Gf is the measured diameter growth factor, GfAS is the growth factor of a fully soluble particle composed entirely of the same solute material, (here ammonium sul-fate), for at the same humidified size as the observed particle. This procedure was 5
designed to take into account the Kelvin curvature correction (Swietlicki et al., 1999; Rissler et al., 2004). GfAS was calculated, taking into account the non-ideal behav-ior of the model solution, using water activity data from Tang and Munkelwitz (1994). During the SMOCC campaign, the aerosol particles contained large mass fractions of water-soluble organic compounds (WSOC) that in general show less hygroscopic 10
growth than pure ammonium sulfate (Decesari, 2005; Fuzzi et al., 20051; Mircea et al., 2005; Svenningsson et al., 2005). As a consequence, the actual soluble volume frac-tions were likely to be larger than the εAS calculated here, and it is important to make a distinction between the two concepts. From the point of view of merely providing a description of the hygroscopic behavior and predicting CCN concentrations based on 15
H-TDMA data (Vestin et al., 20052), the discrepancy between ε and εAS is irrelevant, since the important quantity is the number of soluble ions or molecules that are present in the particle.
As an alternative to εAS, we here introduce the concept of κ, representing the number of soluble moles of ions or molecules per dry particle volume unit. This expression has 20
the advantage that the misinterpretations that the soluble material only consists of the model salt, or that the given soluble volume fraction contains all soluble material are
1
Fuzzi, S., Decesari, S., and Swietlicki, E.: Overview of the inorganic and organic compo-sition of size-segregated aerosol in Rondonia, Brazil, from the biomass burning period to the onset of the wet season, J. Geophys. Res., to be submitted, 2005.
2
Vestin, A., Rissler, J., Swietlicki, E., and Frank, G.: Cloud nucleating properties of aerosol from Amazonian deforestation fires, Atmos. Chem. Phys. Discuss., to be submitted, 2005.
ACPD
5, 8149–8207, 2005 Physical properties of Amazonian biomass burning aerosol J. Rissler et al. Title Page Abstract Introduction Conclusions References Tables Figures J I J I Back CloseFull Screen / Esc
Print Version
Interactive Discussion
EGU
avoided. κ can be calculated either from classical K ¨ohler theory (K ¨ohler, 1936) or from taking the non-ideal behavior into account (i.e., that the real number of soluble ions in a particles differs slightly from the number of soluble ions seen by the electrolyte) through using a model salt. If taking the non-ideal behavior of a model salt into account, using the same salt as when calculating the εAS, then κ=ε · υ · ρs/Ms. ρs is the density of 5
the model salt, υ the number of ions per molecule of the model salt, and Ms the salt molecular weight.
We observed an externally mixed aerosol with two groups of particles, having slightly different growth when humidified in the H-TDMA. The two groups were denoted the “nearly hydrophobic group” and the “moderately hygroscopic group” and were present 10
at the same time. The particles were assigned to each of these groups based on their
εAS. The upper limit of the nearly hydrophobic group (equivalent to the lower limit of the moderately hygroscopic group) was for 20–165 nm particles set to εAS=0.15, and for 265 and 440 nm particles to εAS=0.18. The limit for the 20–165 nm parti-cles (εAS=0.15) corresponds to Gf between 1.11–1.17, and for 265–440 nm particles 15
(εAS=0.18) to a Gf of 1.20. The span in Gf values corresponding to εAS=0.15 for 20– 165 nm particles is due to the Kelvin curvature effect. The classification limits of εAS were based on the observations and were set at values that optimized the capability to classify the particles. The classification agrees with that used for previous measure-ments in other part of the Amazon region (Rissler et al., 2004). In a few cases when 20
both hygroscopic groups were present, both groups in the humidified distributions were classified as belonging to the same hygroscopic group (if both groups had εAS<0.15).
This was the case in ∼4% of the H-TDMA observations for all but the smallest dry particle diameters (20 nm), where this classification ambiguity occurred in 15% of the cases.
25
2.3. Boundary layer structure
As will be described in the following sections, the aerosol particle number concentra-tions and hygroscopic properties measured at ground level showed strong and
consis-ACPD
5, 8149–8207, 2005 Physical properties of Amazonian biomass burning aerosol J. Rissler et al. Title Page Abstract Introduction Conclusions References Tables Figures J I J I Back CloseFull Screen / Esc
Print Version
Interactive Discussion
EGU
tent diel variations. This behavior is linked to the structure and dynamics of the lowest part of the troposphere (below ∼2 km), which adjusts to the daily variations in incoming solar radiation. An overview of the general meteorological conditions is given in Fuzzi et al. (2005)1.
During the night, the air is cooled from below as long-wave radiation escapes from 5
the ground. This causes a shallow stable layer to form, starting close to ground level in the late afternoon/early evening, reaching a height of ∼200 m around midnight, and slightly higher just before sunrise (Fig. 1). Overlying this nocturnal layer (NL), there is a residual layer (RL) – a remnant of the well-mixed convective boundary layer (CBL) from the previous day. Even though the RL is still somewhat turbulent during nighttime 10
due to windshear, it eventually becomes decoupled from the air aloft, since it normally is capped by a strong temperature inversion. This RL is sometimes referred to as the fossil layer.
As the sun rises (∼06:00 LT) over the pasture, the NL starts dissipating from below due to heating of the ground, and a new and shallow mixed layer starts to develop, 15
here denoted the convective boundary layer (CBL, Fig. 1). The average heights of the CBL during the period 18–30 September 2002 – when the most intense biomass burning activities took place – were: 403 m (08:00 LT), 1097 m (11:00 LT), 1609 m (14:00 LT), and 1685 m (17:00 LT). The average CBL heights for 15–29 October 2002 – during the transition period with less intense biomass burning – were: 465 m (08:00 LT), 20
1036 m (11:00 LT), 1343 m (14:00 LT), and 1322 m (17:00 LT). These CBL heights were estimated from rawinsonde data defining the CBL height as the altitude where the increase in potential temperature first reached a gradient higher than 2 K·km−1(Fisch, 20053). The highest CBL growth rates occur between 08:00 and 11:00 LT, as the NL has been completely eroded and the atmosphere is at neutral atmospheric conditions 25
and free to be mixed by the turbulence. Over the pasture site, the dry season CBL height is higher (by 300–600 m) than during the wet season, and also higher than over
3
Fisch, G.: Boundary layer characteristics at Fazenda Nossa Senhora Aparecida during the RACCI/SMOCC experiment, Atmos. Chem. Phys. Discuss., to be submitted, 2005.
ACPD
5, 8149–8207, 2005 Physical properties of Amazonian biomass burning aerosol J. Rissler et al. Title Page Abstract Introduction Conclusions References Tables Figures J I J I Back CloseFull Screen / Esc
Print Version
Interactive Discussion
EGU
the rain forest during both the dry and wet seasons (Fisch et al., 2004). This is due to the surface energy partition, since the sensible heat flux is a factor of ∼2 higher over the dry pasture. This is caused by the lower evapotranspiration for the dry pasture, which means that more energy will return to the lower atmosphere as sensible heat instead of latent heat flux.
5
Around noon, convection becomes strong enough to penetrate the top of the CBL, bringing air from the CBL into the overlying cloud convective layer (CCL). Biomass smoke is therefore dispersed to altitudes above the CBL height, but with concentrations that decrease with altitude within the CCL. Air that is detrained upward from the CBL is exchanged by hotter, drier and usually also cleaner air entrained from the CCL aloft 10
(Fig. 1). Shallow convection is normally stopped by the trade wind inversion (TWI) at altitudes between 3–4 km. In the afternoon, deep convection can penetrate further into the free troposphere (FT). As turbulence due to thermal convection (mainly) and windshear dies out close to sunset, the afternoon air exchange between the CBL and the CCL above decreases and eventually ceases.
15
As the CBL evolves in height during the morning hours, air from the RL is con-tinuously mixed down into the air from the eroding NL. It can be assumed that the proportion between the volumes of NL and RL air that is being mixed is determined by the height of the NL and the CBL. Knowing the proportion provides an opportunity to use the ground-level data to estimate the aerosol properties of the RL air, as will be 20
described in Sect. 3.4.
3. Results and discussion
The aerosol particle number size distributions and hygroscopic growth measurements are here presented for the three defined meteorological periods, respectively. The diel variation of these aerosol physical properties is used to estimate the corresponding 25
aerosol properties of the residual layer – overlying the nocturnal stable layer – using a simple air mass mixing model. A mass closure study comparing the aerosol
par-ACPD
5, 8149–8207, 2005 Physical properties of Amazonian biomass burning aerosol J. Rissler et al. Title Page Abstract Introduction Conclusions References Tables Figures J I J I Back CloseFull Screen / Esc
Print Version
Interactive Discussion
EGU
ticle mass derived from the DMPS and APS number size distributions with the mass measured with the TEOM PM2.5 is also presented, together with an estimation of the particles density.
3.1. Mass closure study
The combined aerosol particle number size distributions from the DMPS and the APS 5
covered the total size range 3–3300 nm, with a 10-min time resolution. The APS clas-sifies the particles according to their equivalent aerodynamic diameter dae while the DMPS according to their equivalent mobility diameter dme. The correction for the dif-ference between daeand dmewas made using the relation dae=dme·√ρdry, where ρdry is the density during the conditions of the measurement, in this case the dry particle 10
density. This relation holds for spherical and non-porous particles (then dmeequals the volume equivalent diameter) as assumed here. To give an estimate of the dry parti-cle mass below 2.5 µm (PM2.5), the dry particle number size distribution (3–2500) was converted into volume size distribution, integrated, and multiplied with a dry particle density. The size range between the DMPS and the APS (850–∼1200 nm) was lin-15
early interpolated. After taking half-hourly averages, these mass concentrations were compared to the PM2.5 mass measured by the TEOM instrument. Since the TEOM instrument heats the aerosol sample to 50◦C, the aerosol water can be assumed to be evaporated, and the measurement provides the dry particle mass. All three instru-ments operate at dry conditions and the mass closure study was valid for dehydrated 20
particles.
The DMPS-APS and TEOM mass concentrations were highly correlated (Fig. 2). Us-ing a dry density of 1.38 g·cm−3, the correlation coefficient (r2) was 0.96 and the slope 1.00 (regression of estimated versus measured PM2.5 mass with zero offset). The dry particle density was fitted to achieve the best agreement between the estimated and 25
measured PM2.5 mass. The same density was used converting equivalent aerody-namic diameter to mobility diameters. Separating the three meteorological periods, a trend with increasing densities was seen. The densities were estimated to 1.37 for the
ACPD
5, 8149–8207, 2005 Physical properties of Amazonian biomass burning aerosol J. Rissler et al. Title Page Abstract Introduction Conclusions References Tables Figures J I J I Back CloseFull Screen / Esc
Print Version
Interactive Discussion
EGU
dry period, and 1.66 for the transition period. The correlation coefficient was 0.96 and 0.84 for the two periods, respectively. During the wet period, even higher densities were needed for a closure. No value is presented here due to lower correlation coe ffi-cients, probably due to the low mass concentrations (average: 6.5 µg/m3) making the TEOM PM2.5data not as reliable as for higher concentrations. Furthermore, the data 5
set was not complete for the wet period.
Previous estimates of biomass burning particle densities are summarized in Reid et al. (2005). The only value found for tropical biomass burning particle density was 1.35±0.15 g·cm−3, given in Reid and Hobbs (1998), which is the average measured by an aircraft in fresh (<4 min old) plumes from 12 forest and 6 grass (pasture) fires during 10
the SCAR-B experiment in Amazonia, 1995.
The size range covered by the APS contributed only 5% to the PM2.5 mass. The conclusion was that most of the aerosol particle mass in the biomass burning aerosol was confined to the sub-micrometer particle size region. This was also seen by Reid and Hobbs (1998), and Artaxo et al. (1998, 2002).
15
The primary aerosol particles produced by combustion of biomass in flaming condi-tions at high temperatures can contain highly agglomerated structures (Rissler et al., 2005) consisting of soot (Posfai et al., 2003; Reid et al., 2005) and alkali salts. The agglomerates found in Rissler et al. (2005) could be described as having a specific fractal dimension (∼2.5). Once they are cooled down and humidified in the atmo-20
sphere, these structures collapse by condensation of organic compounds and water, and become more compact and near-spherical (Rissler et al., 2005; Weingartner et al., 1997). The apparently near-constant value of the dry particle density is an indication that the observed particles were already collapsed, since variability in the ambient rel-ative humidity would otherwise induce further variability in the mass closure. This was 25
not surprising, since Rissler et al. (2005) found that the particles started to collapse already below 50% RH.
ACPD
5, 8149–8207, 2005 Physical properties of Amazonian biomass burning aerosol J. Rissler et al. Title Page Abstract Introduction Conclusions References Tables Figures J I J I Back CloseFull Screen / Esc
Print Version
Interactive Discussion
EGU
3.2. Number size distribution
3.2.1. Comparison of meteorological periods and previous measurements
The average particle number concentrations (±1 standard deviation) measured with the DMPS for particles with diameters between 30–850 nm were 10 440±6570, 4810±2720 and 1280±820 cm−3 for the dry, transition and wet period respectively. 5
When including particles down to 3 nm in diameter, the corresponding concentrations were 11 440±6790, 5550±3170 and 2070±1790 cm−3. Hence, the average number concentration of nucleation mode particles (<30 nm diameter) was relatively high and about the same for all periods, around 800–1000 cm−3. For the ground-based DMPS size distributions nearly all spectra showed a bi- or trimodal behavior.
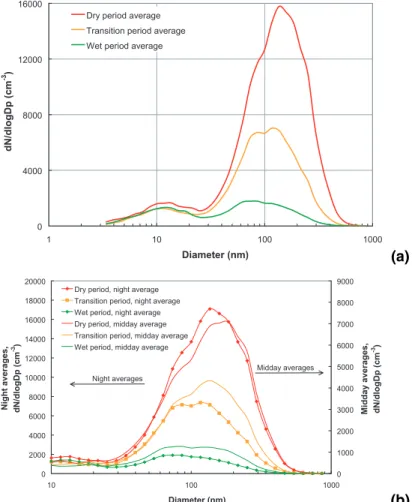
10
The average number size distributions for each of these three periods were fitted with three lognormal functions; a nucleation mode, an Aitken mode, and an accumulation mode. The average size distributions are shown in Fig. 3a, and the parameterisation of the average size distributions presented in Table 2. The Aitken and the accumula-tion mode had average geometric mean diameters around 61–92 nm and 128–190 nm 15
respectively, shifted towards the lower size range for the wet (clean) period.
For comparison, Rissler et al. (2004) observed average geometric mean diameters of 68 and 139 nm for the Aitken and the accumulation modes, respectively, for an air mass that had been affected by heavy biomass burning 2.5–5 days earlier, but after that had passed over a clean area with very few new particle sources. In the com-20
pilation by Reid et al. (2005) of the physical properties of biomass burning aerosol particles, the size distributions are described using unimodal lognormal fits. In plumes of fresh smoke from fires burning grass, savanna, cerrado and forest, count median diameters (CMD) between 0.1–0.13 µm are reported, and for South American regional biomass burning haze the CMD range between 0.12–0.23 µm. (The single CMD for 25
the SMOCC ground based measurements for the dry period was ∼135 nm.) During the SMOCC field experiment airborne measurements of particle size distributions (Guyon et al., 2005) showed geometric mean diameters of 110±15 nm in 69 plumes within the
ACPD
5, 8149–8207, 2005 Physical properties of Amazonian biomass burning aerosol J. Rissler et al. Title Page Abstract Introduction Conclusions References Tables Figures J I J I Back CloseFull Screen / Esc
Print Version
Interactive Discussion
EGU
boundary layer (BL) and 139±17 nm for 50 smoke plumes detrained above the BL, mostly from non-precipitating clouds.
The particle number concentrations observed during the relatively clean wet period were still more than a factor of 3 higher than the background concentrations measured at Balbina, a background site 125 km northeast of Manaus, Brazil (in LBA-CLAIRE-98, 5
Zhou et al., 2002, and in LBA-CLAIRE-2001, Rissler et al., 2004). In these two studies, the air masses classified as clean had passed over several hundreds of kilometers of pristine rainforest before reaching the site. The ground site for the SMOCC campaign – FNS – was located in an area of the Rond ˆonia state that also is influenced by human activities such as traffic, cooking and charcoal production. Furthermore, only the be-10
ginning of the wet period was studied during SMOCC, and some fires were still present regionally. Some pyrogenic aerosols and other pollutants must also be expected to have been transported into the region from upwind regions in the southern perimeter of the Amazon Basin.
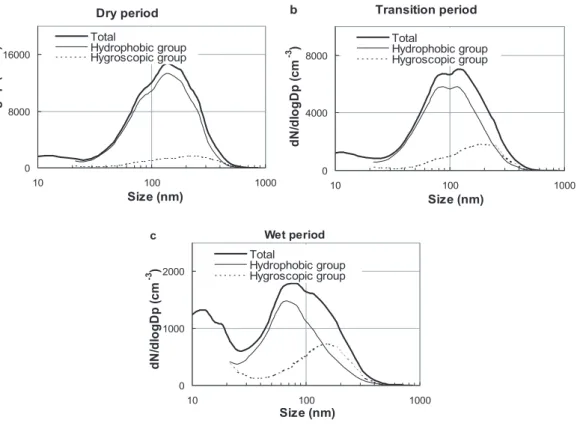
3.2.2. Diel variation 15
A strong diel pattern was seen in the particle number concentrations (Fig. 4). This was a result of the changing structure of the lowest troposphere and the timing of the fire activities over the course of the day. In Fig. 4, the averaged 24-h variation in particle concentrations for particles >30 nm is shown for each of the three SMOCC periods. The increase in particle concentrations from the lowest daytime concentrations to the 20
nighttime concentrations was a factor of 2.5, 1.9 and 1.8 for the dry, transition and wet periods respectively.
During nighttime, the average concentrations and number size distributions were fairly stable. Through the night a tendency with slightly decreasing particle concentra-tions was observed (Fig. 4) and for the most polluted period a slow and small increase 25
in diameter was discerned. Generally, no strong particles sources seem to be present, however, during some nights plumes from individual fires were observed.
ACPD
5, 8149–8207, 2005 Physical properties of Amazonian biomass burning aerosol J. Rissler et al. Title Page Abstract Introduction Conclusions References Tables Figures J I J I Back CloseFull Screen / Esc
Print Version
Interactive Discussion
EGU
size distributions. This is illustrated in Fig. 3b. Note that the nighttime and daytime dis-tributions are plotted using different axes. The midday number size distributions were averaged for the time period when the concentrations stabilized at the lowest concen-trations (∼10:00–13:00 LT). The average daytime CMD (for particles >30 nm) was 6%, 16% and 14% higher than the average nighttime values for the dry, transition and wet 5
periods, respectively. As will be described in Sect. 3.4, the CMD of the estimated night-time aerosol distributions of the residual layer were shifted by as much as 11%, 24% and 32% compared to the nighttime aerosol distributions of the nocturnal stable layer.
In addition to the lognormal fitting parameters of the average number size distribu-tions, Table 2 also describes the midday average distributions (∼10:00–13:00 LT) as 10
well as the afternoon/evening distributions (15:00–20:00 LT). The midday distributions are representative for the time of day when particle number concentrations reach their lowest values. The reason for the minimum is twofold. Firstly, during daytime the CBL develops so that the cleaner air in the RL layer has mixed with the more polluted air from the previous NL, thus reducing the number concentrations. Secondly, the peak 15
fire activity occurs in the middle to late afternoon (Prins et al., 1998) increasing the particle concentrations. The afternoon/evening distributions are representative for this peak fire activity.
A few days during the most heavily polluted period did not display the same diel pat-tern as most other days. During these days (21, 22 and partly 25 September) the day-20
time concentrations stayed high with average particles concentrations ∼20 000 cm−3 (>30 nm). This could be a sign of the convection being depressed due to the high particle concentration or cloudiness (Fuzzi et al., 20051).
3.2.3. Nucleation mode particles
During all three periods the grand average distributions had a geometric mean diameter 25
for the nucleation mode at 12 nm, with modal average number concentrations around 800–1000 cm−3(Table 2 and Fig. 3a).
ACPD
5, 8149–8207, 2005 Physical properties of Amazonian biomass burning aerosol J. Rissler et al. Title Page Abstract Introduction Conclusions References Tables Figures J I J I Back CloseFull Screen / Esc
Print Version
Interactive Discussion
EGU
clear diel variation (Fig. 5), it differed significantly from that of the larger particles (Fig. 4). The nucleation mode particles appeared strongly at about 06:00–07:00 LT, around sunrise. As the CBL developed, the particle counts were reduced and parti-cles were only sporadically present during daytime. Normally the nucleation partiparti-cles rapidly started to increase again around sunset at about the time when the NL started 5
to form. During the evenings and nighttime, nucleation mode particles were present in relatively high concentrations until around midnight.
This diel pattern is very similar to that seen previously in the wet-to-dry transition period at the clean background site near Balbina, (CLAIRE 2001, Rissler et al., 2004), despite the fact that these two sets of observations were made in distinctly different air 10
masses and levels of pollution. This behavior of the nucleation mode – which appears to be characteristic for various seasons and locations in the Amazon region – is also decisively different from that observed at most other continental sites (Kulmala et al., 2004). Observations of nucleation mode particles were made also during the campaign CLAIRE-98 (Zhou et al., 2002) at the Balbina site during the wet period 1998, using the 15
same DMPS system and data inversion procedure. However, these observations dif-fered from what was observed here and during CLAIRE 2001. In Zhou et al. (2002) the nucleation mode particles were larger, fewer and did not show the same diel pattern.
During SMOCC, the nucleation mode was present – if using the same criterion as in CLAIRE 2001 (Rissler et al., 2004), requiring particle concentrations >60 cm−3 for 20
particles with a diameter <30 nm – in 93%, 72% and 78% of the cases for the dry, transition and wet period respectively. The corresponding frequencies of occurrence during CLAIRE 2001 (Rissler et al., 2004) were around 70–80% and during CLAIRE-98 44%. However, the nucleation mode concentrations were considerably higher during SMOCC (∼800 cm−3) compared to during CLAIRE 2001 at the rain forest site in Balbina 25
(∼300 cm−3).
As observed previously in the Amazon region, particles in the very low size range (∼3–5 nm) were only sporadically present, and not as abundant as would be expected if nucleation took place at the site. However, the particles were not very much larger,
ACPD
5, 8149–8207, 2005 Physical properties of Amazonian biomass burning aerosol J. Rissler et al. Title Page Abstract Introduction Conclusions References Tables Figures J I J I Back CloseFull Screen / Esc
Print Version
Interactive Discussion
EGU
with main concentrations in the size range 10–15 nm.
In Zhou et al. (2002), a hypothesis was laid out that the nucleation mode particles formed at higher altitudes and were transported down to ground level by vertical mixing. This is not fully consistent with what was observed in the morning hours, since the nu-cleation mode appeared in the early morning hours when the depth of convection is still 5
very low, both in this study and in CLAIRE 2001. Neither could this mechanism explain the presence of the nucleation mode during the evening hours. Possibly the particles could occasionally be transported down if strong convection occurs, and caught in the NL as this develops. The mode was also occasionally present during rain events and when large cumulus passed the site, what could be consistent with the hypothesis of 10
Zhou et al. (2002) about particles transported down by downdrafts. The mechanism behind these various nucleation phenomena might be different.
The possibility that the mode was due to traffic on the road ∼800 m north east of the site could not be ruled out, but is not likely since the consistent diel pattern was found during CLAIRE 2001 at Balbina, a site not close to any large roads. Also the number 15
size distributions did not look like those expected from traffic. The nucleation mode particles found were smaller in size than generally observed from traffic. Furthermore, traffic does not solely produce nucleation particles but also larger particles, which were not observed (Kristensson et al., 2004). Neither did the chemical analysis show any large contribution from traffic (Fuzzi et al., 20051).
20
In Trebs et al. (2004) a diel pattern with a peak in total ammonium concentration around 08:00–09:00 LT was reported. This peak is not correlated with the peak in the nucleation mode particles and does most likely not have any connection to the observed nucleation events. Many questions remain about the mechanism behind the nucleation mode particles and the issue needs to be further investigated.
25
3.3. Hygroscopic behavior
The hygroscopic diameter growth was measured more or less continuously during the whole campaign, with short interruptions for calibration scans and setting of flows.
ACPD
5, 8149–8207, 2005 Physical properties of Amazonian biomass burning aerosol J. Rissler et al. Title Page Abstract Introduction Conclusions References Tables Figures J I J I Back CloseFull Screen / Esc
Print Version
Interactive Discussion
EGU
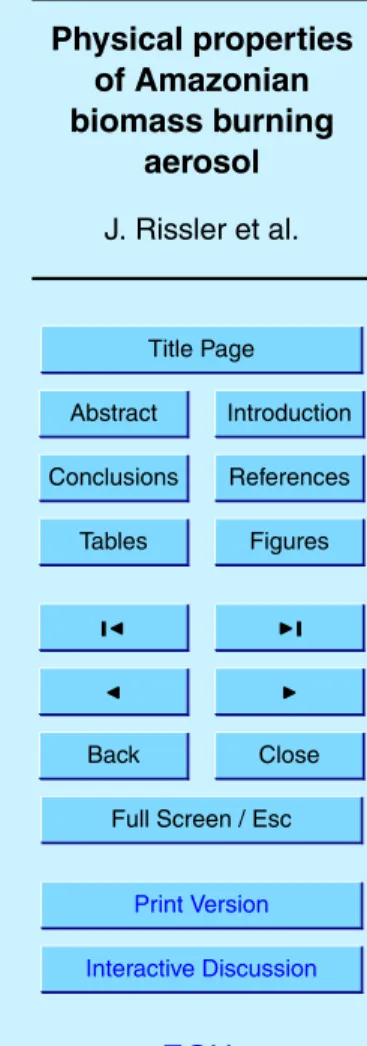
The aerosol particles were in most cases found to be externally mixed with respect to their hygroscopic properties, and hence also with regard to chemical composition (Table 3). As described in Sect. 2.2.4, the particles were classified into two groups, denoted nearly hydrophobic and moderately hygroscopic. From the hygroscopic di-ameter growth factors (Gf ) of each group, soluble volume fractions (εAS) as well as 5
number of moles soluble molecules or ions per dry particle volume (κ) were calculated using ammonium sulfate as reference compound (see Sect. 2.2.4).
The particle dry size selected by the H-TMDA closest to the CMD of the average size distributions was dp=110 nm. At 90% RH, the average Gf for these particles were 1.09 and 1.26 for each hygroscopic group, respectively. This corresponds to εAS≈0.08 and 10
εAS≈0.27. The Gf increased slightly as a function of particle dry size, with the excep-tion of the very smallest particles (<35 nm) of the moderately hygroscopic group (see Table 3). In general, the number fraction of the nearly hydrophobic group was larger for the Aitken mode particles (<100 nm in diameter) than for the larger accumulation mode particles (Fig. 6). The hygroscopic properties for each meteorological period are 15
summarized in Table 3.
3.3.1. Comparison between the meteorological time periods
The hygroscopic growth factors of both groups were surprisingly similar for each of the three periods, with a weak increase in growth of the moderately hygroscopic group when going from the heavily polluted period into the cleaner period. When compar-20
ing the three periods, the main difference in hygroscopic behavior was seen not in the growth factors, but in the number fraction of the two groups (Fig. 6). During the dry period, the aerosol was clearly dominated by particles belonging to the nearly hy-drophobic group. As the wet season approached the aerosol number fraction for the moderately hygroscopic group increased. As a result the average number of soluble 25
ions/molecules per particle (here including both hygroscopic groups) rises going into the cleaner period and consequently the total particle water uptake increases. During the wet period, the moderately hygroscopic particles dominated for aerosol particles
ACPD
5, 8149–8207, 2005 Physical properties of Amazonian biomass burning aerosol J. Rissler et al. Title Page Abstract Introduction Conclusions References Tables Figures J I J I Back CloseFull Screen / Esc
Print Version
Interactive Discussion
EGU >135 nm.
3.3.2. Diel variation
The averaged 24-h variations in the hygroscopic growth factor and the aerosol frac-tion displayed a diel pattern. In the morning hours, as the eroding NL started to mix with air from the RL, the fraction of moderately hygroscopic particles increased signif-5
icantly. The increase was most pronounced during the transition and the wet period. The diel pattern in the aerosol number fraction of the hygroscopic groups correlates rather well with the diel pattern in number concentration (Fig. 4). The variations in hy-groscopic growth factors over the course of the day were small, as was the variation growth factors comparing the three SMOCC periods. The diel fluctuations could only 10
be observed in the growth of particles belonging to the nearly hydrophobic group, and showed a maximum relative increase during daytime of (dGf/Gf ) ∼5%. Such small fluc-tuations were seen for all meteorological periods. In Table 3b the hygroscopic behavior observed during midday (∼10:00–13:00 LT) is presented.
3.3.3. RH scans
15
Occasionally during the SMOCC campaign, the H-TDMA was set to scan over RH in-stead of particle dry size. The RH was then varied from ∼30% up to ∼90%, for 165 nm particles. The RH scans were performed in order to study whether the hygroscopic properties observed at RH=90% can be used to deduce information also for interme-diate RH values. The water uptake as a function of RH is important for the radiative 20
transfer in the troposphere (aerosol direct radiative effect), aqueous phase chemistry, and phase partitioning of highly water-soluble gases such as HNO3. Also, the water uptake at lower humidities can be used in various corrections needed to evaluate data from aerosol samplers operating at humidified conditions.
The available RH scans were classified into five groups as being either dry period af-25
ACPD
5, 8149–8207, 2005 Physical properties of Amazonian biomass burning aerosol J. Rissler et al. Title Page Abstract Introduction Conclusions References Tables Figures J I J I Back CloseFull Screen / Esc
Print Version
Interactive Discussion
EGU
period midday scans (performed 24 and 26 September 2002 ∼09:00–14:00 LT), transi-tion period afternoon/night scans (performed 16 October 2002 ∼15:00-18:00 LT), tran-sition period midday scans (performed 11 September and 16 October 2002 ∼10:00– 14:00 LT) and wet period afternoon/night scans (14 November 2002 ∼21:00–24:00 LT). No RH scans were performed during midday for the wet period.
5
The RH scans did not display any obvious step-like deliquescent behavior (Fig. 7). Instead, all scans could be fitted with a continuous one-parameter function,
Gf = " 1+ A · RH/100 1 − RH/100 !#13 (2)
where A was the only fitted parameter needed to account for the observed growth as a function of RH (in %). The formula is based on classical K ¨ohler theory and is 10
derived and described in Kreidenweis et al. (2005), in a form originally using three fitted parameters. In K ¨ohler theory, more strictly, water activity (aw) should replace
RH in Eq. (2). However, for particles >100 nm, aw≈RH/100 (for 100 nm particles, this approximation leads to an overestimation of Gf of about 2%.), and accordingly this equation describes the growth due the Raoult’s term.
15
The parameterized Gf as well as the measured values are shown, for two of the peri-ods, in Fig. 7. Since the nearly hydrophobic and moderately hygroscopic groups could not be separated at RH<80%, both hygroscopic groups were added to provide one average growth factor for each H-TMDA scan. Plotted in Fig. 7 are also the average growths of the 90% scans, taken for the same period. The difference seen in hygro-20
scopic growth (as well as in A when comparing A for the 165 nm 90% scans in Tables 3 and 4) is due to the short time periods during which the RH scans were performed. The fitted A values for the RH scans are presented in Table 4. The values of A presented in Table 3 are more representative for the longer meteorological time periods, and we recommend that these values should be used to estimate typical hygroscopic growth 25
factors for each of the periods.
ACPD
5, 8149–8207, 2005 Physical properties of Amazonian biomass burning aerosol J. Rissler et al. Title Page Abstract Introduction Conclusions References Tables Figures J I J I Back CloseFull Screen / Esc
Print Version
Interactive Discussion
EGU
soluble ions or molecules per dry particle volume does not change with RH in the inter-val 30–90% for any of the five RH scan groups. The quality of the fits did not improve significantly when applying three fitted parameters, as in Kreidenweis et al. (2005) and Dick et al. (2000). Additional free parameters could otherwise be used to partly account for the behavior of non-ideal solutions (variable van’t Hoff factors or osmotic 5
coefficients) and limited solubility. A closer study shows a tendency for all five RH scan groups towards a decrease in the number of ions or molecules in solution at
RH<60%. Even if it was not obvious from the RH scans, it is possible that some
frac-tion of the water-soluble compounds only goes into solufrac-tion as RH goes above 60%. The available data preclude any definite conclusions to be drawn regarding any pos-10
sible non-ideal solution behavior or low solubilities. Nevertheless, Eq. (2) describes the Gf as a function of RH at down to 30% RH, within the errors introduced due to temporal variability.
The extrapolations up or down in water vapor saturation ratio basically assume that the H-TDMA-estimate of the number of soluble ions or molecules present in the par-15
ticles, derived from the observations at RH=90%, are also applicable to other RH. Since the RH scans could be reproduced by a stable number of ions in the inter-val 60–90%, this implies that the H-TDMA-estimate of the number of soluble ions or molecules present in the particles, derived from the observations at RH=90%, should also be applicable to other RH. For example, Vestin et al. (2005)2 successfully use 20
the SMOCC H-TDMA to extrapolate to RH>100% in order to predict critical super sat-urations, and CCN (cloud condensation nucleus) concentrations. When extrapolating the hygroscopic growth measured at 90% RH to lower RH, poorly soluble compounds such as K2SO4or WSOC compounds may cause an overestimation of the hygroscopic growth (Mircea et al., 2005), while the predicted critical supersaturation at droplet acti-25
vation might be overestimated. Furthermore, the non-ideal behavior of a solution can introduce minor deviations from Eq. (2). If replacing RH by aw (Raoult’s law) before doing the fitting, the parameter A could be related to the parameter κ introduced in Sect. 2.2.4 as A=κ · Mw/ρw, where Mw and ρware the molecular weight and density of
ACPD
5, 8149–8207, 2005 Physical properties of Amazonian biomass burning aerosol J. Rissler et al. Title Page Abstract Introduction Conclusions References Tables Figures J I J I Back CloseFull Screen / Esc
Print Version
Interactive Discussion
EGU
pure water. However, when calculating the κ presented in Table 3, we took into account the non-ideal behavior of a model salt (described in Sect. 2.2.4), resulting in a slightly different κ than if calculated using the above expression not using water activity data. 3.3.4. Parameterisation of H-TDMA data
In Table 3 we present a dimensionless parameter A, which together with Eq. (2) de-5
scribes the hygroscopic diameter growth as a function of RH. As mentioned previously, we recommend using the value of A presented in Table 3 to estimate Gf at various RH. To further facilitate the use of H-TDMA data, A can be parameterized as a function of particle dry size, dp, using the equation
A(dp)= log(dp) · B+ dp· C+ D (3)
10
where B, C and D are fitted parameters. The parameters are presented in Table 5. The parameterisation is valid for the size interval 35–440 nm. For the midday periods, the parameterisation slightly deviates from the measured value for the 35 nm particles. For sizes larger than 440 we recommend to use the A value for the 440 nm particles. Note that Eqs. (2) and (3) combines the hygroscopic growth of both the nearly hydropho-15
bic and the moderately hygroscopic particle groups as a number-weighted average for each dry particle size. The data in Table 3 can be used to derive similar parameteriza-tions also for each hygroscopic group separately, if needed.
3.3.5. Comparison to results from previous campaigns in Amazonia
The hygroscopic growth factors of the two defined groups were surprisingly similar to 20
those observed during previous campaigns at the clean Amazonian background site, Balbina, during the wet season (CLAIRE-98, Zhou et al., 2002) and the wet-to-dry transition period (CLAIRE-2001, Rissler et al., 2004). This was despite the fact that the air masses differed considerably in pollution level. However, as for the various SMOCC periods, a significant difference was seen in the number fraction attributed to 25
ACPD
5, 8149–8207, 2005 Physical properties of Amazonian biomass burning aerosol J. Rissler et al. Title Page Abstract Introduction Conclusions References Tables Figures J I J I Back CloseFull Screen / Esc
Print Version
Interactive Discussion
EGU
each hygroscopic group. For the previous measurements in the pristine rain forest, the moderately hygroscopic group dominated, as opposed to the nearly hydrophobic group for the polluted SMOCC periods. Similarity between the cloud droplet nucleation spectra, i.e. the hygroscopic behavior above the saturation threshold, of biogenic and pyrogenic aerosols in Amazonia has been documented by Andreae et al. (2004a). 5
3.4. Residual layer and vertical mixing
There are several issues motivating the calculations presented in this section regarding the properties of the RL aerosol. To begin with, the RL aerosol is more processed and aged compared to the aerosol at ground level during the afternoon hours (within the peak fire activities) and the evening and early night (with smoldering fires). An estimate 10
of the residual layer (RL) aerosol properties can therefore provide information regarding the locally produced fresh biomass burning aerosol in relation to that of the regional haze. Furthermore, it will give insight into the net effect of the aging processes that work on the biomass burning aerosol on the time scale of several hours to 1–3 days. It also serves as a test of consistency between the meteorological data (radio sondes) and 15
the ground-level observations regarding the structure of the lower troposphere (CBL, NL and the RL). Finally, it might provide information about the (upward) ventilation rate of the late afternoon CBL and the RL.
The diel pattern of the Aitken and accumulation mode particles – with respect to particle number concentrations, size distributions, and hygroscopic properties – can 20
be explained by the changing structure of the boundary layer over the course of the day (see Sect. 2.3 for a more detailed description of the development of the convective boundary layer (CBL), the nocturnal layer (NL) and the residual layer (RL)). As the NL is being eroded during the morning hours, the air from the NL will be mixed with the air of the old RL. Since the main fire activities and the more intense convection 25
(causing also entrainment of cleaner air from the free troposphere) do not appear until the middle of the afternoon, the time period between sunrise and noon can be used to obtain additional information about the properties of the RL aerosol on the basis of the
ACPD
5, 8149–8207, 2005 Physical properties of Amazonian biomass burning aerosol J. Rissler et al. Title Page Abstract Introduction Conclusions References Tables Figures J I J I Back CloseFull Screen / Esc
Print Version
Interactive Discussion
EGU
ground-based measurements only.
Rawinsonde data provide the height of the CBL at 08:00, 11:00, 14:00, and 17:00, local time (LT) for the dry and transition periods (given in Sect. 2.3). The calculations to derive the properties of the RL aerosol were made for 11:00 LT. At this time of day, we assume that the air is well mixed within the CBL, and that no fire activities disturb 5
the (averaged) ground-based observations. Furthermore, we also assume that the entrainment rate is still weak and can be neglected until this time (11:00 LT; Fig. 1).
The relation between the heights of the CBL at 11:00 LT and the NL determines the relative amounts of air contributed from the RL and the NL. The height of the CBL at 11:00 LT, hCBL(11), was 1097 m and 1036 m for the dry and transition period, 10
respectively, and the height of the NL, hNL, was estimated as 220 m from a simple model using radiative cooling (Fisch, 20053). The heights of the CBL and NL used here agreed well with those observed from aircraft during SMOCC (Guyon et al., 2005). The aerosol properties CRLof the RL (number concentration, size distribution, hygroscopic properties) can then be estimated from
15
CRL= CCBL(t)hCBL(t) − CNLhNL
hCBL(t) − hNL . (4)
Here, CNL and CCBL(11) are the corresponding aerosol properties of the NL and the CBL at 11:00 LT. The CNL was taken from the averaged DMPS and H-TDMA data for 02:00–06:00 LT (sunrise at ∼06:00 LT). The aerosol properties at 11:00 LT, CCBL(11), were taken to be the particle concentrations and size distributions averaged from the 20
DMPS measurements between 10:50–11:00 LT, while the hygroscopic properties were averaged for 10:00–12:00 LT. The longer time interval was chosen for the H-TDMA data to get better statistics.
As a test of the consistency of the assumptions made, the measured particle con-centrations of the CBL and NL, together with the estimated particle concon-centrations in 25
the RL (based on CBL height measurements at 11:00 LT) were used to estimate the development of the CBL height at 08:00 LT. This was made using Eq. (4) factoring
ACPD
5, 8149–8207, 2005 Physical properties of Amazonian biomass burning aerosol J. Rissler et al. Title Page Abstract Introduction Conclusions References Tables Figures J I J I Back CloseFull Screen / Esc
Print Version
Interactive Discussion
EGU
out hCBL(t). The estimated CBL height at 08:00 LT agrees within ∼100 m with those provided by the rawinsonde data. In the same way, the afternoon CBL heights could be estimated. However, since fire activities start in early afternoon for the dry and transition period, particle concentrations start to increase and Eq. (4) breaks down.
For the wet period, the particle concentrations decreased until ∼17:00 LT (Fig. 4). 5
This indicates that no strong sources were present during the afternoons and that our simple model could be used to estimate the CBL height also at 14:00 and 17:00 LT (sunset ∼18:00 LT). Unfortunately, no rawinsonde data was available for the SMOCC wet period. However, Fisch et al. (2004) provide typical values for the CBL heights in the fully established wet season (January–February 1999) measured at the same site 10
as for the SMOCC experiment. These CBL heights are considerably lower (94 m at 08:00 LT, 475 m at 11:00 LT, 775 m at 14:00 LT, and 927 m at 17:00 LT) than during the SMOCC dry season campaign. Since the “wet” period used in this work only captures the beginning of the actual wet period, we estimate the CBL heights during this period by taking the average of the CBL heights for the SMOCC transition period and the 1999 15
wet season. Using our simple model to predict the CBL height at 08:00 LT, 14:00 LT and 17:00 LT for the period resulted in CBL heights close to the values from the averaged rawinsonde data, typically within 100 m. If instead, using data from the wet season (Fisch et al., 2004) or that for the SMOCC transition period, it was not possible to predict reasonable CBL heights. This gives credibility to the estimation of the CBL 20
heights for the SMOCC wet period (31 October–14 November 2002) as an average of those for the SMOCC transition period and the 1999 wet season.
The estimated number size distributions of the RL layer as well as the NL are pre-sented in Fig. 8, for the dry and wet periods, respectively. The count median diameters of the RL average number size distributions are increased by 11%, 24% and 32% for 25
the dry, transition and wet periods respectively, compared with the NL night averages (here 02:00–06:00 LT). The size distributions of the RL were further divided into the nearly hydrophobic and moderately hygroscopic group. The group that differed most in concentrations between RL/NL was the dominating nearly hydrophobic group,
indi-ACPD
5, 8149–8207, 2005 Physical properties of Amazonian biomass burning aerosol J. Rissler et al. Title Page Abstract Introduction Conclusions References Tables Figures J I J I Back CloseFull Screen / Esc
Print Version
Interactive Discussion
EGU
cating that the sources at ground were producing nearly hydrophobic particles, while the particles in the RL had been processed and increased their hygroscopicity. The derived particle properties should only be taken qualitatively and the uncertainties are large.
3.5. Discussion 5
Downward-mixing of cleaner air from aloft is the most plausible explanation for the decreasing particle number concentrations at ground level during the morning hours. The concurrent shift in the size distribution towards larger sizes might partly be caused by photochemical production of condensable compounds that partition to the aerosol particles, but this fails to explain the observed concentration reduction. Furthermore, 10
the rapid change in the number fraction of the hygroscopic groups during the morning hours, and the fact that the CBL heights at 08:00 LT could be adequately reproduced using our simple model, are clear indications that the RL aerosol properties differ signif-icantly from those of the NL and that the size shift most plausible is because larger par-ticles from the RL were being mixed down. Similar diel variations were also observed 15
in both fine and coarse particle concentrations of PM and various aerosol inorganic and organic compounds (Fuzzi et al., 20051).
The diel pattern was seen for all three meteorological periods, indicating that signifi-cant sources of new particles at ground level were still present even during the period defined as the SMOCC wet (clean) period. At the beginning of November fires were 20
still reported in Rond ˆonia and in the nearby Mato Grosso state (Fuzzi et al., 20051). During two previous campaigns (Rissler et al., 2004; Zhou et al., 2002) carried out in the pristine Amazonian rainforest, no similar diel pattern was found. Instead, during a period under the influence of an aged biomass-burning plume (2–5 days previously injected into an area with very few new particle sources at ground level) during CLAIRE 25
2001, an inverted diel pattern was found, due to higher concentrations aloft as a result of long-range transport of biomass burning aerosol.