HAL Id: hal-00093586
https://hal.archives-ouvertes.fr/hal-00093586
Submitted on 13 Sep 2006
HAL is a multi-disciplinary open access
archive for the deposit and dissemination of
sci-entific research documents, whether they are
pub-lished or not. The documents may come from
teaching and research institutions in France or
abroad, or from public or private research centers.
L’archive ouverte pluridisciplinaire HAL, est
destinée au dépôt et à la diffusion de documents
scientifiques de niveau recherche, publiés ou non,
émanant des établissements d’enseignement et de
recherche français ou étrangers, des laboratoires
publics ou privés.
Development of a low-pressure diamond anvil cell and
analytical tools to monitor microbial activities in situ
under controlled P and T
Philippe Oger, Isabelle Daniel, Aude Picard
To cite this version:
Philippe Oger, Isabelle Daniel, Aude Picard. Development of a low-pressure diamond anvil cell and
analytical tools to monitor microbial activities in situ under controlled P and T. BBA - Biochimica
et Biophysica Acta, Elsevier, 2006, 1764, pp.434-442. �10.1016/j.bbapap.2005.11.009�. �hal-00093586�
BBA Proteins Proteomics 1764:434-442.
doi:10.1016/j.bbapap.2005.11.009
Development of a low-pressure diamond anvil cell
and analytical tools to monitor microbial activities in
situ under controlled P and T
Phil M. Oger, Isabelle Daniel and Aude Picard
Laboratoire de Science de la Terre, UMR 5570 CNRS-ENSL-UCBL, 46 allée d’Italie, F-69364 Lyon
Cedex 07, France
keywords : Diamond Anvil cell; GFP; yeast; high pressure; cell cycle;
metabolism; DMR; Agrobacterium
Corresponding author : Phil M. Oger,
Laboratoire de Sciences de la Terre, UMR 5570
CNRS-ENSL-UCBL, 46, allée d’Italie, F-69364 Lyon, France; tel: 33 4 72 72 87 92; fax : 33 72 72 86 77.
[email protected]
Abstract
We have designed a new low-pressure Diamond Anvil Cell (DAC), calibrated two novel
pressure calibrants and validated the use of semi-quantitative Raman and Xray spectroscopies
to monitor the fate of microbes, their metabolism or their cellular components under
controlled pressures and temperatures in the 0.1-1.4 GPa and 20°-300°C P,T range. The
low-pressure DAC has a 250-600 µm thick observation diamond window to allow for lower
detection limits and improved microscopic imaging. This new design allows the
determination of cellular growth parameters from automated image analysis, which can be
correlated with the spectroscopic data obtained on metabolism, ensuring high quality data
collection on microbial activity under pressure. The novel pressure sensors offer the ease of
use of the well-known ruby scale, while being more sensitive and reacting to pressure
variations instantaneously.
1. Introduction
Diverse, active microbial communities live deep beneath the Earth's surface, e.g., in water flowing through fractures in basalt [1] and granite [2], in the rock itself [3], or below the seafloor [4, 5]. Subsurface environments are characterized by the absence of light and oxygen, and extreme pressure and/or temperature conditions. Therefore, subsurface microorganisms must rely on alternate energy sources such as the dissimilative reduction of metals (DMR) and related molecules [6]. As a result of the increase of pressure and temperature with depth (ca. 35 MPa/km and 30°C/km respectively), the deep subsurface may extend to 4 km below ground or more
[7, 8]. Even though subsurface microbes are very diluted, with estimation ranging from 102 to 104,
owing to the large volume they colonize, they may represent a substantial portion of Earth's overall total biomass. Due to their pressure, temperature and chemical conditions, the deep-subsurface biotopes are hardly accessible by standard biological techniques. The deep-subsurface ecosystem can be partially reproduced by the use of high pressure/high temperature apparatus, such as autoclaves or cylinder-piston systems [9-11], Paris-Edinburgh presses [12], or optical high pressure cells based either on sapphire [13, 14] or on diamond anvils [15, 16]. However, since many of the deep-biosphere microorganisms do not grow under atmospheric
pressure, it is essential to be able to perform in situ kinetic studies.
Diamond anvil cells (DACs) are probably the most fitted pressure devices to monitor cellular metabolism under pressure, since they allow the simultaneous in situ observation of samples, while these may be probed using an incident radiation comprised between IR and energetic X-ray radiations. This is however achieved at a cost. The three major drawbacks of the method are : (i) the limited sample volume, ca. 100 nl, which precludes access to the sample after the experiment, (ii) the strong chromatic aberrations induced by the high refractive index of diamond which lead to blurry images and (iii) the impossibility to measure the pressure inside the DAC by direct methods such as manometers or pressure balances. The lack of correlation between spectroscopic data obtained in situ on microbial processes and microscopic observations of the cell and cell growth can greatly weaken the conclusions drawn from the metabolic studies, since it may be difficult to distinguish the activity of the enzyme, from the activity of the microbe harboring it. Similarly, monitoring the activity of microbial cells requires that the pressure within the incubator be known accurately. Pressure is usually measured indirectly by use of a pressure calibrant such as ruby [17-19]. Unfortunately, it remains a challenge today to determine low pressures in the DAC in the 0.1 MPa - 2 GPa pressure domain for lack of appropriate calibrants.
The present review describes recent advances in the DAC technology to adapt it to the monitoring of microbial processes. First, we present a modified asymetrical DAC planned to improve imaging quality and signal collection. Second, we review the development of two novel low pressure calibrants designed to sense pressure in the 0.1-600 MPa pressure. Last, we validated the use of two quantitative spectroscopies for the monitoring of microbial cell activity in the DAC.
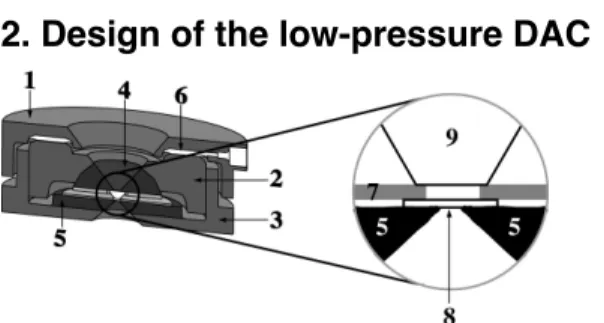
2. Design of the low-pressure DAC
Figure 1 : Schematic view of the low-pressure dedicated diamond anvil cell : (1) cover, (2) piston, (3) cylinder, (4) hemispheric carbide, (5) flat carbide, (6) Pressure-transmitting membrane, (7) sample gasket, (8) observation diamond window, (9) diamond anvil. The experimental volume is a cylinder consisting of the hole inside the sample gasket, and stoppered by the diamond window and anvil on each side.
Once closed, the DAC is 60 mm in diameter and 24 mm in height, and can be placed on the stage of most microscopes. The force acting on the piston is generated by inflating an internal membrane ram with helium (6, Figure 1) [20]. The whole DAC can be inserted in a Watlow® heating ring, which might heat
the whole pressure vessel up to 300°C +/- 1°C. The cell body (3, Figure 1), the piston (2, Figure 1) and the screw cap (1, Figure 1) are all machined in Marval 18 steel (Aubert et Duval, France), treated to full hardness by heating at 480°C for 4h. The piston is basically identical to that of the infrared cell, with an optical aperture of 2x38°, and a distance between the bottom of the diamond and the top of the assemblage of 10 mm. A diamond anvil (9, Figure 1) with a standard cut, a table of 4 mm, a height of 2.2 mm and a culet of 1.2-1.4 mm is sealed with a brass plate, and adjusted onto a hemispherical tungsten carbide seat (4, Figure 1).
The cell body is the modified part of the DAC; a diamond window 4 mm in diameter and 250-600 µm thick (8, Figure 1) replaces the 2 mm high anvil in the infrared cell. The diamond window lays on a flat tungsten carbide seat of 34 mm in diameter and 2.5 mm in height (5, Figure 1). The window is maintained centred onto the optical access hole drilled in the seat by a 600µm thick brass tore, which inner diameter is adjusted to the diamond window. The optical aperture of the cell body is 100°, and the working distance between the window and the outer of the DAC 6 mm. This is of course, the side of the DAC chosen for observations and measurements. All objectives with working distances longer than 6 mm can be used with the low-pressure DAC. The limited thickness of the diamond window together with the very large optical aperture and the short working distance, are characteristics of prime importance for improving the quality of observations and measurements, since they allow collecting more photons out of the diamond over a larger solid angle, through objectives or detectors of higher numerical apertures.
The sample container lies on the top of the diamond window, and is maintained by the same brass plate as the diamond window. It consists in a soft metal (Cu, Ni, or Inconel®) disk of 4 mm
diameter, 120-300 µm thickness, with a hole of 500 µm diameter, drilled at the centre. This defines an experimental volume of approximately ca. 0.1 µl. So far, the present DAC has reached 1.4 GPa.
3. Improved imaging in the
low-pressure DAC
Imaging live bacteria in the low-pressure DAC
To compare the quality of imaging in the new DAC versus the classical symetric design, we imaged the same bacterial cells in our low pressure
DAC equipped with a 400 µm thick diamond window, and in an Adams-type DAC [16] equipped with symetrical 2 mm thick diamond anvils. Microbial cells were imaged with an Olympus®
FV500 confocal epifluorescence microscope built on an Olympus® BX51WI inverted epifluorescence
microscope body equipped with two excitation lasers at 543 nm and 488 nm, two 100 W lamps for epi/trans illumination and a 110 W Mercury lamp for epifluorescence. An Olympus® SLMPlan X20 with a
working distance of 10 mm was used to focus inside the low-pressure DAC. A Mitutoyo® 50X
longworking distance objective (15mm) had to be used to focus inside a symmetric Adams type DAC [16]. The filter set for GFP imaging was an Olympus® U-MNIB2 cube with a 470-490 excitation filter, and a 515nm high band pass emission filter for classic epifluorescence and a 515-560 nm filter for confocal epifluorescence. A mid-log phase culture of
Escherishia coli strain DH5α(pGREEN-TIR) [21]
was used to load both DACs for imaging. These cells constitutively express the eGFP gene, thus, when excited at 488 nm, they emit a strong green fluorescence with a maximum of emission centred at 511 nm.
The spatial resolution in the symetrical DAC (Panel A, Figure 2) barely allows to see the E. coli cells as rods. Discriminating between putative bacterial cells and artefacts or impurities in the medium is therefore not straightforward. In addition, although the fluorescence of the E. coli cells can be detected in the symetrical DAC in the cell pellet, it is not possible to image single cells (Panel D). The
increased spatial resolution in the low pressure DAC is clearly visible in classical (B and E) or confocal (C and F) microscopies. In the same imaging conditions as panel A, the rod shape of the bacterial cells is clearly visible in transmission mode (panel B), and can be unambiguously distinguished from the impurities of the medium by their characteristic size and shape. Similarly, the fluorescence of the bacterial cells can be imaged at the single cell level with reasonable acquisition times : ca. 1 s in classic epifluorescence mode (Panel E), and less than 1 s in confocal mode (Panel F). The smallest bacterial cells in our lab collection, those of Bosea thiooxidans strain POLB980 (0.5µm X 2µm) can be readily imaged in the low-pressure DAC. Thus, the monitoring of the growth of eucaryotic or procaryotic microbial cells in the DAC through automated acquisition and analysis of microscopic images becomes realistic even for the smallest bacteria.
Monitoring cell growth in
the DAC
The baker’s yeast, S a c c h a r o m y c e s
cerevisiae, is one of the model systems used to
validate the use of the low-pressure DAC for monitoring of the microbial cell cycle in situ under high hydrostatic pressure. Saccharomyces cerevisiae is one of the best characterized unicellular eukaryote in terms of genome characterization and cellular physiology, and resistance to hydrostatic pressure [22-25]. The maximum pressure permissive to yeast cell growth is strain dependent, ranging from 15 to 50
Figure 2 : Microscopic observation of bacteria inside the DAC. Images were obtained in transmission mode (Top)
or in epifluorescence mode (Bottom) in a Adams-type DAC with 2mm thick diamond anvils (A, D) or in the low pressure dedicated DAC (B, C, E, F) in classical (A, B, D, E) or confocal (C, F) microscopy. Panel A :The blue arrow points towards a putative bacterial cell. The red arrow point towards an optical artefact.
MPa, while pressure above 200 MPa essentially kill the cells [26]. Ethanol fermentation from glucose is blocked at pressures higher than 50 MPa [27, 28].
Figure 3 : Yeast budding inside the DAC. Images inside the DAC were taken every minutes overnight. Four images separated by 20 minutes illustrate the ability of yeast to form buds inside the DAC. Three growing buds are pointed out by the three coloured arrows.
We used a strain of baker’s yeast from a commercial source. Yeast cells from an overnight mid-exponential culture in YPD (Yeast extract 1g/l, Peptone 2g/l, Glucose 2g/l) were diluted into fresh YPD medium to yield approximately 50-100 cells inside the DAC, and incubated at 30°C, the optimal growth temperature of our yeast strain. Figure 3 illustrates the ability of baker’s yeast’s cells to bud inside the low-pressure DAC. A picture of the DAC was acquired every minute thereafter in transmission mode by confocal microscopy. In these conditions yeast completes its cell cycle in 97 +/- 5 mn, which is comparable to the doubling time observed in the control cultures performed in tubes. Other cell parameters, such as the cell volume, cell integrity and shape as a function of pressure, can be determined from each image by automated image analysis [29] and comfort our metabolism data. Bacterial cell cycle monitoring in the DAC is also possible, but less prone to automating due to the cellular motility of most procaryotes in the DAC. Images have to be analyzed individually, corrected for cell movements before growth kinetics can be determined.
The resolution of the image makes the identification of the smallest bacterial cells, such as
Bosea thiooxidans (0.5 x 2 µm), and the use of image
sequences to determine the growth rate inside the DAC realistic. In the case of mobile bacteria such as
E. coli or Bosea thiooxidans, cell movements can also
be determined from sequence analysis of images taken every second. Importantly, we can distinguish
between the brownian-like movements and true cell motility exhibited by procaryotes in the DAC (for a review see [30]). The results obtained with three microbial models (yeast, E. coli and B o s e a
thiooxidans) have shown a strong divergence in the
response of these organisms to the confinement into the gasket of the DAC (V=78 nl, data not shown) : While yeast and B. thiooxidans can divide inside the DAC, E. coli seem incapable to grow or express a clear mobility phenotype.
4. Monitoring the microbial
metabolism in situ
Monitoring the metabolism of microbial cells in the DAC implies using quantitative or semi-quantitative spectroscopic techniques applicable to the quantification of diluted chemical species, usually the metabolite and its end products, in a complex mixture of other organic compounds, e.g. the growth medium. Although several spectroscopic techniques have been developped for the DAC, few have been tested in the physico-chemical conditions of a microbial culture environment. Two methods, based on the use of Raman and Xray spectroscopies, have been developped to allow a precise kinetic monitoring of the metabolic activity in the DAC.
Semi-quantitative Raman spectroscopy
Raman spectroscopy is a intrusive, non-destructive spectroscopy that does not require sample preparation. (Semi-) Quantitative Raman spectroscopy has a great potential to study microbial metabolism under pressure in the DAC, the only limitation for the technique being that the analyte need have a Raman spectrum with at least one peak unmasked by the Raman spectrum of the growth medium [31, 32]. Many metabolic input or end-products, such as H2S, CH4, lactate, formate, acetate,
methanol, ethanol, trioses, that are used as growth substrate or excreted as secondary metabolites by many bacteria or archaea in the sediment can be measured by Raman spectroscopy.
Quantitative Raman spectroscopy was developed to monitor the metabolism of glucose by yeast in the DAC. The same procedure can be applied for any other Raman active molecule. We used the symmetric C-C stretching mode (883 cm-1) of ethanol as a reference peak for ethanol because it is unmasked by the Raman spectrum of the growth medium. The 1643 cm-1 bending mode of water,
rather than the more intense 3250 cm-1 OH vibration zone, was used as our internal calibrant in order to keep the intensity of the peaks (analyte vs. standard) in the same range of intensity and the same zone of the Raman spectrum. In the DAC the detection limits of ethanol in the growth medium is ca. 0.05 mM.
Figure 4 : Ethanol production by Saccharomyces cerevisiae. Top : Raman spectrum of the culture medium inside the DAC at the start and after 24h incubation at 30°C and 25 MPa. The symmetric C-C stretching mode of ethanol at 883cm-1 is clearly
visible after 24 hours. Bottom : Kinetics of ethanol production by yeast at ambient pressure (AP) or 25 MPa. Data were normalized to the maximum production reached for each experiments.
Ethanol production is detected in situ in the DAC from ambient to ca. 50 MPa as early as t = 1 hour (Figure 4), and reaches a plateau after ca. 9 h, when all the glucose in the medium has been used. As expected, no ethanol production can be observed when the yeast cells are incubated above 50 MPa, or when no yeast cells are inoculated in the growth medium. Although the final concentrations are identical, our in situ observations clearly show that at 25 MPa, the fermentation of glucose is enhanced in yeast in comparison to controls at ambient pressure (Figure 4). This enhanced activity has already been reported in yeast for non-specific esterases [33], for the reduction of sulfate by sediment bacteria [34] and for several enzyme complexes [35]. Our in situ data for the fermentation of glucose by yeast are congruent with the current biochemical data, which validates the
use of quantitative Raman spectroscopy and the low-pressure DAC for the monitoring of microbial metabolism.
Quantitative X-ray spectroscopy
Many ecologically relevant microbial metabolisms cannot be investigated by IR or Raman spectroscopies in the DAC. This is for example the case for the dissimilative reduction of metals (DMR) which fuels the sediment and hydrothermal vents ecosystems. DMR leads to a change in valence of the metal used as an energy source. Therefore, ray-based element spectroscopies such as XANES ( X-ray Absorption Near Edge Structure) or EXAFS (Extended X-ray Absorption Fine Structure) which are sensitive to the redox environment of elements can potentially be used to monitor these reactions. However, X-rays cause severe damages to the cells, inducing mutations in the genetic material, free radicals in the cytoplams and holes in the cytoplasmic membranes, which eventually lead to the death of the irradiated cells. Thus, monitoring the reduction of metals by X-ray spectroscopy might kill the microbes under study.
Based on the hypotesis that X-ray-induced damages would be essentially limited to the irradiated volume, we estimated that there could exist a ratio between the size of the incubator and the size of the beam, that would lead to a low enough reduction of viability of the cells under study, while allowing to get meaningful X-ray data. To be able to monitor DMR in the DAC, we have minimized the size of the incident beam to 6 µm2. Therefore, less than 1% of the cells in the DAC are submitted to the incident X-ray beam. Under these experimental conditions, we observed a survival rate of more than 75% of cells in the irradiated incubator, while the same cell only survive a few seconds when totally irradiated (data not shown). The kinetics of selenite reduction by live prokaryotes was tentatively determined by a combination of µXANES and µXRF (X-ray fluorescence) to obtain the identification of the reduced Se species produced in solution. µXRF was performed at ESRF beamline ID22 (Grenoble, France) at 13.5 keV, using the Compound Refractive Lenses (CRL) lenses. The size of the beam was 2 µm x 3 µm (vert. x hor.), for an incident flux ca. 1-3 1010
ph/s. Fluorescence spectra were acquired for 100s live time, with less than 10% dead-time. The incident flux, used for normalization was measured using a Si photodiode placed before the sample. The µXANES spectra were acquired in fluorescence mode for 1s per point (101 points) in the range 12.64-12.69 keV, using the ID22 double Si111 crystals for monochromatization.
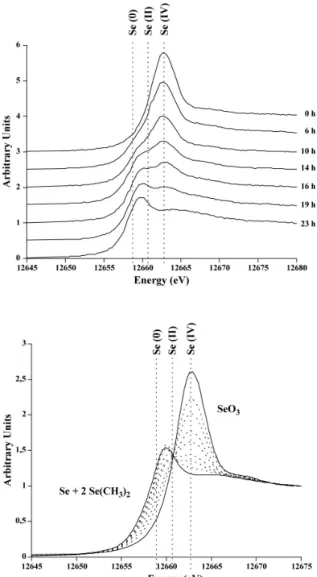
We monitored by a combination of µXANES and µXRF analyses [36] the reduction of Selenium by Agrobacterium tumefaciens strain C58, which reduces selenite (Na2SeO3, IV) and selenate
(Na2SeO4, VI) into elemental selenium (Se, 0) [37]
Figure 5 : Selenium metabolism by Agrobacterium
tumefaciens Selenium speciation was monitored
inside the pressured vessel by µXANES for 24h. (A) Reduction of selenite by A. tumefaciens at 25 MPa and 30°C in LB medium. (B) Calculated metabolism : Linear combination of µXANES spectra from standard solutions of Se species : selenite (SeO3, IV),
di-methyl selenide (Se-(CH3)2, II) and elemental
selenium (Se, 0). Starting composition : SeO3, 100% ;
Final composition : Se-(CH3)2, 66% and Se
(amorphous metal), 33%
The detection limit for selenium in the low-pressure DAC is ca. 1ppm. Figure 5 summarizes the results obtained for an experiment performed at 25 MPa with living A. tumefaciens cells incubated at 30°C in LB medium supplemented with 5 ppm selenite in the DAC. The spectrum obtained at 0 h is typical of selenite. Spectra acquired for intermediate incubation times clearly show a gradual replacement of selenium species in solution, with the apparition of a shoulder on the µXANES spectra. After 24 hours, the reduction is complete, and the µXANES spectrum no longer shows a contribution of selenite. Quantitative linear combinations of 7 different redox species of selenium demonstrate the contribution of only 3 selenium species to explain the experimental
data. During the reduction of selenite, 3 selenite molecules are reduced to one metallic selenium molecule and 2 dimethyl selenide (CH3-Se-CH3, II)
molecules. Despite the Xray-induced physical damage to the microbial cells, our results clearly demonstrate that our experimental design allows to monitor the fate of metal during DMR, including the identification of the end products of the reduction pathway, by the combination of µXANES and µXRF
in situ in the DAC on the synchrotron beamline under
controlled pressure and temperature.
5. Development of novel low pressure
calibrants
Pressure is usually determined in the DAC in
situ indirectly by an internal calibrant. The choice of
the calibrant is dictated by the experimental conditions required for the experiment. For example, in Physics and Earth sciences, the calibrants need to be effective in a large pressure and temperature domain. In biological and chemical sciences, the P and T domain remains more limited (-20°C to 200°C, 0.1 to 1 GPa), but the quickness to which the calibrant needs to react to pressure variations, as well as the precision of the measure are of prime importance. The most widely used optical pressure sensor in the DAC is the intense R1 fluorescence line of Cr3+ in ruby chips [17-19], even if there exist other calibrants such as quartz [39], Sm doped oxides [40], and chemical [41, 42] or protein-based sensors [43]. Unfortunately, ruby fluorescence is not suitable to work at low pressures with short-lived phenomena, because its relaxation time is too long (10-20 minutes). Furthermore, the precision of the measure at low pressure ranges between 50 to 100 MPa depending on the experimental setup [13, 44]. Last, the ruby chips do not sense pressures below 100 MPa. Thus it is reasonnable to avoid this calibrant for pressures below 250 MPa, a domain of the utmost importance when working with live micro organisms or their cellular components.
Therefore, one of the current challenges is to design more sensitive and reactive internal pressure calibrants to work in the DAC at very low pressures. As a first step towards that goal, we have developed two novel pressure sensors based on the use of small polystyrene microspheres, which contain a fluorescent dye inserted homogeneously into their matrix or based on the use of the GFP protein present intracelullarly in GFP-tagged cells.
FluoSpheres
®as a low
pressure calibrant
FluoSpheres® F-2111 are 15 µm-diameter fluorescent polystyrene microspheres (Molecular Probes™) with theoretical excitation and emission wavelengths at 515 and 534 nm, respectively. The insert in figure 6 displays a representative fluorescence spectrum of FluoSpheres® at ambient
point of the fluorescence spectrum, is used as a reference. It can be obtained from the first null value of the second derivative of the fluorescence spectrum. FluoSpheres® are manipulated in a similar way as ruby spheres [44].
Figure 6 : Pressure calibration curve of FluoSpheres® fluorescence shift. The pressure gauge is the inflection point of the first maximum of emission of the spectrum calculated by the second derivative method. Insert : fluorescence spectrum of the novel pressure calibrant.
The pressure-induced shift of the FluoSpheres® fluorescence has been measured up to 4
GPa [45]. The wavelength of the inflection point of the first peak increases linearly as a function of pressure from ambient to 2 GPa. The calculated shift is 9.93 ± 0.08 nm.GPa-1 up to 2 GPa (Figure 6).
Above 2 GPa, the fluorescence signal decreases significantly and is therefore no longer suitable for use as a pressure gauge. The pressure inside the DAC is calculated by the following relation :
P = (λ - λ0) * 0.10 (±0.001) GPa (1)
where P is the calculated pressure in GPa, and λ and λ0 are the wavelength of the inflection point at the
pressure of analysis and ambient pressure, expressed in nm.
FluoSpheres® offer several advantages over the classic ruby calibrants. 1) They are sensitive to very small variations in pressure. 2) They are at least 5 times more precise than ruby 20 MPa vs. 100 MPa respectively; 3) They can report pressures as low as 20-30 MPa. 3) The relaxation time of FluoSpheres® is short enough, so that the red shift of the fluorescence appears instantaneous. Thus, FluoSpheres® conjugate
the ease of use of the ruby microspheres, with several of the advantages of the protein-based pressure sensors, which should allow to accurately monitor the pressure in experiments with fragile materials, as
required for biological or biochemical systems, or in quickly evolving systems.
FluoSpheres® can be used as pressure gauges
in aqueous solutions as well as organic solutions such as Paraffin oil. Due to the embedding of the dye in the polystyrene matrix, pH has no influence on the fluorescence. FluoSpheres® are compatible with all
rich or minimal microbial growth media tested, and are therefore compatible for use in experiments involving the growth of micro organisms. FluoSpheres® are highly sensitive to temperature. Therefore one should envision their use only between 10° C and 50° C.
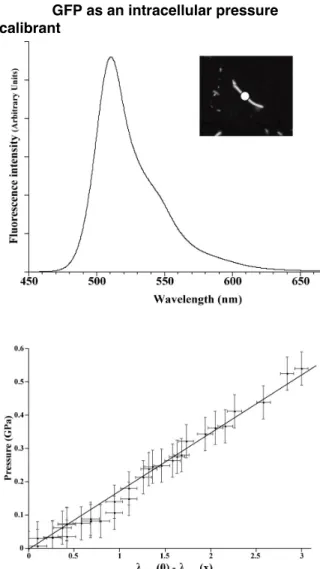
GFP as an intracellular pressure calibrant
Figure 7 : Calibration curve of the GFP pressure sensor. Top : Fluorescence spectrum of GFP acquired from a single E. coli cell (1 second acquisition time). The white disc on the photograph correspond to the zone of signal collection; Bottom: Calibration curve of the pressure sensor; Horizontal bars : standard error on the pressure determination; Vertical bars : standard error on λmax.
GFP (green fluorescent protein) is a spontaneously fluorescent protein isolated from
Aequoria victoria. GFP can be expressed in bacteria
widely used as a cellular tag for environmental studies. The protein is in the shape of a cylinder named β-can, consisting of 11 strands of β-sheet with an α-helix inside, which protect the fluorophore [49, 50]. GFP is quite thermostable [51], very resistant to chemical and pressure-induced denaturation [52-54].
The behavior of GFP under pressure meets with several of the basic requirements of a potential pressure calibrant. 1) the blue shift of its fluorescence spectrum is ca. 2.5 nm between 0 and 500 MPa (Figure 7). 2) The position of the fluorescence spectrum is not affected by focalisation. 3) GFP senses minute variations of pressure starting from very close to ambient pressure. 4) Pressure variations are immediately reported in the fluorescence spectrum. 5) The protein stability domain, which ranges up to at least 600 MPa [53, 54], exceeds the pressure domain that is used in experiences performed with most live microorganisms or their cellular enzymatic machinery.
What makes GFP a particularly interesting pressure sensor, is that it may be produced intracellularly by the microbial cells. Consequently, the pressure calibrant does not interfere with, and is not affected by, the composition of the pressure transmitting medium. GFP expression vectors come in different flavors for expression in bacteria [46], archaea [47], eucarya [48]. Therefore, GFP has a potentially wide range of application to determine pressure in biological systems. We have proved that the use of tagged cells is realistic in the novel DAC, to monitor the growth parameters, and especially to enumerate them (Figure 2). Furthermore, the fluorescence spectrum of GFP of a single E. coli cell can be readily acquired in the DAC (Figure 7, top), with a quality and intensity allowing the precise determination of the centroid or peak values for use as a pressure gauge. The pressure inside the GFP expressing cell can be determined from the shift of the centroid wavelength by the following relation :
P = 0,17 [λ0 - λ] (2)
where P is the pressure in GPa, and λ0 and λ
are the wavelength of the centroid at the reference and current pressure respectively.
This technique might prove very useful when working with samples that are very fragile, since it dramatically reduces the time and work needed to load the DAC. Providing calibration curves can be obtained with other GFP colour variants, one might generate a set of pressure calibrants usable with a wide range of spectroscopic methods, ranging from UV to IR.
6. Conclusions
We report here on a novel low pressure vessel derived from the classical Diamond Anvil Cell used in Physics and Earth Sciences. In this vessel, one anvil has been replaced by a thin diamond window. This vessel allows generating pressures up to at least 1.4 GPa under temperatures up to 300°C.
Due to its asymetrical design, the quality of microscopic imaging inside the DAC is greatly improved (Figure 2), making it possible to monitor the growth of the smallest microbial cells inside the DAC by confocal microscopy. Parameters such as cell volume and cell numbers can now be determined with accuracy for small cells such as bacteria. A set of novel low-pressure calibrants was developped for use in this DAC. These pressure calibrants can be used to measure pressures from the ambient to 600 MPa or 2 GPa. In contrast to the ruby scale, they report pressure variations instantaneoulsy, with a precision ca. 5 times more important than ruby (20 MPa vs. 100 MPa), which makes their use possible in fast evolving systems. We have validated the use of two different quantitative spectroscopies for the monitoring of microbial processes under pressure in the low pressure DAC. It is therefore now possible to correlate high quality imaging of the microbial cells and high quality spectroscopic data obtained on the same cells.
Acknowledgements
This work was supported by grants from The French Ministry of Research GEOMEX program to ID, and the Mission Ressources et Compétences Technologiques of the CNRS to PMO. AP is supported by a Ph.D. student fellowship from the MERT. We thank Hervé Cardon and Gilles Montagnac for expert technical assistance with high-pressure equipment and Raman spectroscopy.
Litterature Cited
[1] T.O. Stevens, J.P. McKinley, Lithoautotrophic microbial ecosystems in deep basalt aquifers, Science 270 (1995) 450-454.
[2] K. Pedersen, Microbial life in deep granitic rock, FEMS Microbiol. Rev. 20 (1997) 399-414.
[3] S. Lharidon, A.L. Reysenbach, P. Glenat, D. Prieur, C. Jeanthon, Hot Subterranean Biosphere in a Continental Oil-Reservoir, Nature 377 (1995) 223-224.
[4] J.F. Holden, M. Summit, J.A. Baross, Thermophilic and hyperthermophilic microorganisms in 3-30 degrees C hydrothermal fluids following a deep-sea volcanic eruption, FEMS Microbiol. Ecol. 25 (1998) 33-41. [5] M. Summit, J.A. Baross, Thermophilic subseafloor
microorganisms from the 1996 north Gorda Ridge eruption, Deep-Sea Res. 45 (1998) 2751-2766.
[6] J.F. Holden, M.W.W. Adams, Microbe-metal interactions in marine hydrothermal environments, Curr. Opin. Chem. Biol. 7 (2003) 160-165.
[7] W.C. Ghiorse, Subterranean life, Science 275 (1997) 789-790.
[8] I.H. Thorseth, K. Lysnes, R.B. Pedersen, T. Torsvik, Microbial communities in seafloor and subseafloor basalts, Geochim. Cosmochim. Acta 68 (2004) A402-A402.
[9] A.A. Yayanos, R. Vanboxtel, Coupling device for quick high-pressure connections to 100 MPa, Rev. Sci. Instrum. 53 (1982) 704-705.
[10] F.L. Palhano, H.L. Gomes, M.T.D. Orland, E. Kurtenbach, P.M.B. Fernandes, Pressure response in the yeast Saccharomyces cerevisiae: from cellular to molecular approaches, Cell Mol. Biol. 50 (2004) 447-457.
[11] A.A.R. Fernandes, J. Santamaria, S.L. Budko, O.
Nakamura, J. Guimpel, I.K. Schuller, Effect of physical and chemical pressure on the superconductivity of high-temperature oxide superconductors, Phys. Rev. B 44 (1991) 7601-7606.
[12] J.M. Besson, S. Klotz, G. Hamel, I. Makarenko, R.J. Nelmes, J.S. Loveday, R.M. Wilson, W.G. Marshall, High pressure neutron diffraction. Present and future possibilities using the Paris-Edinburgh cell, High Pressure Res. 14 (1995) 1-6.
[13] O. Grasset, Calibration of the R ruby fluorescence lines in the pressure range 0-1 GPa and the temperature range 250-300K, High Pressure Res. 21 (2001) 139-157.
[14] C.J. Gregg, F.P. Stein, C.K. Morgan, M. Radosz,
A variable volume optical pressure-volume-temperature cell for high-pressure cloud points, densities, and infrared spectra, applicable to supercritical-fluid solutions of polymers up to 2 Kbar, J. Chem. Eng. Data 39 (1994) 219-224.
[15] J.C. Chervin, B. Canny, J.M. Besson, P. Pruzan, A diamond-anvil cell for IR microspectroscopy, Rev. Sci. Instrum. 66 (1995) 2595-2598.
[16] D.M. Adams, S.J. Payne, K. Martin, Fluorescence
of diamond and Raman spectroscopy at high-pressures using a new design of diamond anvil cell, Appl. Spectrosc. 27 (1973) 377-381.
[17] H.K. Mao, J. Xu, P.M. Bell, Calibration of the ruby pressure gauge to 800-Kbar under quasi-hydrostatic conditions, J. Geophys. Res. 91 (1986) 4673-4676.
[18] G.J. Piermarini, S. Block, J.D. Barnett, R.A. Forman, Calibration of pressure-dependence of R1 ruby fluorescence line to 195 Kbar, J. Appl. Phys. 46 (1975) 2774-2780.
[19] J.D. Barnett, S. Block, G.J. Piermari, Optical fluorescence system for quantitative pressure measurement in Diamond-Anvil Cell, Rev. Sci. Instrum. 44 (1973) 1-9.
[20] R. Le Toullec, J.P. Pinceaux, P. Loubeyre, The membrane diamond anvil cell: a new device for generating continuous pressure and temperature variations, High Pressure Res. 1 (1988) 77-90.
[21] W.G. Miller, S.E. Lindow, An improved GFP
cloning cassette designed for prokaryotic transcriptional fusions, Gene 191 (1997) 149-153.
[22] A. Goffeau, B.G. Barrell, H. Bussey, R.W. Davis, B. Dujon, H. Feldmann, F. Galibert, J.D. Hoheisel, C. Jacq, M. Johnston, E.J. Louis, H.W. Mewes, Y. Murakami, P. Philippsen, H. Tettelin, S.G. Oliver, Life with 6000 genes, Science 274 (1996) 546-&.
[23] F. Abe, Piezophysiology of yeast: Occurrence and significance, Cell Mol. Biol. 50 (2004) 437-445. [24] P.M.B. Fernandes, T. Domitrovic, C.M. Kao, E.
Kurtenbach, Genomic expression pattern in Saccharomyces cerevisiae cells in response to high hydrostatic pressure, FEBS Lett. 556 (2004) 153-160.
[25] F.L. Palhano, M.T.D. Orlando, P.M.B. Fernandes,
Induction of baroresistance by hydrogen peroxide, ethanol and cold-shock in Saccharomyces cerevisiae, FEMS Microbiol. Lett. 233 (2004) 139-145.
[26] F. Abe, K. Horikoshi, Tryptophan permease gene
TAT2 confers high-pressure growth in Saccharomyces cerevisiae, Mol. Cell. Biol. 20 (2000) 8093-8102. [27] F. Abe, K. Horikoshi, Vacuolar acidification in
Saccharomyces cerevisiae induced by elevated hydrostatic pressure is transient and is mediated by vacuolar H+-ATPase, Extremophiles 1 (1997) 89-93. [28] F. Abe, K. Horikoshi, Analysis of intracellular pH
in the yeast Saccharomyces cerevisiae under elevated hydrostatic pressure: a study in baro- (piezo-) physiology, Extremophiles 2 (1998) 223-228.
[29] M.A.Z. Coelho, I. Belo, R. Pinheiro, A.L.
Amaral, M. Mota, J.A.P. Coutinho, E.C. Ferreira, Effect of hyperbaric stress on yeast morphology: study by automated image analysis, Appl. Microbiol. Biotechnol. 66 (2004) 318-324.
[30] M.D. Manson, Bacterial Motility and
Chemotaxis, Adv. Microbiol. Physiol. 33 (1992) 277-346.
[31] P.A. Aarnoutse, J.A. Westerhuis, Quantitative Raman reaction monitoring using the solvent as internal standard, Anal. Chem. 77 (2005) 1228-1236.
[32] M.J. Pelletier, Quantitative analysis using Raman spectrometry, Appl. Spectrosc. 57 (2003) 20A-42A. [33] F. Abe, Hydrostatic pressure enhances vital
s t a i n i n g w i t h c a r b o x y f l u o r e s c e i n o r carboxydichlorofluorescein in Saccharomyces cerevisiae: Efficient detection of labeled yeasts by flow cytometry, Appl. Environ. Microbiol. 64 (1998) 1139-1142.
[34] J. Kallmeyer, T.G. Ferdelman, K.H. Jansen, B.B.
Jorgensen, A high-pressure thermal gradient block for investigating microbial activity in multiple deep-sea samples, J. Microbiol. Meth. 55 (2003) 165-172.
[35] J.A. Torres, G. Velazquez, Commercial
opportunities and research challenges in the high pressure processing of foods, J. Food Eng. 67 (2005) 95-112.
[36] P.M. Oger, I. Daniel, B. Cournoyer, A.
Simionovici, In situ micro X-ray absorption near edge structure study of microbiologically reduced selenite (SeO3
2-), Spectrochim. Acta B 59 (2004) 1681-1686.
[37] C. Garbisu, T. Ishii, T. Leighton, Buchanan, Bacterial reduction of selenite to elemental selenium, Chem. Geol. 132 (1996) 199-204.
[38] C. Mougel, B. Cournoyer, X. Nesme, Novel
tellurite-amended media and specific chromosomal and Ti plasmid probes for direct analysis of soil populations of Agrobacterium biovars 1 and 2 (vol 67, pg 65, 2001), 67 (2001) 1404-1404.
[39] J.C. Chervin, C. Power, A. Polian, Quartz as a pressure sensor in the infrared, High Pressure Res. 25 (2005) 97-105.
[40] C. Sanchez-Valle, I. Daniel, B. Reynard, R. Abraham, C. Goutaudier, Optimization of Sm3+ fluorescence in Sm-doped yttrium aluminum garnet: Application to pressure calibration in diamond-anvil cell at high temperature, J. Appl. Phys. 92 (2002) 4349-4353.
[41] L. Comeford, E. Grunwald, Ultraviolet and
visible charge-transfer absorption and emission-spectra of some polar dyes in aqueous solution under high pressure, J. Phys. Chem. 94 (1990) 1105-1110.
[42] P.T.T. Wong, D.J. Moffat, A new internal
pressure calibrant for high pressure infrared spectroscopy of aqueous systems, Appl. Spectrosc. 43 (1989) 1279-1281.
[43] J.N. Sturgis, A. Gall, A. Ellervee, A. Freiberg, B. Robert, The effect of pressure on the bacteriochlorophyll a binding sites of the core antenna complex from Rhodospirillum rubrum, Biochemistry 37 (1998) 14875-14880.
[44] J.C. Chervin, B. Canny, M. Mancinelli, Ruby-spheres as pressure gauge for optically transparent high pressure cells, High Pressure Res. 21 (2002) 305-314. [45] A. Picard, P. Oger, I. Daniel, H. Cardon, G.
Montagnac, J.C. Chervin, A sensitive pressure sensor for diamond anvil cell experiments up to 2 GPa: FluoSpheres®, J. Appl. Phys. submitted (2005). [46] M. Chalfie, Y. Tu, G. Euskirchen, W.W. Ward,
D.C. Prasher, Green fluorescent protein as a marker for gene expression, Science 263 (1994) 802-805.
[47] C.J. Reuter, J.A. Maupin-Furlow, Analysis of proteasome-dependent proteolysis in Haloferax volcanii cells, using short-lived green fluorescent proteins, Appl. Environ. Microbiol. 70 (2004) 7530-7538.
[48] H.J. Cha, M.Q. Pham, G. Rao, W.E. Bentley, Expression of green fluorescent protein in insect larvae and its application for heterologous protein production, Biotechnol. Bioeng. 56 (1997) 239-247.
[49] M. Ormo, A.B. Cubitt, K. Kallio, L.A. Gross, R.Y. Tsien, S.J. Remington, Crystal structure of the Aequorea victoria green fluorescent protein, Science 273 (1996) 1392-1395.
[50] F. Yang, L.G. Moss, G.N. Phillips, The molecular
structure of green fluorescent protein,
Nature/Biotechnol. 14 (1996) 1246-1251.
[51] C.W. Cody, D.C. Prasher, W.M. Westler, F.G. Prendergast, W.W. Ward, Chemical structure of the hexapeptide chromophore of the Aequorea green-fluorescent protein, Biochemistry 32 (1993) 1212-1218.
[52] W.W. Ward, S.H. Bokman, Reversible
denaturation of Aequorea green fluorescent protein -Physical separation and characterization of the renatured protein, Biochemistry 21 (1982) 4535-4540. [53] M.A. Ehrmann, C.H. Scheyhing, R.F. Vogel, In
vitro stability and expression of green fluorescent protein under high pressure conditions, Lett. Appl. Microbiol. 32 (2001) 230-234.
[54] C.H. Scheyhing, F. Meersman, M.A. Ehrmann, K.
Heremans, R.F. Vogel, Temperature-pressure stability of green fluorescent protein: A Fourier transform infrared spectroscopy study, Biopolymers 65 (2002) 244-253.