HAL Id: hal-00316666
https://hal.archives-ouvertes.fr/hal-00316666
Submitted on 1 Jan 2000
HAL is a multi-disciplinary open access archive for the deposit and dissemination of sci-entific research documents, whether they are pub-lished or not. The documents may come from teaching and research institutions in France or abroad, or from public or private research centers.
L’archive ouverte pluridisciplinaire HAL, est destinée au dépôt et à la diffusion de documents scientifiques de niveau recherche, publiés ou non, émanant des établissements d’enseignement et de recherche français ou étrangers, des laboratoires publics ou privés.
Eurasian sector
A. V. Mikhailov, T. Yu. Leschinskaya, M. Förster
To cite this version:
A. V. Mikhailov, T. Yu. Leschinskaya, M. Förster. Morphology of NmF2 nighttime increases in the Eurasian sector. Annales Geophysicae, European Geosciences Union, 2000, 18 (6), pp.618-628. �hal-00316666�
Morphology of NmF2 nighttime increases in the Eurasian sector
A. V. Mikhailov1, T. Yu. Leschinskaya1, M. FoÈrster2,*1Institute of Terrestrial Magnetism, Ionosphere and Radio Wave Propagation, Troitsk, Moscow Region 142092, Russia
e-mail: [email protected]
2GeoForschungsZentrum, Projektbereich 2.3, Telegrafenberg, D-14473 Potsdam, Germany
Received: 13 December 1999 / Revised: 3 March 2000 / Accepted: 7 March 2000
Abstract. A statistical analysis of two peaks (pre-mid-night and post-mid(pre-mid-night) occurrence in NmF2 daily variations was made on a latitudinal chain of four ionosonde stations in the Eurasian longitudinal sector. Overall 6182 cases of the ®rst and 5600 cases of the second peak occurrence were analyzed using all avail-able foF2 observations for the years of solar maximum and minimum. Well-pronounced and systematic varia-tions with season and solar activity were revealed in the occurrence probability of the peaks, their amplitude and timing. The pattern of both peaks occurrence is similar during winter and equinoxes for midlatitude stations implying one and the same mechanism of their forma-tion. The pre-midnight summer peak shows speci®c variations in particular during solar maximum pointing to a dierent mechanism controlling its appearance. Possible mechanisms of both peaks formation are discussed.
Key words: Ionosphere (electric ®elds and currents; ionosphere±magnetosphere interactions; mid-latitude ionosphere)
1 Introduction
Nocturnal electron density increase is a well-known mid- and lower-latitude F2-layer eect which is ob-served both in NmF2 and TEC (Arendt and Soicher, 1964; Evans, 1965, 1974; Da Rosa and Smith, 1967; Titheridge, 1968, 1973; Bertin and Papet-Lepine, 1970; Young et al., 1970; Tyagi 1974; Davies et al., 1979; Jakowski et al., 1986, 1991; Balan and Rao, 1987; Lois
et al., 1990; Joshi and Iyer, 1990; Jakowski and FoÈrster, 1995). Although TEC and NmF2 variations generally are close to each other, some dierences in peak occurrence are stressed (Tyagi, 1974; Lois et al., 1990). Usually the ®rst (pre-midnight peak mainly in summer) and the second (post-midnight, mainly during winter and equinoctial periods) peak in TEC and NmF2 daily variations are discussed and analyzed. Both maxima occurrence in the post-sunset F2-region are also men-tioned (Balan and Rao, 1987; Lois et al., 1990; Jakowski et al., 1991;) and analyzed (e.g., Young et al., 1970; Rao et al., 1982; Joshi and Iyer, 1990). Unfortunately, the results of analysis are very controversial in various publications. Rao et al. (1982) made their analysis for some equatorial and mid-latitude stations in the Asian zone for solar maximum (1958) and solar minimum (1964) conditions. They found the amplitudes of both peaks to be larger at solar maximum while according to Tyagi (1974) and Titheridge (1973) the tendency is opposite. Dierent conclusions may be found on seasonal and solar cycle variations of the peaks timing. A statistical analysis of nighttime increases was made by Lois et al. (1990) and Jakowski et al. (1991) using observations over Havana-Cuba (L = 1.5) for the period of July 1974±December 1980. They con®rmed the eect to be a regular feature of the winter season during solar minimum. It is most pronounced and long-lasting around the December solstice. During solar maximum the nighttime increases become shorter in time, but their amplitude increases. This contradicts the results of Tyagi (1974) and Titheridge (1973), but agrees with Rao et al. (1982). An interesting result is that the seasonal pattern inverses during solar maximum and the occurrence probability of the eect maximizes in summer. This result contradicts other observations (e.g., Young et al., 1970). The amplitude of the eect strongly varies from night-to-night (e.g., Tyagi, 1974). Sometimes instead of an NmF2 increase a strong decrease may take place with a dierence in NmF2 up to factor of 8 for two neighboring quiet time nights (Mikhailov and FoÈrster, 1999). Such strong day-to-day variations are
compara-Correspondence to: A. V. Mikhailov
*Present address: Max-Planck-Institut fuÈr extraterrestrische Phy-sik, D-85740 Garching, Germany
ble with F2-layer storm eects during severe geomag-netic disturbances.
All previous morphological analyses of the eect were con®ned to particular stations or to a limited period of time. On one hand, as the nighttime NmF2 increases are related to plasmaspheric ¯uxes (Evans, 1965, 1975; FoÈrster and Jakowski, 1988; Jakowski et al., 1991; Jakowski and FoÈrster, 1995; Mikhailov and FoÈrster, 1999) and depend on the tube content, the eect should manifest a latitudinal dependence (e.g., Balan and Rao, 1987; Feichter and Leitinger, 1987). On the other hand, there are contradictions between dier-ent observations of this eect concerning its seasonal and solar cycle variations. This may be due to either real longitudinal dierences between the American (Lois et al., 1990; Jakowski et al., 1991) and the Asian (Rao et al., 1982) sectors or to the period analyzed, or may re¯ect dierences in the method of analysis used. Further, usually the previous studies made no separa-tions between quiet and disturbed periods. However, the nighttime peak formation is thought to be closely related to the thermospheric winds (Mikhailov and FoÈrster, 1999) which are known to change during disturbed periods. Therefore, a more complete morphological study of this eect is required using available foF2 observations for 3±4 solar cycles using only quiet time periods. The analysis is made on a chain of ionosonde stations in the Eurasian longitudinal sector where the eect was not considered earlier. The results of such morphological study will be useful in further physical analysis of the eect in question.
2 Method of data analysis
All available hourly foF2 observations for four iono-sonde stations: Alma-Ata (43.25N; 76.92E; L = 1.52), Kiev (54.30E; 30.30E; L = 2.11), Moscow (55.50N; 37.30E; L = 2.53), and St. Petersburg (59.95N; 30.70E; L = 3.18) were analyzed for the years of solar maxi-mum (1957±1959, 1968±1970, 1979±1981, 1989±1991) and solar minimum (1964, 1965, 1975, 1976, 1985, 1986). The selected years correspond to the periods around solar maxima and minima of the last four solar cycles. Alma-Ata has the same L-parameter as Havana-Cuba analyzed by Lois et al. (1990) and Jakowski et al. (1991). This will allow us to compare the American and Eurasian longitudinal sectors.
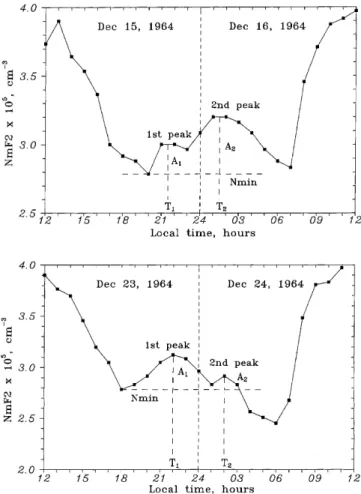
The presence of any of two peaks was checked in NmF2 daily variations for the years in question. Figure 1 gives examples of such two peaks speci®cation. The absolute minimum was searched in NmF2 values within the period after sunset to 02 LT, and this value was named Nmin. The amplitudes of both peaks, A1 and
A2 equal to Npeak/Nmin and the local time of their
occurrence were found for each case. These LT moments were designated T1 and T2. A plateau of 2±3 NmF2 hourly values was referred as a peak with its maximum in the middle of the plateau. Several maxima are possible after midnight. Therefore, the largest post-midnight maximum was found and it was treated as the
second peak. One-hour gaps in observed NmF2 varia-tions were ®lled in using neighboring observed values, days with two and more hourly gaps were omitted. To avoid the eects of solar illumination during summer nights only periods with solar zenith angle >95° at
midnight were considered. Only quiet days with Ap £ 12 were analyzed to exclude storm eects, although night-time NmF2 increases are frequent during storm periods. The results are presented both for 12 months of the year and in a combined form for three seasons: winter (November±February), summer (May±August), and equinox (March, April, September, October) for the periods of solar maximum and minimum.
3 Results
The total number of analyzed cases on each station is given in Table 1. Both peaks are seen to be observed about in half of all quiet days both at solar minimum and maximum, although the percentage of days with the nighttime increases is higher at solar minimum. An interesting result is that the occurrence of the ®rst peak is higher than the second one at solar minimum. The occurrence probability of the two peaks is about the same during solar maximum. For the 1st peak one should keep in mind that in many cases it is not a
Fig. 1. Two peaks and Nmin, T, A parameter speci®cations in the
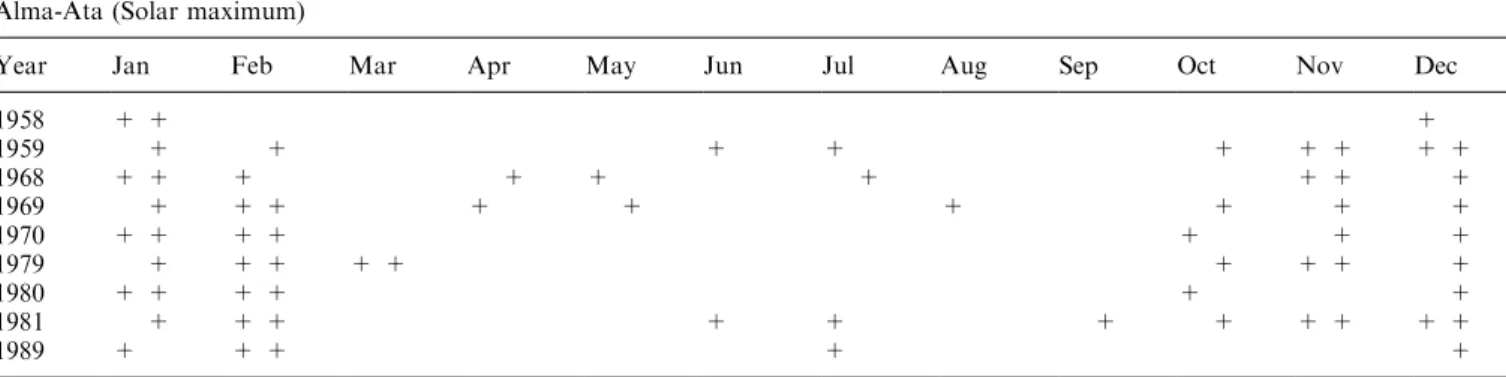
pronounced peak such as shown in Fig. 1, but just a plateau before the main, 2nd peak. Table 1 gives the results averaged over all seasons, while there is a strong seasonal dependence in the peaks occurrence (see later). In the beginning of the analysis it is necessary to stress that the NmF2 nighttime increase is a regular F2-layer feature manifested in the NmF2 monthly medians both at solar minimum and maximum. Tables 2 and 3 give as an example the annual occurrence of the two peaks in monthly NmF2 medians at the Alma-Ata station during solar maximum and minimum. Observed monthly medians were analyzed using the method mentioned to check the presence of both peaks in NmF2 diurnal variations and such cases are marked with crosses in Tables 2 and 3. Nighttime NmF2 increases are seen to be observed in monthly medians from October to March at solar minimum and from October to February at solar maximum. During these, mainly winter months, usually both maxima are present, while only one peak may be observed for the other months as a rule. Similar conclusions are obtained for Kiev and Moscow, but not for St. Petersburg where the distribution of nighttime peaks over the seasons does
not show such a regularity especially at solar maximum. Unlike the three midlatitude stations, St. Petersburg is a sub-auroral station which is subjected to convection electric ®elds and particle precipitation eects during the nighttime, especially during high solar activity.
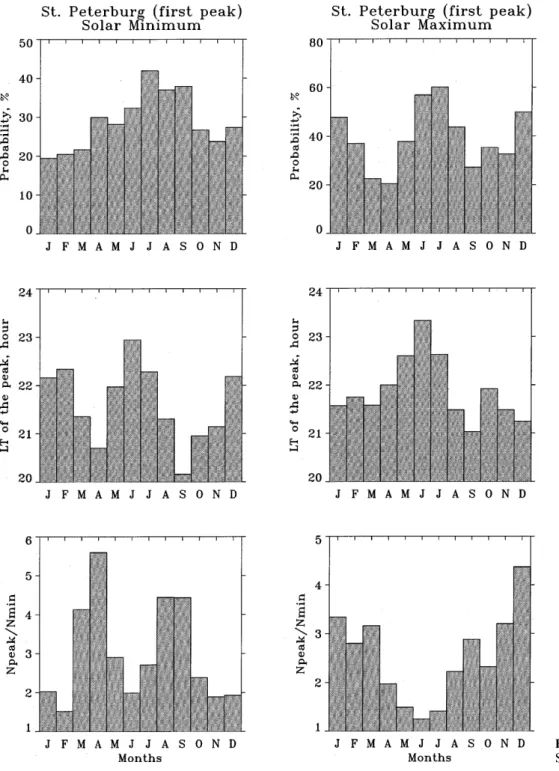
The results of the statistical analysis for the two peaks occurrence are given in Table 4 for four stations, three seasons, solar maximum and minimum conditions. Figures 2±5 give graphical presentation of the results for Alma-Ata and St. Petersburg. The results for Kiev and Moscow are similar to those for Alma-Ata on the whole and are not given to save printing space.
3.1 The ®rst peak (solar minimum)
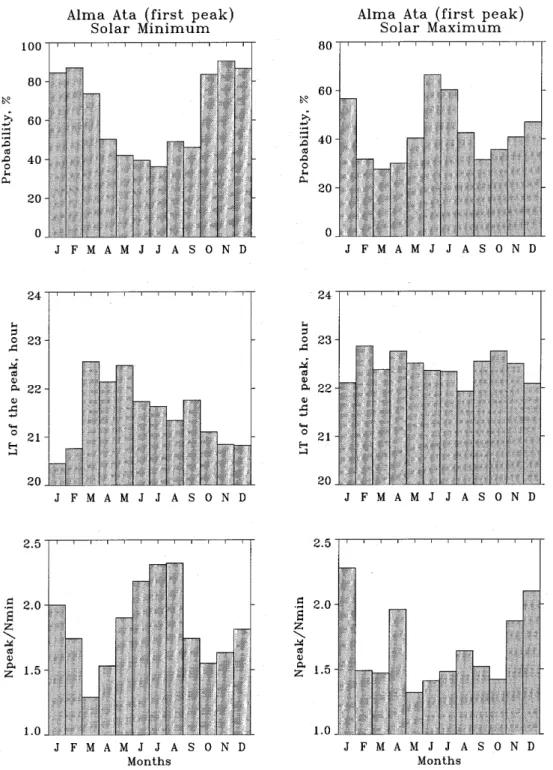
There is a well-pronounced seasonal dependence in the occurrence probability of the ®rst peak (Figs. 2, 4, top graphs). For three midlatitude stations the maximum of occurrence is in winter (70±90% of all quiet days) and minimum in summer (30±50%). The seasonal variation is inverted for St. Petersburg, the nighttime increases are more frequent in summer (30±40% of all quiet days) and
Table 1. Total number of cases (upper) of all quiet days (bottom) considered
Station Solar minimum Solar maximum
1st peak 2nd peak 1st peak 2nd peak
Alma-Ata 959/1438 (67%) 840/1438 (58%) 781/1812 (43%) 1056/1812 (58%)
Kiev 965/1460 (66%) 754/1460 (52%) 650/1493 (43%) 617/1493 (41%)
Moscow 767/1460 (52%) 695/1460 (48%) 926/1913 (48%) 803/1913 (42%)
St.Petersburg 386/1415 (27%) 227/1415 (16%) 748/1864 (40%) 609/1864 (33%)
Table 2. Two peak occurrences in monthly median NmF2 variations solar minimum. Left-hand crosses, the 1st peak, right-hand crosses, the 2nd peak
Alma-Ata (Solar minimum)
Year Jan Feb Mar Apr May Jun Jul Aug Sep Oct Nov Dec
1964 + + + + + + + + + + + + 1965 + + + + + + + + + + + 1975 + + + + + + + + + + + + 1976 + + + + + + + + + + + + + 1985 + + + + + + + + + + + + + 1986 + + + + + + + + + + +
Table 3. Same as Table 2 but for solar maximum Alma-Ata (Solar maximum)
Year Jan Feb Mar Apr May Jun Jul Aug Sep Oct Nov Dec
1958 + + + 1959 + + + + + + + + + 1968 + + + + + + + + + 1969 + + + + + + + + + 1970 + + + + + + + 1979 + + + + + + + + + 1980 + + + + + + 1981 + + + + + + + + + + + 1989 + + + + +
are rare in winter (20±30%). The amplitude of summer increases is larger than winter ones for all stations, but the largest increases take place in St. Petersburg during equinoxes and this may be an indication of a relation with the equinoctial increase in geomagnetic activity. No systematic variation is seen in the timing of the peak which is observed at 20.5±22.5 LT.
3.2 The ®rst peak (solar maximum)
Similar to solar minimum conditions the occurrence probability of the peak decreases from winter to summer months, but a sharp upsurge in the occurrence proba-bility takes place in June±July (Figs. 2, 4) at all four stations (60±70% of all quiet days). This is an interesting result not observed at solar minimum. There is also a pronounced tendency for the peak to appear later in the evening for all seasons (Table 4). The amplitudes of the peak on average are less for all seasons compared to solar minimum conditions (Table 4).
3.3 The second peak (solar minimum)
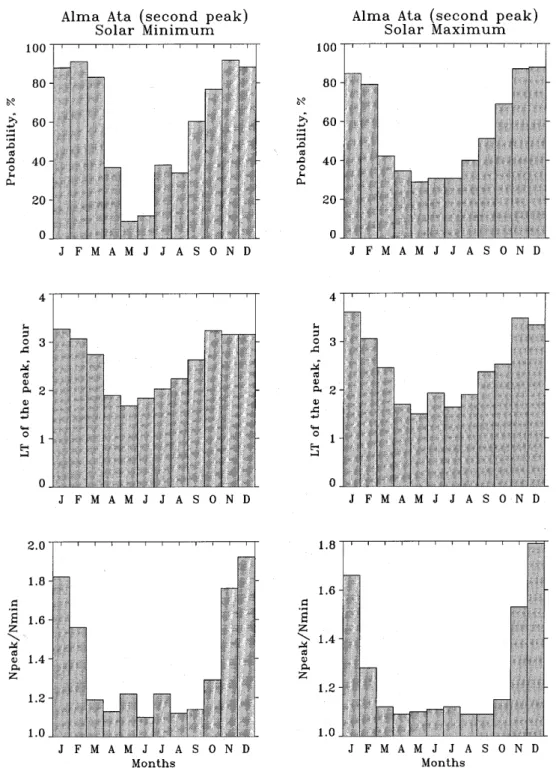
There is a well-pronounced seasonal dependence in the occurrence probability of the peak (Figs. 3, 5 and Table 4) at all four stations. For the three midlatitude stations the peak is most frequent in winter (November± February, 80±90% of all quiet days) and is rare in summer (10±30%) similar to results at Havana, Cuba, (Lois et al., 1990; Jakowski et al., 1991). At St. Petersburg the seasonal tendency is the same but the winter occurrence is low, 20±30% only. The amplitude of NmF2 increases also is the largest in winter at all four stations. A tendency for the amplitude to increase is seen when we pass from lower- to higher-latitude stations. There is also a systematic behavior in the timing of the peak appearance: it occurs later in winter and at equinox than in summer. These results agree with the conclusions obtained for Havana, Cuba at low solar activity.
3.4 The second peak (solar maximum)
At solar maximum there is the same seasonal depen-dence of the peak occurrence: the highest probability is in winter (75±85% of all quiet days) and 10±30% in summer on the three midlatitude stations. A strong increase in the winter peak occurrence takes place at St. Petersburg (Fig. 5) compared to solar minimum conditions. The occurrence probability also increases for summer months at all stations considered, but the seasonal pattern keeps the same as at solar minimum. This contradicts the results by Lois et al. (1990) and Jakowski et al. (1991) at Havana, who found an inversion of the seasonal pattern with the highest peak occurrence in summer. It may be thought that there was a contaminating eect of the ®rst peak which does have the highest occurrence in June±July at solar maximum (see earlier). In a similar way to solar minimum
Table 4. Statistical results for two peak occurrences. Average am plitude and timing of both peaks along with standard deviations are give n. Total number of ca ses is given in brackets Station Season Solar minimum Solar maximum A1 A2 T1 (LT) T2 (LT) A1 A2 T1 (LT) T2 (LT) Alma-Ata Winter 1.7 0.4 (392) 1.7 0.4 (405) 20.5 1.9 3.1 1.4 1.6 1.0 (278) 1.6 0.4 (523) 22.4 1.8 3.4 1.3 Summer 2.1 0.6 (211) 1.1 0.1 (115) 21.7 1.2 2.0 1.0 1.4 0.3 (293) 1.1 0.05 (180) 22.4 1.0 1.7 0.9 Equinox 1.4 0.3 (276) 1.2 0.1 (277) 22.0 1.5 2.9 1.2 1.4 0.4 (177) 1.1 0.08 (288) 22.8 1.3 2.2 1.1 Kiev Winter 1.6 0.4 (361) 1.8 0.4 (389) 21.6 1.8 2.2 1.1 1.5 0.6 (263) 1.5 0.3 (335) 22.4 1.8 3.0 1.5 Summer 2.7 0.7 (260) 1.1 0.09 (88) 21.2 0.7 1.8 1.0 1.6 0.3 (178) 1.1 0.07 (79) 22.0 1.0 1.6 1.0 Equinox 1.9 0.6 (295) 1.2 0.1 (240) 20.1 1.5 2.0 1.1 1.5 0.5 (167) 1.1 0.08 (172) 22.7 1.6 1.7 1.1 Moscow Winter 1.6 0.4 (346) 2.0 0.5 (391) 22.5 1.6 2.4 1.0 1.3 0.2 (397) 1.4 0.4 (470) 23.1 1.0 2.9 1.4 Summer 2.7 0.7 (157) 1.2 0.1 (36) 22.0 0.8 2.0 0.8 1.5 0.3 (255) 1.1 0.07 (86) 22.5 0.7 1.8 0.8 Equinox 1.7 0.7 (226) 1.2 0.1 (233) 22.1 1.8 2.5 1.0 1.3 0.2 (188) 1.1 0.07 (178) 23.6 0.9 2.1 1.0 St. Peters- burg Winter 1.6 0.6 (54) 2.0 0.6 (68) 22.2 1.7 2.0 1.0 1.9 1.2 (262) 1.5 0.5 (352) 22.0 2.2 3.6 1.9 Summer 2.8 1.1 (181) 1.2 0.2 (29) 22.1 0.8 1.9 0.9 1.5 0.4 (295) 1.1 0.07 (108) 22.6 0.9 1.4 0.7 Equinox 3.7 1.8 (132) 1.3 0.2 (122) 20.5 1.5 2.2 1.1 2.3 1.2 (128) 1.2 0.1 (103) 21.4 1.7 2.0 1.2
conditions winter increases are the largest, but the amplitudes are lower compared to solar minimum (Figs. 3, 5 and Table 4).
Similar to solar minimum there is a clear seasonal dependence in timing of the peak: winter peaks are later than equinoctial and summer ones (Figs. 3, 5 and Table 4). Lois et al. (1990) and Jakowski et al. (1991) revealed no seasonal variations in the timing of the peak occurrence during solar minimum and showed the opposite to our results with a seasonal dependence during solar maximum with summer peaks to be the latest. Therefore, either there are longitudinal (Ameri-can/Eurasian sectors) dierences in the mechanism of
the second peak formation at high solar activity, or these dierences are related to dierent methods of analysis. An additional analysis on some American stations is required to con®rm the longitudinal dier-ences revealed.
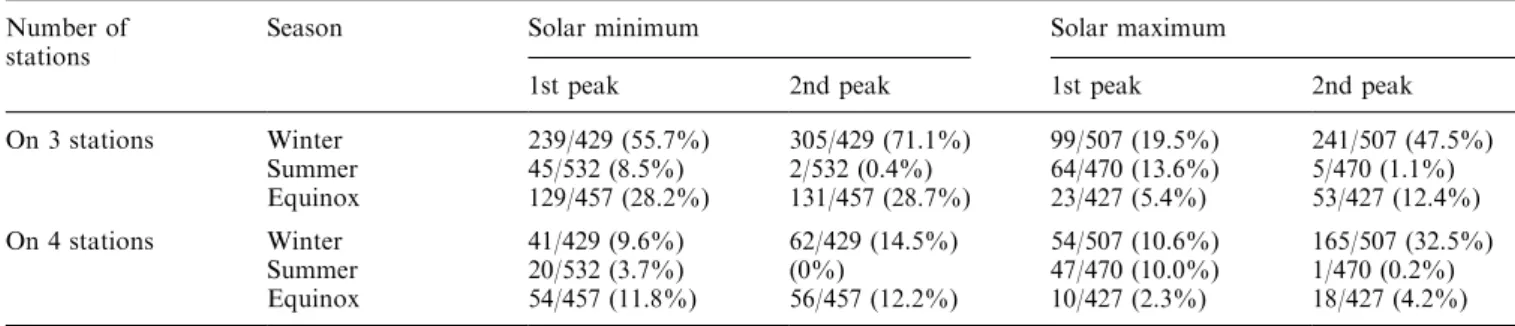
4 Simultaneous occurrence of the peaks
It is interesting to check how often the peaks occur on one and the same days on dierent stations. This may help to specify the mechanism of their formation in various geophysical conditions. The results of such an
Fig. 2. Seasonal variations of occurrence probability (top), timing (middle), and amplitude (bottom) of the 1st peak at Alma-Ata at solar minimum (left-hand side) and solar maximum (right-hand side)
analysis are given in Table 5. They are speci®ed for the three midlatitude stations Alma-Ata, Kiev, Moscow (upper panel) and for all four stations (bottom panel). As St. Petersburg is a sub-auroral station with a somewhat dierent morphology of the peaks we con-sider the four-stations case separately.
Both peaks are very probably simultaneous at the three stations in winter (56 and 71%) at solar minimum. Of course, this may be due to a general high probability of the peaks occurring in these conditions (Figs. 2±5). However, the second peak, for instance, is also very often in winter at high solar activity at any of the three stations, nevertheless, it is
observed simultaneously only on 47% of all days considered (Table 5). In general, the probability of simultaneous occurrence of peaks at the three stations is lower at high solar activity during winter and equinox, but is higher in summer compared to solar minimum conditions. This tells us that the stations are less coupled during high solar activity in winter and equinox if one and the same mechanism is presumed to be responsible for the peak formations at the chain of the stations considered. On the other hand, an increase of the stations coupling on the ®rst peak in summer at solar maximum may indicate a dierent mechanism of this peak formation during summer time.
Fig. 3. Same as Fig. 2 but for the 2nd peak
The overall occurrence probability of the peaks simultaneously at four stations is much less compared to the three-stations case. Unlike the three midlatitude stations case the common probability is very low for both peaks (10±14%) in winter at solar minimum (Table 5). Partly this is due to a general low occurrence probability of both peaks at St. Petersburg at solar minimum (Figs. 4, 5). The only case when probability is high enough (32%) is in winter at solar maximum when the second peak is very probable on all four stations. In general we may conclude that St. Petersburg as a sub-auroral station is not closely related to the midlatitude stations.
An interesting result is on the 1st peak occurrence in summer at solar maximum. The occurrence probability of this peak is rather high (about 60%) for all four stations in June±July while the common occurrence probability is low (10%). This con®rms our conclusion about a dierent mechanism of this peak formation under summer conditions.
5 Discussion
The results of our analysis show well-pronounced and systematic seasonal and solar cycle variations in the
Fig. 4. Same as Fig. 2 but for St. Petersburg
Fig. 5. Same as Fig. 4 but for the 2nd peak
Table 5. Total number of cases (upper) of all quiet days (bottom) with the peaks simultaneously observed at 3 and 4 stations Number of
stations Season Solar minimum Solar maximum
1st peak 2nd peak 1st peak 2nd peak
On 3 stations Winter 239/429 (55.7%) 305/429 (71.1%) 99/507 (19.5%) 241/507 (47.5%) Summer 45/532 (8.5%) 2/532 (0.4%) 64/470 (13.6%) 5/470 (1.1%) Equinox 129/457 (28.2%) 131/457 (28.7%) 23/427 (5.4%) 53/427 (12.4%) On 4 stations Winter 41/429 (9.6%) 62/429 (14.5%) 54/507 (10.6%) 165/507 (32.5%) Summer 20/532 (3.7%) (0%) 47/470 (10.0%) 1/470 (0.2%) Equinox 54/457 (11.8%) 56/457 (12.2%) 10/427 (2.3%) 18/427 (4.2%)
occurrence probability of the two peaks. On one hand, this indicates the ability of the method applied for such a kind of analysis. On the other hand, the systematic variations imply the existence of physical mechanisms responsible for such variations.
The ®rst (pre-midnight) peak is well-observed at all four stations considered during the entire year both at high and low solar activity. However, the mechanism of its formation is thought to be dierent in various seasons. The largest amplitudes of the 1st peak are observed in summer at solar minimum at the three midlatitude stations. This evening NmF2 increase was discussed by Evans (1965) using Millstone Hill obser-vations. Computer simulation studies (Sterling et al., 1969; Strobel and McElroy, 1970; Eccles and Burge, 1973) and subsequent observations (Evans, 1974) have shown that the summer evening NmF2 increase results from a collapse of the F2-layer that occurs when the electron temperature decreases at sunset. This produces large downward ¯uxes of the ions above hmF2. An additional contribution to the NmF2 increase is pro-vided by the equatorward meridional thermospheric wind uplifting F2-layer into low rate recombination region during evening hours. This wind eect was shown to be more important (Eccles and Burge, 1973).
At high solar activity the amplitude of this summer evening NmF2 peak is reduced (see also Titheridge, 1973) compared to solar minimum (Figs. 2, 4), but the occurrence probability of the peak is very high in June± July at all four stations. Although the solar zenith angle v > 95° at 22±23 LT for all stations, this upsurge in the occurrence probability clearly indicates a relation with the Sun position. At high solar activity the neutral atmosphere scale height is large providing appreciable concentrations of neutral gases at high altitudes. There-fore, direct photoionization may be high enough in the topside even at large solar zenith angles. Model calcu-lations are required to specify the mechanism of the 1st peak formation in summer at high solar activity. Another interesting result is the large equinoctial amplitudes of the 1st peak during solar minimum in St. Petersburg (Fig. 4). The timing of these peaks are seen to be the earliest in the whole year. No ideas on the mechanism of these peaks formation can be proposed at present.
The mechanism of the 1st peak formation in winter diers from the summer case. Although strong down-ward plasma ¯uxes also are observed around sunset (Evans, 1974) similar to summer time, it takes place two hours earlier in winter. By the time of sunset in summer (around 21 LT) a strong equatorward meridional wind (e.g., Evans and Holt, 1978; Wickwar, 1989; Buonsanto and Witasse, 1999) uplifts the F2-layer out of the region with fast recombination. Therefore, large downward plasma ¯ux resulting from the topside electron temper-ature decrease is able to produce a pronounced evening NmF2 peak (see earlier). In winter by the time of sunset (around 18 LT) the meridional wind is still poleward or about to change the sign. The F2-layer is located at low heights where the recombination is fast. Therefore, additional plasma in¯ux to the F2-region from above
turns out to be inecient. At the time when the F2-layer is being lifted by the vertical drift (due to the increasing equatorward wind) the recombination decreases and the plasmaspheric ¯ux becomes ecient enough to produce the nighttime NmF2 increase. The amplitude of the NmF2 increase is controlled by the balance between plasma in¯ux from the plasmasphere and total number of recombinations in the ionospheric column (Ivanov-Kholodny and Mikhailov, 1986; Mikhailov and FoÈrster, 1999).
Various observations give a nighttime electron den-sity increase pattern with one (Evans, 1965, 1974; Tyagi, 1974) or two (Young et al., 1970; Balan and Rao, 1987; Rao et al., 1982; Jakowski et al., 1991) peaks. Occur-rence of one or two peaks (before and after midnight) under the mechanism mentioned may be related to the prevailing thermospheric wind pattern in the region. Observations by Behnke and Harper (1973) at Arecibo show that the usual strong pre-midnight equatorward wind, maximizing around 22 LT, inverses around midnight. Downward drift increases the recombination producing a two-hump nighttime NmF2 peak. Computer simulation by FoÈrster and Jakowski (1986, 1988) with a short reversal of the meridional wind around midnight similar to observations by Harper (1973) and Behnke and Harper (1973) con®rmed the two peaks creation in NmF2 variation under this wind reversal mechanism. On the other hand, late occurrence of the 2nd peak during high solar activity cannot be explained by this method and additional analysis is required.
The second peak also demonstrates pronounced seasonal and solar activity variations in its occurrence probability, timing and the amplitude. The peak is well-pronounced in November±February with amplitudes of 1.5±2.0 (Figs. 3, 5; Table 4), but the amplitude is strongly reduced in other months. Qualitatively it is clear that the eect should be less pronounced in summer (Mikhailov and FoÈrster, 1999), but additional quantitative analysis is required to understand the reasons for such sharp reduction of the amplitude during equinoctial and summer seasons. Another ques-tion concerns the seasonal variaques-tion of the peak timing (Fig. 3, Table 4). No explanation for this variation can be proposed now.
Simultaneous peak occurrences at the three midlat-itude stations (Table 5) clearly indicates that the stations are closely related by a unique mechanism of both peak formations in winter and equinoxes, especially at low solar activity. The simultaneous action of the equator-ward neutral wind and the plasmaspheric ¯ow into the F2-region may play this role. It was shown earlier (Bertin and Papet-Lepine, 1970; Tyagi, 1974; Balan and Rao, 1987) that the occurrence probability of both peaks in TEC and foF2 decreased rapidly towards the lower latitudes and vanishes practically at F > 60°; the maximum probability takes place at F » 55°. The four stations considered are within these latitudinal limits. St. Petersburg with F = 56° should show good common occurrence probability for the peaks, but this is not the case (Table 5). Partly this may be related to many gaps
in observations during nighttime hours, but may be due to longitudinal dierences in this eect's occurrence.
6 Conclusions
The morphological study of the post-sunset NmF2 peaks occurrence on four ionosonde stations in the Eurasian sector has revealed the following.
1. There are two dierent peaks (pre-midnight and post-midnight) manifested in NmF2 local time varia-tions during the whole year both at solar minimum and maximum.
2. The 1st peak is more frequent during solar minimum compared to solar maximum. There is a pronounced seasonal variation in the occurrence prob-ability of the 1st peak, with the peak being more frequent in winter compared to summer time. This is valid for the midlatitude stations, but the pattern is opposite at the sub-auroral station St. Petersburg. Summer amplitude of the NmF2 increase is larger than winter one for the midlatitude stations. The largest amplitudes are observed at the sub-auroral station St. Petersburg during equinoxes.
3. During solar maximum the seasonal variation of the 1st peak occurrence probability is similar to the solar minimum pattern, but with a strong probability upsurge in June±July at all four stations. Generally the amplitude of the 1st peak is smaller compared to solar minimum conditions and the peak is shifted to later LT hours.
4. The 2nd peak shows a well-pronounced seasonal variation in the probability occurrence at the four stations, with the peak being more frequent in winter compared to summer, both at solar minimum and maximum. The largest amplitudes of the peak take place in winter, the amplitudes being small for other seasons. There is a tendency for the amplitude to increase with latitude. There is a pronounced seasonal variation in timing of the peak occurrence with winter peaks being later than summer ones.
5. Both peaks are very probable simultaneously at the three midlatitude stations in winter and equinox at solar minimum. This indicates a unique mechanism of both peaks formation in these seasons. The common occur-rence probability of both peaks is less during winter and equinoxes at solar maximum compared to solar mini-mum conditions. This indicates that the stations are less coupled at solar maximum. An opposite behavior demonstrates that the 1st peak in summer has an enhanced common occurrence probability. Together with the large increase of the peak occurrence in June± July at solar maximum, this indicates a dierent mechanism of the 1st peak formation in summer at high solar activity.
6. The results of similar analysis at the four stations show that St. Petersburg, as a sub-auroral station, is not closely related to the midlatitude stations as the com-mon occurrence probability of both peaks is rather low. While the occurrence probability of the 1st peak is rather high (about 60%) at all four stations in June±July
at solar maximum, the common occurrence probability is low (10%). This con®rms the conclusion about a dierent mechanism of this peak formation under summer conditions.
Clearly these results of our morphological analysis revealed many interesting features of the nighttime NmF2 increases which need a theoretical interpretation.
Acknowledgements. This work was supported by the NATO Collaborative Research Grant EST.CLG 975303.
Topical Editor M. Lester thanks R. Leitinger and R. Hanbaba for their help in evaluating this paper.
References
Arendt, P. R., and H. Soicher, Downward electron ¯ux at 1000 km altitude from electron content measurement at mid-latitudes, Nature, 204, 983±984, 1964.
Balan, N., and P. B. Rao, Latitudinal variations of nighttime enhancements in total electron content, J. Geophys. Res., 92, 3436±3440, 1987.
Behnke, R. A., and R. M. Harper, Vector measurements of F-region ion transport at Arecibo, J. Geophys. Res., 78, 8222±8234, 1973. Bertin, F., and J. Papet-Lepine, Latitudinal variation of total electron content in the winter at middle latitude, Radio Sci., 5, 899±906, 1970.
Buonsanto, M. J., and O. G. Witasse, An updated climatology of thermospheric neutral winds and F region ion drifts above Millstone Hill, J. Geophys. Res., 104, 24,675±24,687, 1999. Davies, K., D. N. Anderson, A. K. Paul, W. Degenhardt, G. K.
Hartman, and R. Leitinger, Nighttime increase in total electron content observed with the ATS 6 radio beacon, J. Geophys. Res., 84, 1536±1542, 1979.
Da Rosa, A. V., and F. L. Smith, Behavior of the nighttime ionosphere, J. Geophys. Res., 72, 1829±1836, 1967.
Eccles, D., and J. D. Burge, The behavior of the upper ionosphere over North America at sunset, J. Atmos. Terr. Phys., 35, 1927± 1934, 1973.
Evans, J. V., Cause of midlatitude winter night increase in foF2, J. Geophys. Res., 70, 4331±4345, 1965.
Evans, J. V., Millstone Hill Thomson scatter results for 1965, Planet Space. Sci., 18, 1225±1253, 1970.
Evans, J. V., Millstone Hill Thomson scatter results for 1969, Lin. Lab., M.I.T. Tech. Rep. N 513, 1974.
Evans, J. V., A study of F2 region night-time vertical ionization ¯uxes at Millstone Hill, Planet. Space Sci., 23, 1611±1623, 1975. Evans, J. V., and J. M. Holt, Millstone Hill Thomson scatter
results for 1972, Lin. Lab., M.I.T. Tech. Rep. N 530, 1978. Feicher, E., and R. Leitinger, Die Anwendung interaktiver
statis-tischer Methoden auf den Electroneninhalt der Ionosphere, Kleinheubacher Beri, 30, 155±164, 1987.
FoÈrster, M., and N. Jakowski, Interhemispheric ionospheric cou-pling at the American sector during low solar activity. II. Modelling, Gerlands Beitr. Geophys., Leipzig, 95, 301±314, 1986. FoÈrster, M., and N. Jakowski, The nighttime winter anomaly (NWA) eect in the American sector as a consequence of interhemispheric ionospheric coupling, PAGEOPH, 127, 447± 471, 1988.
Harper, R. M., Nighttime meridional neutral winds near 350 km at low to mid-latitudes, J. Atmos. Terr. Phys., 35, 2023±2034, 1973.
Ivanov-Kholodny, G. S., and A. V. Mikhailov, The prediction of ionospheric conditions, D. Reidel, Dordrecht, The Netherlands, 1986.
Jakowski, N., and M. FoÈrster, About the nature of the nighttime winter anomaly eect (NWA) in the F-region of the ionosphere, Planet. Space Sci., 43, 603±612, 1995.
Jakowski, N., M. FoÈrster, B.Lazo, and L. Lois, Interhemispheric ionospheric coupling at the American sector during low solar activity. I. Observations, Gerlands Beitr. Geophys., Leipzig, 95, 219±227, 1986.
Jakowski, N., A. Jungstand, L. Lois, and B. Lazo, Nighttime enhancement of the F2-layer ionization over Havana, Cuba, J. Atmos. Terr. Phys., 53, 1131±1138, 1991.
Joshi, H. P., and K. N. Iyer, On nighttime anomalous enhancement in ionospheric electron content at lower mid-latitude during solar maximum, Ann. Geophysicae, 8, 53±58, 1990.
Lois, L., H. Peres, B. Lazo, N. Jakowski, and R. Landrock, Nighttime enhancement of the F2-layer ionization over Ha-vana-Cuba: a relationship with solar activity, Geomag. Aeronom., 30, 76±82, 1990.
Mikhailov, A. V., and M. FoÈrster, Some F2-layer eects during the January 06±11, 1997 CEDAR storm period as observed with the Millstone Hill incoherent scatter facility, J. Atmos. Solar-Terr. Phys., 61, 249±261, 1999.
Rao, M. M., P. E. Raj, and C. Jogulu, A study of the post-sunset increase in the F2-region electron density at low- and middle
latitudes in the Asian zone during sunspot maximum and minimum periods, Ann. Geophysicae, 38, 357±365, 1982. Sterling, D. L., W. B. Hanson, R. J. Moett, and R. G. Baxter,
In¯uence of electromagnetic drifts and neutral air winds on some features of the F2 region, Radio Sci., 4, 1005±1023, 1969. Strobel, D. F., and M. B. McElroy, The F2-layer at middle
latitudes, Planet Space Sci., 18, 1181±1202, 1970.
Titheridge, J. E., Nighttime changes in the electron content of the ionosphere, J. Geophys. Res., 73, 2985±2993, 1968.
Titheridge, J. E., The electron content of the southern mid-latitude ionosphere, 1965±1971, J. Atmos. Terr. Phys., 35, 981±1001, 1973.
Tyagi, T. R., Electron content and its variation over Lindau, J. Atmos. Terr. Phys., 36, 475±487, 1974.
Wickwar, V. B., Global thermospheric studies of neutral dynamics using incoherent scatter radars, Adv. Space Res., 9, (5)87± (5)102, 1989.
Young, D. M. L., P. C. Yuen, and T. H. Roelofs, Anomalous nighttime increases in total electron content, Planet Space Sci., 18, 1163±1179, 1970.