HAL Id: hal-01209046
https://hal.archives-ouvertes.fr/hal-01209046
Submitted on 5 Jun 2020
HAL is a multi-disciplinary open access
archive for the deposit and dissemination of
sci-L’archive ouverte pluridisciplinaire HAL, est
destinée au dépôt et à la diffusion de documents
A review of farm level indicators of sustainability with a
focus on CAP and FADN
Ambre Diazabakana, Laure Latruffe, Christian Bockstaller, Yann Desjeux,
John Finn, Edel Kelly, Mary Ryan, Sandra Uthes
To cite this version:
Ambre Diazabakana, Laure Latruffe, Christian Bockstaller, Yann Desjeux, John Finn, et al.. A review
of farm level indicators of sustainability with a focus on CAP and FADN. [Research Report] D1.2,
auto-saisine. 2014, 101 p. �hal-01209046�
A REVIEW OF FARM
LEVEL INDICATORS OF
SUSTAINABILITY WITH A
FOCUS ON CAP AND
FADN
Ambre DIAZABAKANA1, Laure LATRUFFE1, Christian BOCKSTALLER2, Yann DESJEUX1, John FINN3, Edel KELLY3, Mary RYAN3, Sandra UTHES4
1 INRA, UMR SMART, F-35000 Rennes, France
2 INRA, UMR Agronomie et Environnement, F-68000 Colmar, France 3 Teagasc, Ireland
4 Leibniz Centre for Agricultural Landscape Research (ZALF), Germany
11 December 2014 Public
D1.2
ABOUT THE FLINT PROJECT
FLINT will provide an updated data-infrastructure needed by the agro-food sector and policy makers to provide up to date information on farm level indicators on sustainability and other new relevant issues. Better decision making will be facilitated by taking into account the sustainability performance of farms on a wide range of relevant topics, such as (1) market stabilization; (2) income support; (3) environmental sustainability; (4) climate change adaptation and mitigation; (5) innovation; and (6) resource efficiency. The approach will explicitly consider the heterogeneity of the farming sector in the EU and its member states. Together with the farming and agro-food sector the feasibility of these indicators will be determined.
FLINT will take into account the increasing needs for sustainability information by national and international retail and agro-food sectors. The FLINT approach is supported by the Sustainable Agriculture Initiative Platform and the Sustainability Consortium in which the agro-food sector actively participates. FLINT will establish a pilot network of at least 1000 farms (representative of farm diversity at EU level, including the different administrative environments in the different MS) that is well suited for the gathering of these data.
The lessons learned and recommendations from the empirical research conducted in 9 purposefully chosen MS will be used for estimating and discussing effects in all 28 MS. This will be very useful if the European Commission should decide to upgrade the pilot network to an operational EU-wide system.
PROJECT CONSORTIUM:
1 DLO Foundation (Stichting Dienst Landbouwkundig Onderzoek) Netherlands
2 AKI - Agrargazdasagi Kutato Intezet Hungary
3 MTT Agrifood Research Finland Finland
4 IERiGZ-PIB - Instytut Ekonomiki Rolnictwa i Gospodarki
Zywnosciowej-Panstwowy Instytut Badawcy Poland
5 INTIA - Instituto Navarro De Tecnologias e Infraestructuras Agrolimentarias Spain 6 ZALF - Leibniz Centre for Agricultural Landscape Research Germany 7 Teagasc - The Agriculture and Food Development Authority of Irelan Ireland
8 Demeter - Hellenic Agricultural Organization Greece
9 INRA - Institut National de la Recherche Agronomique France
10 CROP-R BV Netherlands
11 University of Hohenheim Germany
MORE INFORMATION:
Drs. Krijn Poppe (coordinator) e-mail: krijn.poppe@wur.nl Dr. Hans Vrolijk e-mail: hans.vrolijk@wur.nl LEI Wageningen UR phone: +31 07 3358247 P.O. Box 29703
2502 LS The Hague www.flint-fp7.eu
TABLE OF CONTENTS
List of tables ... 6 List of figures ... 7 List of acronyms... 8 Executive summary ... 10 1 Introduction ... 11 2 Measuring sustainability ... 132.1 The concept of sustainability ... 13
2.2 Measuring sustainability ... 14
2.3 Various scales of sustainability ... 16
3 Design and selection of sustainable farm level indicators ... 18
3.1 Typology of sustainability indicators ... 18
3.1.1 Environmental indicators ... 18
3.1.2 Economic indicators ... 22
3.1.3 Social indicators ... 25
3.2 Development of composite indicators ... 27
3.2.1 Aggregating a set of indicator values into a single composite value ... 27
3.2.2 Multi-criteria analysis ... 27
3.2.3 Multi-criteria assessment based on a qualitative method ... 28
3.2.4 Discussion ... 29
3.3 Selection criteria ... 29
3.3.1 Selection of an indicator ... 30
3.3.2 Indicator vs. set of indicators ... 31
3.4 Data collection: desirability, feasibility, gaps ... 31
4 Uses of sustainability indicators at farm level: national initiatives ... 33
4.1 Sustainability indicators to support farms’ decision ... 35
4.1.1 Ex-ante analysis for project development support ... 35
4.1.2 Support for current on-farm management decisions ... 38
4.1.3 Ex-post analysis ... 39
4.1.4 Discussions regarding indicator-based assessment methods for farm decision support .... 41
4.2.4 Indicator-based assessment methods for farm comparison used for policy evaluation ... 55
4.3 Sustainability indicators for farm level policy analysis ... 56
4.3.1 FADN – the most widely used source for farm-level policy analysis ... 56
4.3.2 Evaluation of agri-environment schemes (AES) ... 56
4.3.3 Model-based studies evaluating policy effects at the farm scale ... 57
4.3.4 Innovative evaluation studies of other policy instruments ... 58
5 Discussion ... 59
5.1 Dissemination of farm level indicators ... 59
5.1.1 The importance of knowledge transfer in the agricultural sector and for farm sustainability 59 5.1.2 Dissemination of farm level indicators ... 60
5.1.3 Presentation and visualisation of indicators ... 61
5.2 The multi-dimensional concept of sustainability ... 66
5.2.1 Imbalances in overall sustainability ... 66
5.2.2 Evolution of the concept of sustainability: the role of innovation in sustainable development ... 67
5.3 Sustainability, CAP evaluation and FADN ... 68
5.3.1 Use of FADN data for CAP evaluation ... 68
5.3.2 Transferability of research studies to FADN use ... 69
5.3.3 Sustainability indicators and FADN: what is done, missing and possible?... 70
6 Conclusion and recommendations ... 82
7 References ... 84
LIST OF TABLES
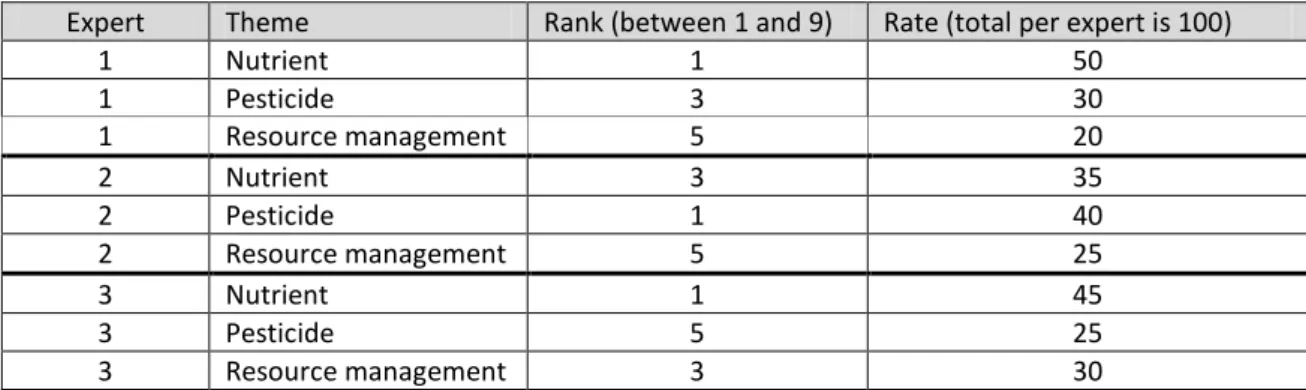
Table 1: Example of hypothetical data on ranks and rates of environmental themes by a group of experts
... 28
Table 2: Classification of the national initiatives according to their use of indicators ... 33
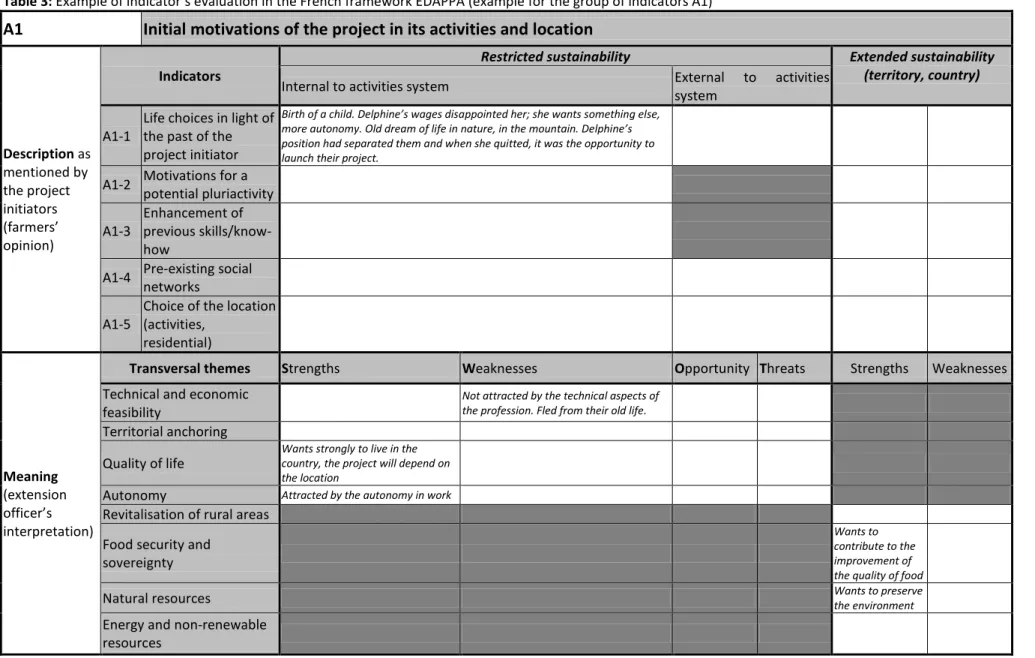
Table 3: Example of indicator’s evaluation in the French framework EDAPPA (example for the group of indicators A1) ... 37
Table 4: Examples of sigAGROasesor project’s indicators ... 38
Table 5: Indicators of the French IDEA method ... 44
Table 6: Indicators of the Greek study relying on MAVT ... 46
Table 7: Social indicators of the French RefAB method ... 48
Table 8: Indicators and attributes of the MESMIS tool applied to a Spanish case study ... 54
Table 9: Example of economic indicators provided by the EconomyDoctor website ... 60
Table 10: Overview of some of the main EU policies and topics that are relevant to farm-scale sustainability... 74
LIST OF FIGURES
Figure 1: From raw data to composite indicators: an illustration ... 15
Figure 2: Typology of indicators according to their nature ... 19
Figure 3: Examples of an indicator typology according to the cause-effect chain ... 20
Figure 4: The DPSIR framework of environmental indicator analysis ... 21
Figure 5: Dimensions of quality of life in rural areas ... 26
Figure 6: Overview of DEXiPM based on the DEXi tool ... 29
Figure 7: Examples of outputs from the Irish Carbon Navigator ... 39
Figure 8: Examples of results provided by the French DAE-G tool ... 41
Figure 9: Example of tabular presentation of individual indicators per farm ... 62
Figure 10: Example of bar chart presentation of individual indicators per farm ... 63
Figure 11: Example of bar chart presenting, for one farm, the evolution of the contribution of indicators in the component of organisation of space ... 63
Figure 12: Example of bar chart presentation of social indicators for one farm ... 64
Figure 13: Example of line chart presentation of composite indicator ... 64
Figure 14: Example of radar chart presentation of the overall sustainability of one farm ... 65
Figure 15: Example of radar chart presentations of sustainability attributes and sustainability pillars for different farming systems ... 65
LIST OF ACRONYMS
AES Agri-Environmental Scheme AFI Agri-Environmental Footprint Index AHS Animal Health Strategy
AWU Annual Working Unit
C Carbon
CAP Common Agricultural Policy
CH4 Methane
CO2 Carbon dioxide
CSS Countryside Stewardship Scheme DLG Deutsche Landwirtschaftsgesellschaft
DPSIR Driving-force/Pressure/State/Impact/Response
EDAPPA Évaluation de la Durabilité pour l’Accompagnement des Porteurs de Projet Agricole EEA European Environment Agency
EEC European Economic Community EICD European Interpolated Climate Data EIP European Innovation Partnerships ESDB European Soil Database
EU European Union
FAO Food and Agriculture Organisation FADN Farm Accountancy Data Network FBI Farmland Birds Index
FBS Farm Busines Survey
FLINT Farm Level Indicators for New Topics in Policy Evaluation FSRA Farm Safety Risk Assessment
FSS Farm Safety Statement
GHG GreenHouse Gases
GIS Geographic Information System HNV High Nature Value
ICT Information and Communications Technology IDEA Indicateurs de Durabilité des Exploitations Agricoles
IPCC Intergovernmental Panel on Climate Change
K Potassium
KUL Kriterien Umweltverträglicher Landbewirtschaftung KSNL KriterienSystem Nachhaltige Landwirtschaft LAG Local Action Group
LCA Life Cycle Analysis
LPIS Land Parcel Identification System MAVT Multi Attribute Value Theory MCA Multi-Criteria Analysis
MCDM Multicriteria Decision Making Model
MESMIS Marco para la Evaluación de Sistemas de Manejo de recursos naturales incorporando Indicadores de Sustentabilidad MWD Mean Weight Diameter
N Nitrogen
NACAH National Assessment Catalogue for Animal Husbandry NFS National Farm Survey
N2O Nitrous oxide NO2 Nitrogen dioxide
OECD Organisation for Economic Co-operation and Development
P Phosphorus
PLAGE Plateforme d’évaluation Agri-Environnementale PSR Pressure/State/Response
R&D Research and Development RDP Rural Development Programme
RISE Response-Inducing Sustainability Evaluation
SAFA Sustainability Assessment of Food and Agriculture systems SDAS Sustainable Dairy Assurance Scheme
SDI Sustainable Development Indicators
SEAMLESS System for Environmental and Agricultural Modelling; Linking European Science and Society SIA Sustainable Impact Assessment
SIRIS Système d’Intégration des Risques par Interaction des Scores SROI Social Return on Investment
TFP Total Factor Productivity UAA Utilised Agricultural Area UCD University College Dublin
EXECUTIVE SUMMARY
The agricultural sector has a strong role to play in achieving the goal of ‘Sustainable growth: promoting a more resource efficient, greener and more competitive economy’ listed in the Europe 2020 strategy. From a policy perspective, the Common Agricultural Policy (CAP) is likely to be a driver of sustainability as it has progressively introduced more environmental and social concerns within the various CAP reforms.
In this context, we provide here a review of sustainable indicators for agriculture. Not only do we review the international literature, but we also provide a synthesis of several national initiatives of farm sustainability assessment in the nine partner countries of the FLINT project: Finland, France, Germany, Greece, Hungary, Ireland, the Netherlands, Poland, and Spain.
Although no consensus has yet been reached in terms of the operational meaning of sustainability, we consider here that sustainable development aims at preserving or enlarging our capital stock which includes the economic capital, the social capital and the natural capital. The review particularly focuses on indicators at the farm level. The farm level is a relevant scale at which to assess sustainability, as farm management decisions may directly impact farm sustainability. Further, the farm level approach increases the spatial accuracy, which is highlighted as a main challenge in other quantification approaches. Finally, the farm is the legal unit for legislation purposes and the economic unit that receives payments for externalities within the CAP framework and as such is the level at which most policies are directed.
The typology of sustainability indicators generally follows the three sustainability pillars: environmental indicators; economic indicators; social indicators. The literature review shows that the environmental pillar has undergone an ‘indicator explosion’, due to the multitude of themes covered (e.g. greenhouse gas emissions, biodiversity, water quality, resource efficiency, soil conservation...) and the attention given by society to this dimension of sustainability. Due to the complexity of environmental issues, many of these indicators are composite in nature, leading to uncertainty over whether individual or composite indicators are preferable. By contrast, economic indicators relate to a relatively small number of themes (profitability, productivity, autonomy, resilience) and were not generally developed as indicators measuring economic sustainability. Social indicators cover two types of themes: sustainability relating to the farm community (such as well-being and health) and sustainability relating to society as a whole (such as the quality of life in rural areas). The measurement of these indicators is challenging as they are often qualitative and subjective. Thus, any methodology used to measure them should be fully clear and transparent.
Careful attention should be given to the selection of indicators, since the data measured will influence the outcome of that indicator and therefore the outcome of the analysis. Selection should be made keeping in mind that sustainability assessments should be validated, credible and reproducible. Several selection criteria are provided in the literature, such as representativeness, transferability, adaptability, and measurability at an acceptable cost. In addition, the literature recommends using a set of indicators that can jointly provide an answer rather than one single indicator.
The national initiatives in the nine countries partners of the FLINT project are diverse in relation to the aims, methods and data utilised. Three main aims are covered: farm decision support; comparison of farms; evaluation of policies. Various methods are used such as decision support systems or multicriteria decision making. In relation to data, few initiatives use the European-wide Farm Accountancy Data Network (FADN) data. Where FADN data are used, they are often complemented with additional data collected from farmer surveys or from stakeholders in the value chain. Overall, the national initiatives provide ideas for original and relevant indicators for themes that are not currently covered by FADN,
1 INTRODUCTION
Growing environmental concerns have prompted governments to promote sustainable choices and actions in the economy, allowing the preservation, or preventing the deterioration of the environment whilst also maintaining competitiveness. In the European Union (EU) the European Commission has for example included three priorities in its Europe 2020 strategy, one of them being ‘Sustainable growth: promoting a more resource efficient, greener and more competitive economy’ (European Commission, 2010a)
The agricultural sector has a strong role to play in achieving this goal. The Common Agricultural Policy (CAP), originally strongly focused on food security the ‘optimum utilisation of the factors of production’ (Westbury et al., 2011) and a fair standard of living for farmers, has progressively introduced more environmental concerns within the various CAP reforms. This led to the adoption of a strategy for integrating the environmental dimension into the CAP by the European Council in Helsinki (December 1999). This Integration Strategy stressed the key role of Member States in the implementation of integration measures and asked for the development of appropriate agri-environmental indicators to monitor such integration. The greening of the CAP continues within its 2013 reform.
Although receiving less attention, social concerns are also being integrated. In their report about the provision of public goods by agriculture, Cooper et al. (2009) identify rural vitality and farm animal welfare and health as social public goods. The authors stress the importance of social vitality, with agriculture contributing to the achievement of a ‘critical social mass [that] is important to sustain the services and infrastructure relied upon by rural populations, as well as serving as a repository of skills and knowledge which help to keep alive rural cultures and traditions’. During the preparation of the 2013 CAP reform, the European Commission also recognised the positive role of agriculture in rural areas in delivering ‘multiple economic, social, environmental and territorial benefits’ (European Commission, 2010b). The new CAP hence aims at promoting ‘a balanced territorial development of rural areas throughout the EU by empowering people in local areas, building capacity and improving local conditions and links between rural and urban areas’ (European Commission, 2010b).
As summarised by Pretty et al. (2010) the goal is ‘no longer simply to maximise productivity but to optimise across a far more complex landscape of production, rural development, environmental, social justice and food consumption outcomes’.
Also, retail and agro-food sectors, both nationally and internationally, have increasing demands on the sustainability of agricultural production. These pressures from government and from private interests have resulted in the existence of a wide set of initiatives for the certification/labelling/monitoring of sustainable production and/or products along with an equally wide set of sustainability indicator frameworks. This multiplicity of international and national initiatives poses some important methodological issues. Such as:
• In terms of definition: what are the multiple objectives and concepts used in the construction of sustainable development indicators in agriculture?
The underlying question is whether all sustainability pillars are similarly considered. Sustainability indicators for the farming sector should in theory take into account the multi-functionality of agriculture.
• In terms of operationalisation: what is the best process for developing an indicator?
For example Boone et al. (2012) identify nine steps in the development of an indicator: (1) choice of goals, (2) choice of level of scale, (3) specification of conditions and functional and user demands, (4) choice of issues\themes to focus on, (5) choice of indicators, target levels and measuring techniques, (6) choice of assessment methods and aggregation, (7) choice of presentation of performance indicators, (8) choice of data sources, (9) choice of points for improvement. This complex process implies that many methodological questions are raised.
• In terms of measurement: is there a gap between the availability of data from farm management and accounting systems and the information needed by theoretical indicator frameworks?
The actual measurement of indicators is often difficult due to limitations on data availability, or measurements are carried out at a small scale within a pilot setting. Policy analyses and practical use require that indicators can be measured at a larger scale and a balanced trade-off can be achieved between theoretical and practical aspects.
• In terms of harmonisation: is there a way to harmonise of indicators across countries?
Many different initiatives exist at national level. To some extent these initiatives address the same issues, but there are subtle and less subtle differences in the definition, scope and level of detail. Harmonisation would allow for international comparison and benchmarking and more consistent policy evaluation as well as greater consistency in management decisions in international food companies. It is in this context that the FP7 KBBE.2013.1.4-12 research project FLINT (‘Farm Level Indicators for New Topics in Policy Evaluation’) was placed, concerning the research theme ‘Support to agricultural policy – Establishing and testing farm-level indicators’. In this project we provide a review of sustainable indicators in agriculture. Not only do we review the existing literature, but we also provide a synthesis of several national initiatives of farm sustainability assessment in the nine partner countries of the FLINT project: Finland, France, Germany, Greece, Hungary, Ireland, the Netherlands, Poland, and Spain. The review particularly focuses on (i) indicators at the farm level, (ii) indicators that can facilitate policy analysis, (iii) the link with the European-wide Farm Accountancy Data Network (FADN). FADN ‘is an instrument for evaluating the income of agricultural holdings and the impacts of the Common Agricultural Policy’ and ‘consists of an annual survey carried out by the Member States of the European Union’ (European Commission, 2014). Harmonised accountancy data for a sample of farms in each Member State (about 80,000 farms EU-wide) are collected each year and stored in the European FADN database. While FADN was originally developed in the 60’s to monitor farm income, the challenge is now to integrate data that can allow for the measurement of farm sustainability performance in a global context.
The report is organised as follows. Section 2 gives a broad brush picture of sustainability, the concept and its measurement. Section 3 reviews the literature on indicators grouped according to the classic categorisation based on the three sustainable development pillars (environment, economic and social), and gives a critical overview of the development of composite indicators, of the selection process of indicators and of the necessary data collection. Section 4 is devoted to the description of national initiatives in the nine EU countries listed above, according to three main aims of the development of indicators: to support farms’ decisions, to compare farming systems, to evaluate policies. Section 5 proposes some specific discussion points relating to the dissemination of indicators, the multi-dimensional nature of sustainability, and the use of FADN to evaluate the CAP in terms of sustainability. Section 6 concludes and draws recommendations regarding the research on sustainability indicators (e.g. themes on which more research is needed), and regarding the FLINT project in terms of the participation of stakeholders, the dissemination of indicators, the sample to select, and the most efficient way of collecting indicators. It should be noted that, for consistency reasons, only scientific or extension initiatives are considered here; initiatives from the retail and agro-food sectors are not reviewed in this report but will be considered in FLINT Deliverable 1.4.
2 MEASURING
SUSTAINABILITY
This section discusses the definition of sustainability which is a wide concept that incorporates several dimensions and objectives. The section also explains how to measure sustainability, through indicators measuring various sustainability issues at different scales.
2.1 The concept of sustainability
The concept of ‘sustainable development’ was introduced by the ‘Brundtland report’ in the late 1980’s (WCED, 1987). The report attempts to reach a general consensus on the perception of the concept defining sustainable development as an ‘economically viable, environmentally sound and socially acceptable development that meets the needs of the present without compromising the ability of future generations to meet their own needs’. This concept of sustainable development spread extremely rapidly, and only two years after the publication of the Brundtland report, Pezzey (1989) recorded more than 60 different definitions of the concept.
However, the widespread adoption of the concept of sustainable development became really popular following the Rio Earth Summit in 1992 (Woodhouse et al., 2000), and in the meantime Toman (1992) discussed the difficulties faced in precisely defining sustainability. Indeed, some 300 definitions of the word sustainability were identified by Dobson (1996) only four years after the Rio Earth Summit. From the above it is easily understandable that no consensus has yet been reached in terms of the operational meaning of sustainability, despite its intuitive perception (Park and Seaton, 1996). Nevertheless, one may agree with Welford’s (1995 and 1996) viewpoint stressing the importance of jointly addressing three closely connected dimensions: (i) the environmental dimension, that is to be considered as an integrated part of the economy and not as a free good; (ii) equity, in terms of access to and consumption of resources between rich and poor countries and on a local and global level; and (iii) futurity, considering that endangering the ability for future generations to meet their future demand is not acceptable.
From an economic point of view, sustainable development aims at preserving or enlarging our capital stock which includes (i) the economic capital (e.g. savings, infrastructures, etc), (ii) the social capital (e.g. health, culture, education, etc), and (iii) the natural capital (e.g. air, water, landscape, biodiversity, etc) (Pingault, 2007).
Since then, ‘sustainability’, ‘sustainable development’, or ‘sustainable agriculture’ have often been used as catch-phrases with different interpretations by individuals, organisations or institutions to qualify actions undertaken to assess the impacts of human activities on the environment.
Nevertheless, the concept is increasingly prominent in current agricultural policy debates (Dillon et al., 2010). New principles have been added to its definition such as governance, solidarity, transmission capital, local knowledge (Antoine et al., 2001; AFNOR, 2003; Mancebo, 2006) and more recently innovation (Hennessy et al., 2013).
Since the last CAP reform, the principle of sustainability is integrated into the objectives of the policy (Dillon et al., 2010), however the application of this concept to agriculture has faced a multiplicity of definitions. Efforts have been made to produce an integrated definition of this term: the application of
the concept of sustainable development in agriculture raises interest both for the sustainability of the agricultural system itself and its contribution to sustainable development (Bockstaller et al., 2009a). It thus incorporates the principal dimensions and objectives of sustainability when sustainable practices are implemented on a given agricultural system (Schaller, 1993; Vereijken, 1997; den Biggelaar and Suvedi, 2000; Gafsi et al., 2006).
Viewed from the perspective of the farm, the contribution to sustainable agriculture is threefold: • the production of goods and services (economic function) ;
• the management of natural resources (ecological function) ; • the contribution to rural dynamics (social function).
The harmonious combination of these three interconnected functions constitutes the background of sustainable agriculture. To move towards sustainability, it is necessary to progress simultaneously in all three dimensions. Besides, since these three functions are linked, the improvement (or maintenance) of the economic performance alone is meaningless if it does not come together with an improvement (or maintenance) of environmental and social performances: the economic profitability of a production system is not sufficient to compensate unbearable ecological and social costs (Vilain, 1997).
2.2 Measuring sustainability
Two types of sustainability assessment should be distinguished: ex-post assessment addressing an actual system on the one hand, and ex-ante assessment addressing a potential or virtual system on the other hand. While ex-post assessment should/could be used to evaluate or diagnose a given policy (provided that mechanisms through which policy influences sustainability are clearly defined and understood), ex-ante assessment is less frequently implemented and could be used to define optimal policies or to rank optimal options of a given policy. In the following, the focus is placed (unless noted otherwise) on ex-post assessment.
Assessing the sustainability of agricultural systems is a key issue for the implementation of policies and practices aimed at revealing sustainable forms of land use (Neher, 1992; Sulser et al., 2001; Pacini et al., 2003) and a key step in supporting the development of sustainable farming systems (Sadok et al., 2008). However, if they are to be realistic and effective, such assessments must handle the complexity/ambiguity of the concept of sustainability, whilst taking personal and subjective views concerning the relative importance of priorities into account (Dent et al., 1995; Park and Seaton, 1996; Andreoli and Tellarini, 2000).
The assessment of sustainability is mosly based on multi-criteria decision-aid methods (e.g. Sadok et al., 2008; Manos et al., 2013), and some approaches have resulted in prototype sustainable solutions in the field (Rossing et al., 1997; Zander and Kächele, 1999; Loyce et al., 2002; Dogliotti et al., 2005).
Vilain (1997) identifies two methods to guide agricultural practices towards increased sustainability: (i) the method of specifications, consisting of codifying favourable practices and reporting unsustainable practices (e.g. through charters and diagrams); and (ii) the measurement of (progress towards) sustainability using indicators.
In practice, sustainability assessment generally involves dividing the previously mentioned three dimensions of sustainability into various issues of concern (Gómez-Limón and Sanchez-Fernandez,
that are more difficult to gain access to, or more complex systems. Since 1997, the OECD publishes its ‘Environmental Indicators for Agriculture’ and defines an indicator as ‘a representative measure (summary form) involving raw data on a phenomenon that is important for policy makers (OECD, 2001). Defined as such, indicators are intended to assist users in their action (decision making, building agenda, modelling, etc) providing information to policy makers and society, sharing knowledge and building consensus among stakeholders. Nevertheless, while policies obviously need indicators, the latter should be used and interpreted cautiously as they are not intended to constitute a policy per se.
In practice, agricultural sustainability indicators are quantifiable and measurable attributes of a system that are judged to be related to its sustainability. They are ‘statistical constructs which support decision-making by revealing trends in data’ (Dillon et al., 2014). Thus, the last fifteen years have seen an international proliferation of assessment methods based on sets of indicators to assess various issues under one or more dimensions of sustainability (over 200 identified, see Rosnoblet et al., 2006) or to evaluate a specific problem (Bockstaller et al., 2009a).
Based on this literature review, we technically define indicators as in Gras et al. (1989) as variables (qualitative/quantitative data observed, measured or calculated from other variables) which supply information on other variables (criteria) which are more difficult to get access to, and can be used as a benchmark to make a decision, while we understand methods as procedures for the assessment of sustainability through the definition and the calculation of indicators. Besides, placing the focus at farm level, various levels of indicators can be considered on which clarifications are necessary. While individual indicators are built from raw/input data, these individual indicators may be aggregated to form aggregated indicators. Composite indicators are then the combination of individual or/and aggregated indicators representing different dimensions of sustainability (Saisana and Tarantola, 2002; Nardo et al., 2005). Figure 1 illustrates these concepts.
Figure 1: From raw data to composite indicators: an illustration
Source: the authors
In concluding our remarks on measuring agricultural sustainability, we refer to Figuières et al. (2007) who suggest that assessing the sustainability of a given sector (e.g. agriculture) without considering the rest of the economy is not relevant. The authors also raise the issue of assessing sustainability through the analysis of single (or synthetic) scores of sustainability built on an aggregation or weighting basis, indicating that doing so means that the different components of sustainability (e.g. environmental, economic, social) are implicitly acknowledged as fully substitutable. In order to eliminate this highly questionable issue the authors recommend favouring assessment methods based on the analysis of three scores, one for each sustainability component.
Combination Aggregation
Amount of greenhouse gas emissions
Amount of CO2
emissions Amount of CH4 emissions Amount of N2O emissions Aggregated
indicator Individual indicator
Fossil fuel
consumption Energy needed for input Time presence of animals/year Data Composite indicator Type of livestock Number of livestock Amount of nitrogen i Amount of mineral nitrogen Nitrogen balance
Indicator of greenhouse gas emissions and nitrogen
Land used
2.3 Various scales of sustainability
Sustainability can be screened at different scales, such as global, local, sector-specific, individual (farm or household) and plot. The issue of scaling can also be related to spatial scales and to temporal scales. The scale through which agricultural sustainability is analysed depends on the objectives being pursued and the concerns being addressed (e.g. see Hrubovcak et al., 1999). For instance, issues such as global warming arise at the global level as all countries share the same atmosphere. This calls for monitoring and policy responses at this level. To that end, a wide range of international sustainability indicators exist (e.g. Millennium Development Goals Indicators, EU Sustainable Development Indicators (SDI), OECD Green Growth Indicators and agri-environmental indicators) (Cooper et al., 2009). These ‘macro’ indicators are measured at the global or national level. Other questions may arise at the ‘meso’ scale, such as for instance the case of water quality that must be analysed at the watershed level since the improvement of the quality of a water body cannot compensate pollution in another watershed (Pingault, 2007). Thus ‘meso’ indicators are defined to provide relevant information at the regional or local level.
Nevertheless, an action undertaken at a given level can help address one or more goals, sometimes defined at different levels. The calculation of nitrogen balance makes sense at the ‘micro’ level of the individual farm, where fertilisation strategies are defined. But the information gathered on nitrogen fertilisation can contribute both to improving the water quality at the ‘meso’ level and the reduction of greenhouse gas (GHG) emissions (‘macro’ level) (Pingault, 2007).
This makes the individual level the most important spatial unit in terms of implementation of sustainable actions, as farmers operate at this scale and management decisions can be directly implemented. Further, the farm level approach increases the spatial accuracy, which is pinpointed as a main challenge in other quantification approaches (e.g. Burkhard et al., 2009). Finally, the farm is the legal unit for legislation purposes and the economic unit that receives payments for externalities within the CAP framework and as such the predominant level at which most policies are directed (OECD, 2001). The international initiative ‘Sustainability Assessment of Food and Agriculture systems’ (SAFA) by the Food and Agriculture Organisation (FAO) is also applied at the individual level. The initiative has developed 118 indicators of four dimensions of sustainability (good governance, environmental integrity, economic resilience and social well-being) (FAO, 2013b). They can be applied to all stakeholders in the food and agriculture supply chains, that is to say ‘companies or small-scale producers, involved with the production, processing, distribution and marketing of goods’ (FAO, 2013a). Difficulties in measuring farm-level sustainability remain, (mainly due to data limitations) and some argue that precise measurement is impossible as it is site-specific and dynamic (Dillon et al., 2014). In relation to farm-level data at the European scale, FADN is a good starting point as data are collected on a yearly basis although some information is collected over shorter timescales (e.g. input/output prices, climatic events) or over longer timescales (e.g. changes in farm structures, farmland habitats). Besides, in its document on the common evaluation framework of rural development programmes for the period 2007-2013, the European Commission (2010c) recommends data collection at an individual (i.e. farm) level. The document also notes however, that data collected by asking farmers directly for economic information may be less robust than invoice verified data. This presents a significant challenge for the FLINT project to enrich the FADN database with good quality data on all sustainability aspects. Meanwhile, within the context of agricultural sustainability assessment Figuières et al. (2007) suggest that not only the farm-level should be considered but also the existing interactions among farms and their local/global environment. In addition, according to Sadok et al. (2008), ‘knowledge and research from relevant disciplines must be integrated while handling a mixture of multiple long-term, short-term, interacting and potentially conflicting goals, depending on the scale on which sustainability is considered (farm, landscape, region, nation, group of nations or global)’.
each dimension is underpinned with sub-themes and suitable indicators. The indicators used may cover the whole range from raw data (amount of nitrogen fertilizer) to composite indicators (GHG-emissions) depending on the sustainability topic at hand.
The generation of sustainability indexes, e.g. a sustainability index for each dimension, are useful to communicate the overall sustainability direction of individual indicator results, while trading off transparency and putting considerable challenges on aggregation methods. A combined presentation of both sustainability indexes and indicator results, and a transparent description of indicator calculations and aggregation methods, are therefore recommended.
Actions affecting sustainability are carried out by individuals. This speaks for a monitoring of effects at the level of the individual (e.g. the farmer). However, results from such monitoring should not be interpreted in isolation but together with ‘macro’ and ‘meso’ results from higher spatial scales, e.g. for administrative units as provided by the Common Monitoring and Evaluation Framework, and whole economy results in order to come to overall conclusions with regard to sustainability.
3 DESIGN AND SELECTION OF
SUSTAINABLE FARM LEVEL
INDICATORS
3.1 Typology of sustainability indicators
Diverse theoretical approaches concerning the roles, challenges and outcomes of indicators for sustainable development have developed over time. Moreno-Pires and Fidélis (2012) described the traditional opposing groups of sustainability indicators: (i) the ‘technical’ or ‘expert-oriented’ approach (e.g. Bossel, 1999; Ramos et al., 2004; Tasser et al., 2008) in which indicators are used for planning, decision making, and policy evaluation; and (ii) the ‘participatory’ or ‘citizen-oriented’ approach (e.g. Innes and Booher, 2000; Gahin et al., 2003; Fraser et al., 2006) in which impacts of sustainability indicators are viewed at the community level. The first group of indicators is considered here.
Bockstaller et al. (2007) identify two groups of approaches which are distinguished by their concept of sustainability: (i) the goal-oriented approach based on a set of themes and objectives addressing abiotic (air, soil, water) and biotic (species, ecosystem) environmental components, functions or impacts; and (ii) the property-oriented approach based on systemic properties e.g. adaptability, security.
Here we use the classic typology based on the three sustainability pillars: environmental indicators; economic indicators; social indicators.
3.1.1 Environmental indicators
The ‘indicator explosion’ (Riley, 2001) is particularly evident for the environmental dimension. For the last 20 years, a plethora of initiatives have been proposed with a very broad array of indicators (Rosnoblet et al., 2006). Bockstaller et al. (2008a) explain this in terms of ‘the growing concern for environmental issues and sustainability’. Literature reviews are available for sustainability assessment methods based on indicators (van der Werf and Petit, 2002; Géniaux et al., 2009; Singh et al., 2009), for some specific themes, like pesticides (Reus et al., 2002; Devillers et al., 2005; Feola et al., 2011), for nitrogen (CORPEN, 2006; Buczko and Kuchenbuch, 2010) or biodiversity (Dennis et al., 2009; Bockstaller et al., 2011). Furthermore Bockstaller et al. (2009a) propose a review of assessment methods based on indicators. Other authors propose various classification systems of indicators. The goal of this section is to provide an overview of different indicator classifications.
3.1.1.1 Aggregation level
Girardin et al. (1999) distinguish simple indicators (indicators that are based on one measured or modelled variable), and composite indicators (indicators resulting from the aggregation of several
applied, it excludes indicators resulting from the arithmetical combination (addition, product) of variables of the same dimension, for example nitrogen budget or percentage of semi-natural area. Neither are impact indicators of Life Cycle Analysis (LCA) (e.g. global warming potential) strictly composite indicators. They are based on the aggregation of several emissions or resource consumption transformed by means of impact factors based on scientific data (e.g. emissions of GHG are transformed to CO2 equivalents). As explained previously, referring to the Nardo et al. (2005) definition, we suggest reserving the term composite for the combination of indicators addressing different environmental themes, like water quality and biodiversity, for which a simple addition is not possible. Furthermore, composite indicators may also involve the aggregation of indicators across the three dimensions of sustainability.
3.1.1.2 Nature of the indicator
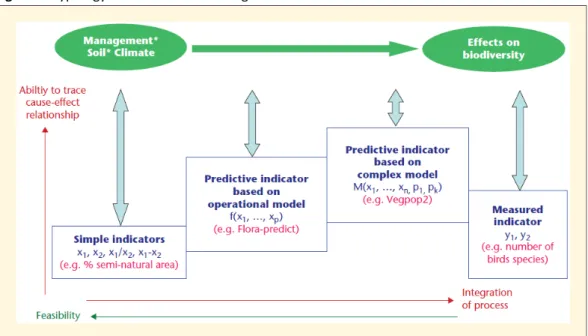
As already pointed out, there may be very different indicators within simple and composite indicators. Therefore, Bockstaller et al. (2011), instead of considering only the aggregation level, consider also the nature or structure of the indicator (see Figure 2): they propose three categories for environmental indicators addressing a single theme : (i) simple indicator based on a causal variable or a simple combination of variables (sum, product, ratio); (ii) predictive indicators based on model output that can be operational (with a reduced and available number of input variables) or complex (from the research point of view, without considering the number and availability of input data); and (iii) measured indicators based on field measurement or observation.
Indicators based on a single management variable or simple combination of variables (e.g. input – ouput, input/output) belong to the groups of simple indicators and result in most cases a poor predictive quality whereas measurement indicators may provide more precise information about the state or the impact, without providing information on the causes. Predictive indicators are useful for ex-ante assessment and to relate effect to cause.
Figure 2: Typology of indicators according to their nature
Source: Bockstaller et al. (2011)
Many simple indicators based on management data are available at farm level (e.g. IDEA method in France, see Zahm et al., 2008), and measured indicators at watershed or regional level (e.g. water quality indicators) are available. Predictive indicators such as GHG emissions and ammonia pollution are less common. This is the same for the theme of biodiversity (Bockstaller et al., 2011).
3.1.1.3 System boundaries
The LCA approach offers more than a simple indicator list. It can be considered as a methodological framework based on a rigorous system definition addressing not only direct impacts due to the production process, but also indirect impacts linked to the input production in the upstream cycle and impacts due to the consumption, use of product and waste management in the downstream cycle (Brentrup et al., 2001). Some authors make a clear separation between LCA and other methods based on indicators. On the one hand LCA may use algorithms for assessing direct impact that are used in other methods, such as nutrient budget (e.g. Halberg et al., 2005). On the other hand, many environmental assessment methods implement an approach close to LCA when they include assessment of indirect impacts. This is often done for the energy consumption theme (e.g. Pervanchon et al., 2002).
3.1.1.4 Position on the cause-effect chain
Several authors differentiate between (i) means-based indicators (van der Werf and Petit, 2002; Payraudeau and van der Werf, 2005), or action-oriented indicators (Braband et al., 2003) using information on farmers’ practices or other causal variables; and (ii) effect-based indicators or result-oriented indicators, based on an assessment of the effect at different stages of the cause-effect chain (see Figure 3).
In relation to biodiversity, some authors distinguish between indirect (means-based) and direct (effect-based) indicators (Clergué et al., 2005). Referring to Hertwich et al. (1997), Bockstaller et al. (2008a) further elucidate the concept of impact shown in Figure 3 by dividing it successively into state/exposure/impact, so that impact means the final effects on human health or on the economy. In LCA, indicators of final impacts are qualified as ‘endpoint impact’ indicators whereas indicators related to the cause-effect chain somewhere between emissions and end-point are ‘midpoint’ indicators (see Figure 3) (Bare and Gloria, 2006; Goedkoop et al., 2009). Inspired from Figure 3, the typology of Lebacq et al. (2013) is based on four categories: means-based, system-state, emission and effect-based, although they recognised that system state indicators are intermediate and can be grouped with emission indicators as in Bockstaller et al. (2008a).
The well known Pressure / State / Response (PSR) (OECD, 1999) and Driving-force / Pressure / State / Impact / Response (DPSIR) (EEA, 2005) frameworks are also inspired by this cause-effect chain (see Figure 4). They were developed to ascertain the relevance of environmental indicators for human activities and their consequences at national level. These frameworks are generalised by some authors to every scale (e.g. Maurizi and Verrel, 2002; see also an example in Géniaux et al., 2009), overseeing criticisms formulated by different authors (Niemeijer and de Groot, 2008a; Pissourios, 2013). One major drawback of these frameworks is the impression of linearity between pressure, state and impact given by the framework, whereas the reality is more complex and closer to a causal network than to a chain. Bockstaller et al. (2008a) point out the ambiguity of pressure, especially in terms of type of indicators as also shown on Figure 4. Pressure encompasses emission indicators which can be measured (e.g. nitrogen content at bottom of the root zone, measured by ceramic cup) or model output (field leaching model) as well as simple indicators based on information from farmers’ management data (e.g. amount of nitrogen input).
Figure 4: The DPSIR framework of environmental indicator analysis
Source: Bottero and Ferretti (2011)
3.1.1.5 Environmental issues of concern/environmental themes
The most obvious way to classify indicators may be in terms of issues of concern, or the themes that they address. These are often organised in indicator frameworks (Alkan Olsson et al., 2009a). Lebacq et al. (2013) group environmental indicators found in the literature into ten environmental themes/topics that focus either on discernible physical aspects of the environment, or on human activities with substantial environmental impact (Pissourios, 2013) and are related to: nutrients, pesticides, non-renewable resources (i.e., energy and water), land management, emissions of GHG and acidifying substances, biodiversity, and physical, chemical, and biological soil quality.
This example encompasses two levels of the cause-effect chain: the first four themes relate to input management, while the others concern the quality of natural resources. This facilitates a reduction in the number of categories. If only themes related to the state of environment or to the impact are addressed, the number increases greatly. For example, for water quality, there are surface and groundwater themes (also marine) related to nitrates, pesticides and other pollutants (Sadok et al.,
2009; Goedkoop et al., 2009). In any case, this is only an example within a broad range of initiatives (Géniaux et al., 2009). However some general groups can be separated between:
(i) local and global impacts (or themes related to local or global impacts) which have consequences on the functional units used to express the indicators (Halberg et al., 2005); (ii) ultimate goal, process to achieve goal and means (Alkan Olsson et al., 2009b); this
classification of themes across sustainability dimensions considers the action chain. A policy is motivated by one or several ultimate goals (e.g. human health) requiring some process in order to achieve it (e.g. balance of environmental function) and means (e.g. protecting environmental compartment).
(iii) goal-oriented framework and system properties-oriented framework (Bockstaller et al., 2007). The former considers themes as goals to achieve (e.g. preserving water quality). The latter addresses themes as system properties like in the approach of Bossel (1999), (e.g. productivity, adaptability, see also López-Ridaura et al., 2005).
3.1.1.6 Operational utility
The DPSIR framework was developed in the context of policy evaluation. Regardless of their position in the DPSIR framework, indicators are always utilised with a specific aim (e.g. to describe the current environmental situation, or to assess the progress towards fixed goals, or to derive advice to help improve the system (see Bockstaller et al., 2008a). In this context, the European Environmental Agency (EEA) has developed a typology of environmental indicators, which is based on their operational utility (see Pissourios, 2013). This typology consists of four classes: (i) descriptive, (ii) performance, (iii) efficiency and (iv) policy-effectiveness indicators. Descriptive indicators are used in order to describe a specific aspect of the environmental situation and are usually presented as a time-series. Performance indicators compare the actual conditions with a specific set of reference conditions, in other words they measure the distance between the current environmental situation and the desired situation. Efficiency or eco-efficiency indicators provide an insight into the efficiency of products and processes, in terms of the resources used and the emissions and waste generated per unit of desired output. Last but not least, policy-effectiveness indicators explicitly relate the actual change in environmental variables to policy objectives.
3.1.1.7 Discussion
This review of indicator typologies reveals that any classification of indicators cannot remain one-dimensional. Several dimensions should be examined.
As in many other initiatives, data within the FLINT project may be categorised in terms of thematic areas. The availability of data may restrict the type of indicators to simple indicators, i.e. indicators based on one or a simple combination of variables of the same dimension. Predictive indicators would require more data, especially on soil and climate. Simple indicators may be aggregated using knowledge on processes to generate proxy emissions or state indicators, which can be related to environmental performance. In any case, information should be provided on the scientific soundness (e.g. predictive quality), feasibility and utility of candidate indicators. More precise criteria can be found in Niemeijer and de Groot (2008a) and Bockstaller et al. (2009a).
3.1.2 Economic indicators
As suggested by van Cauwenbergh et al. (2007), agriculture should ‘provide prosperity to the farming community’. In this context, economic sustainability is generally viewed as economic viability. Here we
the farmer, or (ii) across generations. The latter is related to the durability, i.e. the capacity of a farm to be transferred to a successor. This aspect is also sometimes considered as part of social sustainability. The literature agrees that economic viability mainly (or only) consists of profitability and productivity. However, some authors also consider autonomy.
3.1.2.1 Profitability and productivity
Profitability is calculated by comparing revenue and cost, either as a difference or as a ratio. Sadok et al. (2009) and Hennessy et al. (2013), for example, use gross margin which is a difference between revenue and operational cost as a measure of profitability. However, farm income is also used (e.g. van Calker et al., 2004; Gómez-Limón and Sanchez-Fernandez, 2010; Lebacq et al., 2013). Hennessy et al. (2013) suggest also considering whether the farm has ‘the capacity to remunerate family labour used on the farm at the average agricultural wage and the capacity to provide an additional five per cent on non-land assets’. Johnson et al. (2007) describe the relevance of net value added as economic indicator and the distribution of net value added among the relevant stakeholders (remuneration for the farmer and the paid factor costs (land, labour, capital)).
Productivity is a measure of the ability of the factors of production to generate output. It is generally measured as a partial productivity indicator which is a ratio of output to one input: for example Hennessy et al. (2013) calculate productivity of labour (as income per unpaid labour unit) and productivity of land (gross output per hectare). Other methods have been suggested in the management and economic literature, to account for the possibility of input substitution or output substitution: the more comprehensive measure of total factor productivity (TFP) which is a ratio of all outputs aggregated to all inputs aggregated; and the concept of technical efficiency which assesses whether a farm could increase its output without increasing its inputs (see Latruffe, 2010). In the sustainability literature, less complex indicators are used such as the indicator of economic efficiency (relating operational costs to gross output) used by Sadok et al. (2009).
As highlighted by Lebacq et al. (2013), profitability and productivity indicators are mainly quantitative indicators, and are expressed in monetary terms or as ratios. Some authors nevertheless use reference scales (such as the French IDEA method, see Vilain, 2008).
3.1.2.2 Autonomy
Autonomy is essentially a measure of one of the basic properties of every system: freedom (Bossel, 1999). For this reason, autonomy may also be seen as a social indicator. Autonomy can be viewed in terms of inputs (Lebacq et al., 2013). The idea behind this view is that farms that rely less on external inputs, such as feed or fertilisers, are less sensitive to input availability and price fluctuations. Autonomy is also viewed in terms of financing, in other words with regard to the pressure of debts. For example, van Cauwenbergh et al., (2007) discuss a solvency indicator (the ratio of optimal debt to farm equity), or Lien et al., (2007) discuss a qualitative indicator relating to technical insolvency, that is to say ‘when the farm owner’s equity falls below zero’.
Another aspect of autonomy is the diversification of income, whether farm income or household income. Farm income can be diversified by implementing non-agricultural activities on the farm such as direct sales, processing or agritourism (this is sometimes called structural diversification and is called other gainful activities in FADN), while the household income can be diversified by off-farm employment held by farmers or their families (this is called income diversification) (Meert et al., 2005). As early as 1982, Hill wrote that ‘concern over the income of farmers has been a fundamental but ill-defined component of agricultural policy. Current income from farming is only a partial measure of the potential spending power of farmers: many have off-farm sources of income which must be taken into account when, for example, assessing poverty. A prime requirement appears to be a more precise statement of the aims of income policy and the use of income measures most appropriate to the circumstances’ (Hill, 1982). O’Brien and Hennessy (2007) stressed that for many Irish farms, their sustainability was ‘dependent on farmers and their spouses’ ability to secure employment off the farm’.
Subsidy dependence is another aspect of autonomy. If farms are highly dependent on public support, any policy reform could put farm sustainability at risk. Several indicators are used in the sustainability literature. For example, Dillon et al. (2009) use direct payments as a percentage of farm gross output,
and market return calculated as family farm income minus direct payments, whereas Sadok et al. (2009) relate direct subsidies to margin. Vrolijk et al. (2010) use an indicator for the viability of farms to express the extent to which farms can cope with a reduction of direct payments. A farm is categorised based on whether a farm has a positive or negative income and cash flow.
3.1.2.3 Discussion
Compared to the literature on environmental sustainability, there is considerably less literature on economic sustainability and this has not been plagued by the indicator explosion problem. While it is common to calculate farm profitability, productivity or efficiency in management or economics literature (see e.g. Latruffe, 2010), farm profitability is less often calculated with a view to assessing sustainability and is generally part of a wider assessment of global sustainability (including not only economic sustainability but also environmental and social sustainability), and is published in non-economic journals (e.g. Thomassen et al., 2009; Dolman et al., 2012; Dolman et al., 2014; van Calker et al., 2004; van Cauwenbergh et al., 2007; Sadok et al., 2009; Lebacq et al., 2013).
Economic and environmental indicators also differ in the scale of implementation. Firstly, most often economic indicators are measured at the farm level (or at crop or activity level), while many environmental indicators are measured at a smaller scale such as at plot level or at a larger scale such as at catchment level. Secondly, a larger scale such as the regional level is commonly used for economic indicators, for example when the distribution of farm income is assessed across farms in a region (e.g. Allanson, 2006). This equity assessment may however also be used to assess social sustainability (e.g. the French initiative INPACT, see Inpact, 2003).
It should be stressed here that farm income was (and still is) the first indicator of economic sustainability to be measured widely at the farm level, due to the implementation of CAP which had the primary objective of supporting farm income. FADN was created to monitor the level of farm incomes.
Another point to note is that, while the literature assessing economic sustainability uses profitability and autonomy indicators, the latter are in fact embedded in the former. Future profitability depends on external shocks and would therefore be less affected when there is a high degree of farm autonomy. Hence, autonomy indicators may be viewed as proxies for future profitability. This ‘future’ dimension is considered for example by Hansen and Jones (1996) and Lien et al. (2007), who stress that it is not possible to observe sustainability since it entails future outcomes.
In this context, and going beyond autonomy at farm level, it is the farms’ adaptability or resilience that is really important. Bossel (1999) notes that adaptability is a fundamental property of a system. Lien et al. (2007) define resilience in farming as ‘the capacity of a farm business to survive various risks and other shocks’. More generally, López-Ridaura et al. (2005) explain that ‘the degree to which a system is sustainable will depend on its capabilities to produce, in a state of stable equilibrium, a specific combination of goods and services that satisfies a set of goals (the system is productive), without degrading its resource base (the system is stable) even when facing “normal” (the system is reliable), “extreme” and “abrupt” (the system is resilient) or “permanent” (the system is adaptable) variations in its own functioning, its environment or co-existing systems’.However in the literature, the potential of a farm to reach or to maintain a certain level of economic sustainability in the long run is very rarely accounted for. Economic sustainability should nonetheless be considered in terms of current management decisions that can ensure sustainability in the future. For example, indicators could relate to instruments that protect the farm activity from risk and uncertainty e.g. insurance, or to decisions to ensure stable sales of output (e.g. production contract, niche production with high value added). A couple of exceptions in the literature are Gómez-Limón and Sanchez-Fernandez (2010), who used the share of insured area as an indicator of economic sustainability, and the FAO SAFA initiative (FAO, 2013b) which proposes the use of safety net indicators and an indicator of risk management (although both are not explicitly defined, only guidelines are provided).
3.1.3 Social indicators
Social sustainability relates to people. Lebacq et al. (2013) clearly defined social sustainability based on two categories of people:
(1) social sustainability that matters at the level of the farm community; this is related to the well-being of the farmers and their families;
(2) social sustainability that matters at the level of society; this is ‘related to society’s demands, depending on its values and concerns’.
3.1.3.1 At the level of the farm community
Regarding the first category of social sustainability, in their review of literature Lebacq et al. (2013) group the indicators found into three main categories:
(i) education;
(ii) working conditions; this is measured by working time, workload (including pain), and workforce; (iii) quality of life; this is measured by isolation and social involvement.
Other aspects of well-being are however excluded from this typology, such as the physical health of workers (e.g. van Calker et al., 2007), although this can be viewed as a consequence of working conditions.
For this level of social sustainability (i.e. at the farm community level), van Cauwenbergh et al. (2007) considered only quality of life but separated it into (i) physical well-being, whose indicators relate to labour conditions and health, and (ii) psychological well-being, which includes not only education, but also gender equality, family access to infrastructures and services, and the farmer’s feeling of independence.
3.1.3.2 At the level of society
In the second category of social sustainability, similarly to above, Lebacq et al. (2013) group the indicators found in the literature into three main categories:
(i) multifunctionality; this includes quality of rural areas, contribution to employment and ecosystem services;
(ii) acceptable agricultural practices; this includes environmental impacts and animal welfare; (iii) quality of products; this includes food safety and quality processes.
Van Calker et al. (2007) consider the contribution to the rural economy, which is less strict than the contribution to employment but could also be included in Lebacq et al.’s (2013) quality of rural areas. Van Cauwenbergh et al. (2007) add equity, as well as heritage, cultural, spiritual and aesthetic values. As underlined by Cooper et al. (2009), farmers keep traditions alive. Also, as mentioned above, the succession theme is sometimes included in the social sustainability dimension. For example, Gómez-Limón and Sanchez-Fernandez (2010) use the intergenerational continuity in agriculture, and Dillon et al. (2009) consider demographic viability.
3.1.3.3 Discussion
Unlike environmental and economic indicators, social indicators are often qualitative. They are difficult to quantify as they are often subjective. This difficulty gives rise to a number of steps which must be undertaken, such as the need for clear definition of specific indicators, the design of scoring systems and the interpretation of the indicator. Indicators relating to the farm community are often based on farmers’ self evaluation through surveys or interviews, although many studies aim to ensure accuracy and precision in these assessments. For example, Sadok et al. (2009) choose to use the social indicator of physical constraints. For this, they resort to qualitative estimation based on information regarding frequency of machine vibration, repetitiveness of actions, frequency of heavy load manipulation, and allergies and noise level. In contrast, indicators relating to society may be assessed by experts (e.g. van
Calker et al., 2007). The indicator of quality of life in rural areas can be given as an example. As explained by Pissourios (2013), such indicators can be measured by two complementary approaches: (i) the quantitative approach which relies on collecting observable and measurable indicators that are then aggregated into a composite indicator, and (ii) the qualitative approach which is based on peoples’ perceptions of the quality of their lives, i.e. measuring the quality of life that is ‘psychologically experienced’, and relying on interviews. The latter approach is used in Kazana and Kazaklis (2009) for Greek rural areas.
A second point to note, referring to Lebacq et al. (2013), is that society’s demands are constantly changing, and so is the range of social indicators. This is also stressed by Lyytimäki and Rosenström (2008) who indicate that ‘ecological thresholds and social transformations can produce surprises and new issues that cannot be included within existing frameworks, so those frameworks have to be constantly updated and adapted. As explained above for environmental indicators, this could explain why social indicators are also affected by the indicator explosion.
A final note is that, while environmental indicators and economic indicators can stand alone, this is not always the case for social indicators at the societal level. Agriculture contributes to the quality of life in rural areas in terms of economic contribution (e.g. the level of farm output is crucial for the viability of upward and downward industries) and environmental contribution (e.g. creation of landscape, reduction of pollution). This can be seen in Figure 5 which illustrates the case of quality of life in rural areas. It is sometimes difficult to identify the sustainability pillar to which a specific indicator belongs: for example ecosystem services may be part of environmental sustainability but also social sustainability; the suitability of the farm for succession may relate to economic as well as social sustainability. Hence, a general conclusion is that the social sustainability of farms is the dimension that would need the most thought and consideration in the future.
Figure 5: Dimensions of quality of life in rural areas