HAL Id: hal-02457985
https://hal.archives-ouvertes.fr/hal-02457985
Submitted on 6 Feb 2020HAL is a multi-disciplinary open access
archive for the deposit and dissemination of sci-entific research documents, whether they are pub-lished or not. The documents may come from teaching and research institutions in France or
L’archive ouverte pluridisciplinaire HAL, est destinée au dépôt et à la diffusion de documents scientifiques de niveau recherche, publiés ou non, émanant des établissements d’enseignement et de recherche français ou étrangers, des laboratoires
inteGrating 5G Networks (WONG5) Document Number
D5.3 Experimental testbed of post-OFDM Waveforms
Rafik Zayani, Sylvain Traverso, Hmaied Shaiek, Christophe Alexandre, Daniel
Roviras, Jean-Baptiste Doré
To cite this version:
Rafik Zayani, Sylvain Traverso, Hmaied Shaiek, Christophe Alexandre, Daniel Roviras, et al.. Wave-forms MOdels for Machine Type CommuNication inteGrating 5G Networks (WONG5) Document Number D5.3 Experimental testbed of post-OFDM Waveforms. [Research Report] Cnam Paris. 2019. �hal-02457985�
Waveforms MOdels for Machine Type CommuNication
inteGrating 5G Networks
(WONG5)
Document Number D5.3
Experimental testbed of post-OFDM Waveforms
Contractual date of delivery: 12/10/2019
Project Number and Acronym: ANR-15-CE25-0005, WONG5
Editor: Rafik Zayani (CNAM)
Authors: Rafik Zayani, Hmaied Shaiek, Daniel Roviras,
Christophe Alexandre (CNAM), Sylvain TRAVERSO (TCS)
Participants: CNAM / TCS
Workpackage: WP5
Security: Public (PU)
Nature: Report
Version: 1.1
Abstract:
This deliverable presents experimental results to evaluate the capability of the most promising post-OFDM waveforms (WFs), i.e. WOLA-post-OFDM, BF-post-OFDM and f-post-OFDM, to accommodate 5G requirements while focusing on the energy efficiency. Testbed experiments are done in a realistic laboratory-like environment with configurable universal software radio peripherals (USRPs) based software defined radio (SDR) prototype.
Keywords: Testbed, SDR, USRP, multicarrier Waveforms, CP-OFDM, WOLA-OFDM, BF-OFDM,
Document Revision History:
Version Date Author Summary of main changes
0.0 15.10.2018 Rafik Zayani (CNAM) Initial structure of the document
1.0 22.10.2016 Rafik Zayani (CNAM) CNAM contribution
1.1 13.09.2019 Sylvain Traverso (TCS) TCS contribution
1.2 18.09.2019 Rafik Zayani (CNAM)
Hmaied Shaiek (CNAM) Daniel Roviras (CNAM)
CNAM revision
1.3 20.09.2019 Sylain Traverso (TCS) TCS revision 1.4 03.10.2019 Jean-Baptiste Doré (JBD) CEA revision
Executive Summary
Deliverable D5.3 presents experimental results for evaluating the capability of post-OFDM waveforms (WFs) to accommodate 5G requirements. Testbed experiments are done with an implementation of cyclically prefixed orthogonal frequency division multiplexing (CP-OFDM) and its most promising enhancements, i.e., weighted overlap and add based OFDM (WOLA-OFDM), block-filtered OFDM (BF-OFDM) and filtered OFDM (f-(WOLA-OFDM), with configurable universal software radio peripherals (USRPs) based software defined radio (SDR) prototype. On one hand, we provide details and deign guidance to improve energy efficiency and robustness of the studied waveforms through new approaches of digital predistortion (DPD) and peak-to-average power ratio (PAPR) reduction in presence of RF power amplifier (RF PA). In particular, we focus on the mitigation of in-band and out-of-band non-linear distortions and their effects on power spectrum density (PSD) and bit error rate (BER), respectively. It has been demonstrated that the combination of PAPR reduction and DPD allows the transmitter to significantly improve the spectrum localization without sacrificing the in-band and out-of-band waveform quality, while achieving high power efficiency, thus operating the PA very close to its saturation region, as well.
On another hand, we address the impact of the lack of synchronism between transmitters on the performance of the selected waveforms, which is of special relevance for future 5G MTC applications. Experimental results show that WOLA-OFDM, BF-OFDM and f-OFDM would permit the accommodation of 5G requirements when RF PA issues are tackled. In some specific scenarios, ideal spectrum utilization can be realized by these waveforms, using only one tone as guard band while keeping good energy efficiency.
Index
1 Introduction ... 6 1.1 Context ... 6 1.2 Objectives ... 6 2 Experimental setup ... 7 2.1 WFs parameters ... 7 2.2 PA 1W based demonstrator ... 7 2.3 PA 10W based demonstrator ... 8 3 PA 1W identification ... 103.1 Polynomial model for PA- AM/AM & AM/PM identification ... 10
3.2 AM/AM (dB/dB) & AM/PM (dB/rad) identification ... 10
3.3 Experimental results & model validation ... 12
4 PA 1W Effects on selected WFs ... 13
4.1 Power Spectral Density (PSD) ... 13
4.2 Bit Error Rate (BER) ... 15
4.3 Mitigation of nonlinearity effects ... 16
5 PA 10W identification ... 24
6 PA 10W Effects on selected WFs ... 25
6.1 Power Spectral Density (PSD) ... 25
6.2 Bit Error Rate (BER) ... 26
6.3 Mitigation of nonlinearity effects ... 27
7 Multi-user asynchronous access ... 33
8 Conclusion ... 35
References ... 36
1 Introduction
1.1 Context
In the context of WONG5 project, notable waveforms have been introduced and investigated to address the major limitations of the traditional CP-OFDM in challenging new spectrum use scenarios, like asynchronous multiple access, as well as the support of mixed numerology which allows the service to choose between a set of supported subcarrier spacing (SCS) and symbol duration.
In fact, following the studies carried out in the framework of the other work-packages, especially of work-package 2 concerning the comparative study of many candidate post-OFDM waveforms, some waveforms seem to be more suitable than others with regard to the standardization specifications issued by 3GPP in December 2017, which are mainly dedicated to 5G-NR eMBB and Fixed Wireless Access (FWA) [3GPP17]. These specifications guided us in the choice of a subset of waveforms that will be evaluated at the demonstrator level. The WF candidates studied are: CP-OFDM, WOLA-OFDM, BF-OFDM and f-OFDM.
1.2 Objectives
D5.3 presents testbed experiments done with an implementation of the selected WFs, with configurable universal software radio peripherals (USRPs) based software defined radio (SDR) prototype [USR29]. These experiments are crucial in order to convince evidences of the selected multicarrier waveform technology feasibility using real-world environment imposing some RF imperfections: RF power amplifier nonlinearities, IQ Imbalance and Mirror-Frequency Interference, Phase noise and Mixer and A/D converter nonlinearities. As described in the previous deliverable (D5.2), the link performance results are provided for two cases: down-link (DL) and uplink (UL) following the experimentation scenarios. Case 1 corresponds to interference free DL with nonlinear amplification and case 2 defines an asynchronous UL case.
Therefore, these cases are envisaged to address the following contributions:
1. We present testbed experiments done in a realistic laboratory-like environment using real-world RF power amplifier (PA). We characterize the RF PA under test as well as its corresponding digital predistortion (DPD).
2. We study the PAPR reduction of the selected MWFs time-domain signals using tone reservation (TR) [WAT05] and selective mapping (SLM) [CUT12], which are deeply studied in literature. Since BF-OFDM has a different structure compared to CP-OFDM and WOLA-OFDM, we introduce modified TR and SLM techniques that are more adequate to BF-OFDM than the classical ones. In particular, we focus on the combination of the proposed PAPR reduction and DPD techniques in order to mitigate the in-band and out-of-band nonlinear distortions caused by the real RF PA while improving the energy efficiency. 3. Last, we study, through the developed testbed, the capability of the 5G waveform of
handling multi-user signals when there is imperfect synchronization in time domain. We provide further discussions and comparisons of the selected waveforms CP-OFDM, WOLA-OFDM, BF-OFDM and f-OFDM, with corresponding parameter selections. More precisely, we consider the coexistence of two users which are asynchronously transmitting in adjacent bands using the same transmit power per subcarrier. We also provide insights on the impact of several important system parameters, e.g. guard
2 Experimental setup
Using the testbeds presented in the previous deliverable (D5.2), extensive measurements were performed in a realistic laboratory-like environment in order to evaluate the performance of the selected WFs. We recall that two different testbeds have been developed in the context of the framework of WONG5 work-package 5. The first one called “PA-1W based demonstrator” developed at CNAM while the second “PA-10W based demonstrator” developed by THALES.
2.1 WFs parameters
Testbed setups and WF parameters are provided in Table I.
Table 1: Testbed setups and WF parameters
General
Data frequency band 2.0020 – 2.0031 GHz
Sampling rate (Fs) 10 MHz
Subcarriers/RB 32
Symbol duration 212 µs
Frame size 1000 symbols/frame
Data constellation 16-QAM
CP-OFDM/WOLA-OFDM
MFFT 2048
CP length 72
Windowing Meyer Root Raised Cosine
Window length (WTX, WRX) (20,32) BF-OFDM M 64 N 64 NCP 4 K 4
Prototype filter PHYDYAS & Gaussian – BT=1/3
f-OFDM
MFFT 2048
CP length 72
Filter length 1024
2.2 PA 1W based demonstrator
The CNAM demonstrator is based on configurable universal software radio peripherals (USRPs) based software defined radio (SDR) prototype (see D5.2). The testbed environment is shown in Fig. 1. This testbed uses a real-world RF power amplifier, which is a solid-state power amplifier from Pasternack with product ID: PE15A4017 [PAS17].
Figure 1: 1W Testbed for experimental implementation.
2.3 PA 10W based demonstrator
The 10W demonstrator is based on the Weblab setup [LAN15] [CHA18] provided by the Chalmers University of Technology and National Instruments. This setup is open and can be remotely accessed at www.dpdcompetition.com.
Figure 2: RF Weblab description.
The measurement setup [LAN15] is based on a PXI Chassis (PXIe-1082) with embedded host PC from National Instruments. The chassis is equipped with a Vector Signal Transceiver (PXIe-5646R VST) with 200 MHz instantaneous bandwidth. The signal generated (center frequency 2.14 GHz) from the VST transmitter is fed to a linear driver amplifier before the GaN PA DUT (Cree CGH40006-TB, testboard for the transistor CGH40006P). A 30 dB RF attenuator is placed at the DUT output from which the
the instruments and to down- and upload datafiles at request from the users. The DUT is supplied by a power source module (PXI-4130) which also measures the current consumption of the power amplifier.
Figure 3: 10W Testbed for experimental implementation.
The peak output power level from the PA is limited to approximately 6 W, by putting a restriction on the allowable output power from the signal generator. The settings in the signal analyzer (reference level and input attenuation) are set in a such a way as not to distort the measured signal even for the highest peak power level.
3 PA 1W identification
Measurements using the CNAM testbed introduced in section 2.2 were performed in order to evaluate the performance of studied multicarrier waveforms in presence of nonlinear RF PA. They are built around a system setup that, first, identifies a behavioral model of the PA in subsequent steps, and then validates it by comparing simulated results and the measured ones.
The test signal used to identify the RF PA under test was an OFDM one of 10 MHz bandwidth and PAPR of 11 dB at CCDF of 10-3, modulated at 2 GHz. An allocation of about 1.1 MHz over the 10MHz bandwidth from 2.0020 to 2.0031 GHz was considered. This arrangement allows us a clean observation bandwidth of three times the main data bandwidth, which is sufficient to see all spectral components generated by the amplifier under test. The validation and identification signals were different but of same bandwidth and PAPR. It is worth mentioning that only CP-OFDM waveform was considered for identification while all studied waveforms were served for validation.
3.1 Polynomial model for PA- AM/AM & AM/PM identification
A popular choice for modeling these nonlinear PA characteristics is the standard polynomial formulation and imposing the quasi-static constraint results in the low-pass model that referred to as an odd-even model [LAN15]. In this investigation, we consider to identify separately the AM/AM and AM/PM using two polynomial models as shown by equations 1 and 2.
|𝑢(𝑛)| = ∑𝑄𝑝=1𝑎𝑝𝜌𝑝 (1)
∠𝑢(𝑛) = ∑𝑄𝑝=1𝑏𝑝𝜌𝑝 (2)
where 𝑄 is the number of coefficients, 𝑎𝑝 and 𝑏𝑝 are the real-valued polynomial coefficients,
𝑢(𝑛) is the amplified signal and 𝜌 is the modulus of the input signal (𝑥(𝑛)). Usually, 𝑐𝑝 are found in
the time domain, either on a sample-by-sample basis using algorithms like least mean squares (LMS) [ZHO07] or least squares (LS) [DIN04].
3.2 AM/AM (dB/dB) & AM/PM (dB/rad) identification
A digital representation of the PA output envelope is made available to the baseband processing unit using simplified testbed architecture (see Fig. 2). The PA output is attenuated, down-converted to IF and converted to baseband using USRP Rx module (see Fig. 2). Then, the data is filtered using a bandpass filter to reject the unwanted hardware (HW) imperfections like DC component and IQ imbalance. The bandwidth of this filter should at least be three times the transmit data bandwidth that will allow us to observe spectral components generated by nonlinearities up to degree three.
Figure 4: Simplified testbed architecture to identify the PA AM/AM & AM/PM
The AM/AM and AM/PM characteristics indicate the relationship between, respectively, the modulus and the phase variation of the output signal as functions of the modulus of the input one. Then, the amplified signal 𝑢(𝑛) can be written as
𝑢(𝑛) = 𝐹𝑎(𝜌)exp(𝑗𝐹𝑝(𝜌))exp(𝑗𝜑) (3)
where 𝐹𝑎(. ) and 𝐹𝑝(. ) stand, respectively, for the AM/AM and AM/PM characteristic and 𝜌 and 𝜑 are the modulus and phase of the input signal.
An important condition for proper estimation is that the sequences 𝑥(𝑛) and 𝑢(𝑛) are time-aligned. Various elements (analog and digital) in the experimental testbed introduce arbitrary loop delay for the observed signal. Correlation based techniques can be used to estimate and compensate the delay to the accuracy of one frame that will serve to the PA modeling. It is worth mentioning that due to the external synchronization used for the USRP Tx and USRP Rx modules, the CFO does not exist.
The AM/AM and AM/PM conversion curves of the RF PA under test are shown in Fig. 3. We recall that these curves are found from measurements using the Pasternack PE15A4017 wideband medium PA [PAS17]. The 1dB compression point (P1dB) is also marked on this plot. It is worth to mention that these measurements reflect the key PA specifications, like the typical gain of 27 dB and the 1dB compression point of 29dBm.
Figure 5: AM/AM & AM/PM conversions for the PA under test. The black circle marked on the plots to the 1dB compression point (P1dB)
3.3 Experimental results & model validation
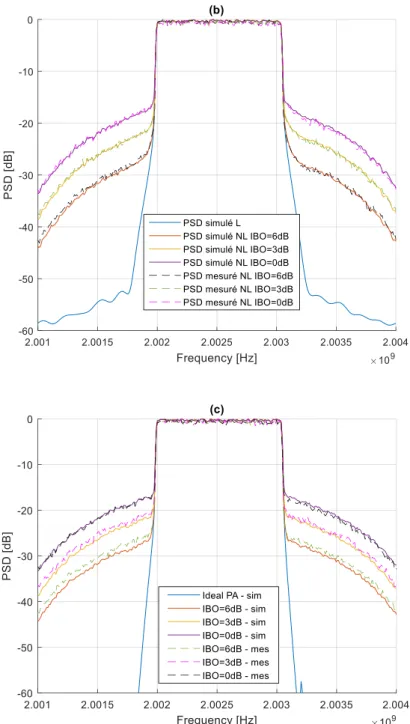
In order to validate our identified PA model, the performance of the three considered WFs, in terms of PSD, using this estimated polynomial model (i.e. simulated using MATLAB) are compared to the measured ones performed using our experimental testbed in conjunction with the real RF PA.
Figs 4.a, 4.b and 4.c show the simulated and measured (observed on Agilent ESA E4405B) spectra of the PA outputs for the three MWFs CP-OFDM, WOLA-OFDM and BF-OFDM, respectively. 𝐼𝐵𝑂 = 𝑥𝐷𝐵 − 𝑠𝑖𝑚 and 𝐼𝐵𝑂 = 𝑥𝐷𝐵 − 𝑚𝑒𝑠 are, respectively, used to indicate simulated and measured results in presence of PA for a given input back-off (IBO) value. 𝐼𝑑𝑒𝑎𝑙𝑃𝐴 − 𝑠𝑖𝑚 denotes results in a linear case. We consider an observation bandwidth of three times the main data bandwidth, centered at one channel bandwidth away from the data bandwidth on either side. According to these results, we can clearly see a very good agreement between simulated spectra and measured ones in the case of all the considered WFs. This can confirm that our PA identification method was efficient and the identified model reflects exactly the actual functioning of the real RF PA.
Figure 6: PA output spectra for (a) CP-OFDM (b) WOLA-OFDM (c) BF-OFDM
4 PA 1W Effects on selected WFs
4.1 Power Spectral Density (PSD)
In order to evaluate the out-of-band distortions caused by the RF PA on the selected multicarrier waveforms, we show in Figs 5.a and 5.b the spectra comparison of the three WFs for, respectively, an IBO of 3dB and 6dB. We note that all waveforms have been strongly affected when a RF PA is used with an IBO=3dB, even the advanced ones (WOLA-OFDM and BF-(WOLA-OFDM). They lose rapidly their good properties of reduced OOB emissions and perform as the CP-OFDM. For IBO=6dB, a gain is performed by these advanced waveforms compared to CP-OFDM. Further, we note a negligible gain for BF-OFDM compared to
WOLA-OFDM, which is due to the better spectrum containment provided by the sub-band filtering used by BF-OFDM.
4.2 Bit Error Rate (BER)
In-band error is measured in terms of the bit error rate (BER) computed at the receiver side (performed by MATLAB). In order to clearly see the effect of our RF PA and without loss of generality, noise is added at this level and its power level (N0) is adjusted to have the desired
𝐸𝑏/𝑁0.
Again, we can see from Fig 6.a that simulated and measured curves are in good agreement in the case of all waveforms. Only the CP-OFDM case is considered to make the presentation clear but same behaviors have been made in cases of WOLA-OFDM and BF-OFDM. These results confirm again the validity of our identified PA model.
We can note further, from results depicted in Fig 6.b, that WOLA-OFDM and BF-OFDM provide the same performance compared to the classical CP-OFDM. This can demonstrate that RF PA nonlinearities cause a serious problem for the post-OFDM WFs. Thus, these imperfections have to be taken into account in the system design and advanced solutions have to be studied in order to have the properties of good frequency localization of post-OFDM WFs.
Figure 8: BER vs Eb/N0, 16-QAM, IBO={0, 3, 6} (a) CP-OFDM (b) different WFs.
4.3 Mitigation of nonlinearity effects
4.3.1. PAPR Reduction techniques
Peak-to-average power ratio (PAPR) indicates the fluctuation of the transmitted signal amplitude. The PAPR of s is defined as the ratio of the highest signal peak power to its average power value on a given time-domain interval. In the following, the time-domain interval has been taken equal to a CP-OFDM symbol duration (M𝐹𝐹𝑇 samples). Hence, It is
given by
𝑃𝐴𝑃𝑅(𝑠) =max0≤𝑘≤𝑀𝐹𝐹𝑇−1[|𝑠𝑘|
2]
𝐸[|𝑠𝑘|2] (3)
A high PAPR means that the transmitted signal will be located, with high probabilities, in the nonlinear and saturation regions of the PA in system. This will affect considerably the system performance while keeping good energy efficiency. In our system, we want to have high power efficiency as well as good performance in terms of spectral localization and robustness to distortion errors. Therefore, reducing PAPR of the transmitted signal is vital for future wireless networks adopting multicarrier waveforms.
Several PAPR reduction techniques have been proposed for OFDM [SEU05]. In this work, we consider tone reservation (TR) [BUL18] and selective mapping (SLM) [BAU96] which are very promising methods.
BF-overlapping of BF-OFDM signal structure. These proposed techniques take into account the signal overlapping structure and provide the same performance as for the classical CP-OFDM.
4.3.2. Digital Pre-Distortion (DPD)
To mitigate the PA nonlinearity effects, DPD is one of the most promising techniques among all PA linearization ones. It is complementary to PAPR reduction and is adopted to improve the overall linearity of the PA when operated near saturation region. DPD consists on applying to the PA input signal a non-linear function 𝐷𝑃𝐷(. ) which is the inverse of the PA characteristics. As a consequence, the PA output signal is ideally linearly proportional to the input signal before the predistorter.
In this investigation, DPD is based on the well-known memoryless polynomial model because of the considered RF PA in our experimental testbed is memoryless. This has been already demonstrated in our previous section. For DPD, we consider the approach presented in [ZAY14] that has been shown to give satisfactory performance when used for inverse modeling of nonlinear PA characteristic using inverse learning architecture (ILA).
The AM/AM and AM/PM conversion curves of the identified DPD are shown in Fig. 7. We recall that these curves are found from measurements performed with the described demonstrator using the Pasternack PE15A4017 wideband medium PA [PAS17]. The 1dB compression point (P1dB) is also marked on this plot by circles. It is worth mentioning that, for the AM/AM conversion, the input modulus at which we reach the PA saturation level is 0.45Volt. Beyond this level, the identified DPD cannot perform the inverse of the AM/AM PA characteristic.
Figure 9: AM/AM & AM/PM DPD conversions for PA under test. The black circle marked on the plots correspond to the PA 1dB compression point (P1dB).
In the following, selected sets of measurement results are reported and analyzed to evaluate the performance of the selected waveforms in presence of RF PA. In particular, we focus on the mitigation of out-of-bands and in-band effects caused by the RF PA. Performance comparisons of different waveforms, i.e., CP-OFDM, WOLA-OFDM and BF-OFDM are conducted in various cases with different values of IBO, with/without PAPR reduction (SLM or TR) and DPD, respectively. When PAPR reduction is applied, we have considered 𝑉 = 8 phase rotation vectors and 𝑅 = 16 reserved tones (i.e., represents about 7% of activated subcarriers) for SLM and TR, respectively.
4.3.3. Power spectral density (PSD)
Figs 8, 9 and 10 show measured (observed on Agilent ESA E4405B) spectra of the PA outputs for the three MWFs: CP-OFDM, WOLA-OFDM and BF-OFDM when SLM with DPD are considered. The idea here is to analyze the OOB radiation level of each MWF. Results are shown for two values of IBOs 3 and 6 dB. “w/o corr mes” denotes measured PSD without any correction. “wSLM + DPD sim” and “wSLM + DPD mes” are, respectively, used to indicate simulated and measured results using SLM with DPD. It is worth to mention that the identified PA model performed in section 3.2 has been used for simulations. Good agreement between measured and simulated performances proves that this model is efficient and reflects exactly the actual functioning of the real RF PA. We consider an observation bandwidth of three times the main data bandwidth. Two prototype filters, i.e., BT-Gaussian and PHYDYAS, are considered for BF-OFDM that are indicated by “BF-OFDM BT” and “BF-OFDM PHY”, respectively. It is evident that all MWFs have been strongly affected by the RF PA when the energy efficiency is high (IBO=3 and 6dB) and no correction is performed. In this case, advanced MWFs, i.e., WOLA-OFDM and BF-OFDM perform almost as the classical CP-OFDM and they lose their good spectral localization properties. It is worth pointing out that these PA OOB distortions bring a significant amount of interference to adjacent users. Such a behavior significantly reduces the MWFs ability to transmit over multi-user access based networks. In order to overcome this limitation while keeping good energy efficiency, corrections are needed for all MWFs. The same behavioral is shown when the PAPR reduction is performed using TR instead of SLM, the reason why we show only results with SLM.
Figure 10: PSD performance of CP-OFDM using SLM (V=8) and DPD.
Figure 12: PSD performance of BF-OFDM using SLM (V=8) and DPD.
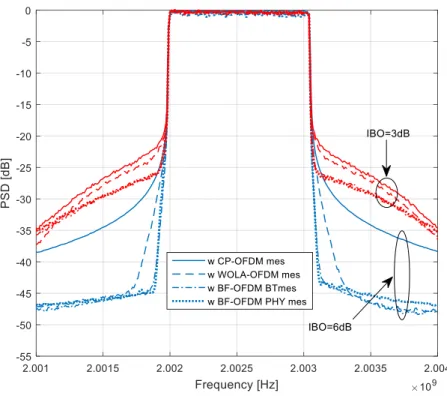
An improvement is noted when PAPR reduction and DPD are performed for all waveforms. Further, the gain is more pronounced when WOLA-OFDM or BF-OFDM are used. Their performance remains unsatisfactory for low value of IBO, i.e., 3dB, but they can regain their good spectral containment when an IBO of 6dB is considered. Figs 11 and 12 show measured PSD performance comparison of all MWFs when SLM and TR are, respectively, performed with DPD. Here, we can clearly see the significant gain performed with WOLA-OFDM and BF-OFDM compared to CP-BF-OFDM especially for IBO of 6dB. We can also note that BF-BF-OFDM outperforms WOLA-OFDM due to the better spectrum containment provided by the sub-band filtering used by BF-OFDM. Further, BT-Gaussian based BF-OFDM provides slightly better performance than PHYDYAS based BF-OFDM. For an IBO of 6dB, the CP-OFDM reaches the PSD in the linear case. Nevertheless, because of the rectangular shaping, the PSD localization is poor compared to WOLA-OFDM and BF-OFDM.
Figure 13: PSD performance of different WFs using SLM (V=8) and DPD.
Figure 14: PSD performance of different WFs using TR and DPD.
4.3.4. Adjacent Power Channel Ratio (ACPR)
ACPR is defined as the ratio of power in the adjacent channels of main one to the rms power of the transmitted signal in the main channel. Table 1 illustrates measured ACPR
performance under different configurations (“w/o”: without correction, “SLM/TR+DPD”: with correction when SLM/TR is performed with DPD) with real RF PA operated at IBOs of 3, 6, and 9dB. As can be observed at IBO=3dB, the scheme with SLM and DPD provides an ACPR gain of 0.5dB for CP-OFDM and about 1dB for WOLA-OFDM and BF-OFDM compared to the scheme without correction. The ACPR gain increases while increasing the IBO. For example, at IBO of 6 dB, it becomes 3, 7, 9 and 11dB for CP-OFDM, WOLA-OFDM, BF-OFDM PHY and OFDM BT, respectively. As expected, the gain performed with WOLA-OFDM and BF-OFDM is larger than the one provided by CP-BF-OFDM. It is worth mentioning that, for an IBO of 9dB, no significant gain is noted between the two schemes of BF-OFDM, because in this case we reach the noise floor level of the measurement equipment based demonstrator and differences is below this level.
IBO [dB] 3 6 9
Configuration w/o SLM+DPD TR+DPD w/o SLM+DPD TR+DPD w/o SLM+DPD TR+DPD CP-OFDM -26.90 -27.30 -27.63 -31.20 -33.36 -33.46 -32.70 -33.47 -33.93
WOLA-OFDM -27.43 -28..35 -29.22 -34,27 -41.25 -42.94 -40.06 -46.91 -47.48
BF-OFDM PHY -28.01 -29.82 -30.68 -34.91 -43.89 -45.32 -41.60 -49.18 -49.26
BF-OFDM BT -28.12 -29.88 -30.97 -35.01 -45.09 -46.43 -41.01 -49.35 -49.41
Table 2: ACPR [dB] performance of different WFs under different configurations.
4.3.5. Normalized Mean Square Error (NMSE)
The average NMSE assessed over all data subcarriers is given in Table 2 for all MWFs under different configurations. Again, we note that PAPR reduction and DPD methods provide very interesting enhancements making their crucial in the design of energy efficient MWFs based 5G transmitters. Indeed, at IBO of 3dB, they provide a gain of 2dB and 4dB compared to the case without correction when PAPR reduction is performed by SLM and TR, respectively. Moreover, a gain of 4dB is noted for both PAPR reduction methods at IBO of 6dB where we reach a NMSE of approximately -31dB. The NMSE of -31dB corresponds to the noise floor of the demonstrator in the linear case. In addition, a negligible gain is noted, at IBO of 9dB, compared to the case without correction because we are very close to the noise floor and differences should be below this level. It is worth mentioning that all MWFs have almost the same performance in all cases which explain that each subcarrier in the useful band has been affected by PA nonlinearities regardless the waveform frequency localization.
IBO [dB] 3 6 9
Configuration w/o SLM+DPD TR+DPD w/o SLM+DPD TR+DPD w/o SLM+DPD TR+DPD CP-OFDM -20.9 -23.3 -25.1 -26.7 -30.5 -30.6 -30 -31.3 -31.3
WOLA-OFDM -20.85 -23.16 -25.2 -26.5 -30.4 -30.5 -30.2 -31.2 -31.3
BF-OFDM PHY -20.9 -23.15 -25.29 -26.7 -30.3 -30.5 -30.4 -31 -31.5
BF-OFDM BT -20.9 -23.1 -25.5 -26.7 -31 -31 -30.65 -31.3 -31.5
Table 3: NMSE [dB] performance of different MWFs under different configurations.
4.3.6. Bit Error Rate (BER)
In this subsection, the in-band error is studied with different 𝐸𝑏/𝑁0 regimes. Fig. 21 compares measured BER of different MWFs when RF PA is operated at an IBO of 3 and 6dB. Again, we can note that WOLA-OFDM and BF-OFDM provide almost the same performance
at an IBO of 3dB, compared to the AWGN performance in linear case (indicated by “theo-AWGN”). At an IBO of 6dB, BER performance provided by all waveforms is very close to the one performed in linear case. It is worth pointing out that BER floor related to the demonstrator noise floor is not observable for BER > 10−5, which represents a significant BER range for wireless communications standards.
5 PA 10W identification
Measurements using the Weblab setup [LAN15] [CHA18] provided by the Chalmers University of Technology and National Instruments introduced in section 2.3 were performed in order to evaluate the 10W PA behavior. The test signal used for the identification was a f-OFDM one of 1.1MHz bandwidth and a PAPR limited to 8 dB thanks to a clipping and filtering (CFR) method [VAA05]. The signal is transmitted at 2.14GHz. The bandwidth of the digitalized signal is 200MHz allowing us a clean observation of 180 times the occupied bandwidth which is sufficient to analyze all spectral components generated by the PA. It has to be noted that the Weblab setup limits the instantaneous transmitted power to a maximum of 15W which is well below the saturation level of the PA. The AM/AM gain and AM/PM curves of the PA are presented in Figure 16 for a mean power of 1.6W (32dBm) and a peak instantaneous power of 10W (40 dBm). We can observe that the PA is extremely non-linear (see the “S” shape of the AM-AM curve) and experiences memory effects.
Figure 16: AM/AM, Gain and AM/PM conversions for the 10W PA under test
Figure 17 presents the normalized spectrum for the mean output power of 32 dBm for a F-OFDM waveform. We can see from this figure, the high amount of out-of-band radiation induced by the studied PA.
Figure 17: PA output spectra for mean output power of 32 dBm (f-OFDM signal)
6 PA 10W Effects on selected WFs
Weblab setup [LAN15] [CHA18] provided by the Chalmers University of Technology and National Instruments introduced in section 2.3 has a restriction regarding the peak power at the PA input. This restriction consists in limiting the peak output power and rms output power in order to protect the amplifier and the system from being burned. For this reason, all the signals used in this section have their PAPR reduced to 8 dB thanks to the CFR algorithm [VAA05] described in section 6.3.
6.1 Power Spectral Density (PSD)
In order to evaluate the out-of-band distortions caused by the 10W RF PA on the selected multicarrier waveforms, we show in Figure 18 and Figure 19 the spectra comparison of the CP-OFDM, WOLA-CP-OFDM, filtered OFDM and BF-OFDM (with PHYDYAS filter only) for, respectively, a mean output power of 30 and 32 dBm. Dashed lines correspond to PSD in the linear case while solid lines correspond to PSD with power amplifier. We can observe that:
- CP-OFDM is only slightly impaired by the PA due to its intrinsic poor spectral containment,
- WOLA-OFDM, filtered OFDM and BF-OFDM lose their good spectral properties and experience (almost) the same spectral containment at the output of the PA.
Figure 18: PA output spectra for different WFs for a mean output power of 30 dBm.
Figure 19: PA output spectra for different WFs for a mean output power of 32 dBm.
6.2 Bit Error Rate (BER)
In-band error is measured in terms of the bit error rate (BER) and is computed in a similar way than section 4.2. We can observe from results depicted in Figure 20 and Figure 21 that all
Figure 20: BER vs Eb/N0 for different WFs, 16-QAM, Mean output power of 30 dBm.
Figure 21: BER vs Eb/N0 for different WFs, 16-QAM, Mean output power of 32 dBm.
6.3 Mitigation of nonlinearity effects
We choose to reduce the PAPR thanks to a CFR algorithm [VAA05] which is a generic algorithm that could be applied to any type of WF. CFR algorithm is iterative and is composed of several steps:
- Step 1: Isolate the signal that only contains the peaks that are above a pre-defined threshold. The threshold is usually set to the target PAPR.
- Step 2: Filter the peak signal.
- Step 3: Subtract the original signal with the filtered peak signal. - Step 4: If necessary, go back to step 1.
The main advantage of CFR is the fact that the signal spectral containment at the output of the algorithm is controlled by the filtering operation and could be as sharp as desired. On the other hand, the main drawback of CFR is the increase of the in-band distortion. As presented in section 6.3.6, the in-band distortion is moderate with respect to the PAPR reduction. For instance, if the PAPR is reduced to 8 dB, the BER degradation for a 16QAM modulation is negligible.
6.3.2. Digital Pre-Distortion (DPD)
Since the 10W PA experiences memory effects (see section 5), we choose a memory polynomial model [DIN04] which has its coefficients learned using the least square approach and the indirect learning. The following formula gives the relationship between the input 𝑥(𝑛) and the output 𝑧(𝑛) of the DPD:
𝑧(𝑛) = ∑ ∑ 𝑎𝑘,𝑞. 𝑥(𝑛 − 𝑞). |𝑥(𝑛 − 𝑞)|𝑘−1 𝑄
𝑞=0 𝐾
𝑘=1
where 𝐾 and 𝑄 refer respectively to the nonlinearity order and to the memory. In our test, we choose 𝐾 = 7 and 𝑄 = 4 corresponding to 35 coefficients. The AM/AM and AM/PM conversion curves of the identified DPD are shown in Figure 22. We can observe that the identified DPD is strongly nonlinear, especially for the AM/AM (or gain) conversion.
Figure 23 presents the AM/AM and AM/PM at the output of the PA when using DPD. We can observe the benefit of the DPD on the linearity since AM/AM and AM/PM curves has been flatten and are now much more linear. The positive impact of the DPD on the spectral containment is presented in section 6.3.3.
Figure 23: AM/AM, Gain and AM/PM conversions of the signal at the output of the PA with DPD for the 10W PA under test, the mean output power is 32 dBm
6.3.3. Power spectral density (PSD)
Figure 24 and Figure 25 show the measured spectra of the PA output for the 4 selected MWFs (CP-OFDM, WOLA-OFDM, filtered OFDM and BF-OFDM) when the PAPR reduction and the DPD are activated. For comparison, the dotted curves present the spectra of the transmitted signal without DPD. These spectra represent the reference spectra provided by a theoretical and ideal DPD. We can observe that DPD used in our test is highly efficient and permits to recover the excellent spectral containment of WOLA-OFDM, filtered OFDM and BF-OFDM up to -60 dB, which corresponds to an improvement of about 20dB. Exact ACPR performance will be provided in section 6.3.4.
Figure 24: PA output spectra for different MWFs with DPD for a mean output power of 30 dBm.
Figure 25: PA output spectra for different MWFs with DPD for a mean output power of 32 dBm.
6.3.4. Adjacent Power Channel Ratio (ACPR)
Since the digitalized signal bandwidth is much greater than the useful bandwidth, we decide to present the performance of the first, second and third ACPR respectively in Table 4, Table 5 and Table 6. The left and right numbers refers respectively to the left and right ACPR. We can
observe that the performance of the post-OFDM MWFs are excellent and almost similar when using DPD, with a slight advantage of filtered-OFDM for the first ACPR.
Table 4: ACPR1 [dB] performance of different MWFs under different configurations.
Table 5: ACPR2 [dB] performance of different MWFs under different configurations.
Table 6: ACPR3 [dB] performance of different MWFs under different configurations.
6.3.5. Normalized Mean Square Error (NMSE)
The average NMSE of the MWFs at the PA output is provided in Table 7. Note that the reference signals used for NMSE computations are the signals which have their PAPR reduced to 8 dB. It is interesting to observe that NMSE does not provide precise information since the performance without DPD and the improvement provided by DPD are almost similar for all MFWs (including CP-OFDM). A possible rationale to explain this observation is that NMSE reflects at the same time the in-band (corresponding to BER degradations, presented in section 6.3.6) and out-of-band (corresponding to spectral regrowth, presented in section 6.3.4) levels. It appears that in-band levels are much greater than out-of-band levels, implying that NMSE is dominated by the in-band performance.
Table 7: NMSE [dB] performance of different MWFs under different configurations.
6.3.6. Bit Error Rate (BER)
In this subsection, the in-band error is studied with different 𝐸𝑏/𝑁0 regimes. Figure 26 and Figure 27 compare the uncoded BER of CP-OFDM, WOLA-OFDM, filtered OFDM and BF-OFDM with DPD for respectively a mean output power of 30 and 32 dBm. Since uncoded BER
Output Power [dBm] 30 32
configuration w/o DPD w/o DPD
CP-OFDM -31.5/-31.4 -33.3/-32.9 -30.9/-30.8 -33.2/-32.9
WOLA-OFDM -34.4/-34.6 -38.4/-38.6 -33.2/-33.3 -38.2/-38.4
f-OFDM PHY -36.5/-36.5 -57.0/-56.4 -34.8/-34.7 -50.5/-50.8
BF-OFDM PHY -36.2/-36.1 -52.3/-53.8 -34.7/-34.5 -49.0/-49.7
Output Power [dBm] 30 32
configuration w/o DPD w/o DPD
CP-OFDM -40.5/-40.4 -41.7/-41.5 -39.9/-39.7 -41.8/-41.5
WOLA-OFDM -46.2/-46.2 -63.7/-62.6 -43.9/-43.8 -61.0/-59.6
f-OFDM PHY -46.0/-46.0 -63.8/-62.8 -43.7/-43.7 -60.8/-59.7
BF-OFDM PHY -46.2/-45.9 -63.8/-62.9 -43.9/-43.6 -61.1/-59.7
Output Power [dBm] 30 32
Configuration w/o DPD w/o DPD
CP-OFDM -44.5/-44.2 -44.4/-44.2 -44.3/-44.0 -44.5/-44.2
WOLA-OFDM -56.4/-56.6 -65.0/-64.5 -53.1/-53.1 -64.4/-63.1
f-OFDM PHY -56.3/-56.5 -64.8/-64.6 -52.9/-53.1 -64.4/-63.2
BF-OFDM PHY -56.6/-56.5 -64.9/-64.7 -53.3/-53.1 -64.3/-63.3
Output Power [dBm] 30 32
Configuration w/o DPD DPD w/o DPD
CP-OFDM -29.1 -36.3 -27.6 -38.3
WOLA-OFDM -29.1 -37.0 -27.8 -36.2
f-OFDM PHY -29.0 -38.8 -27.7 -36.0
performance without DPD are already very close to the theoretical and ideal 16QAM performance (degradation less than 0.5 dB for a target BER of 10-5), no noticeable gain thanks to DPD are observed.
Figure 26: BER vs Eb/N0 for different MWFs, 16-QAM, with DPD, Mean output power of 30 dBm.
7 Multi-user asynchronous access
In this section, we evaluate the robustness of the selected multicarrier WFs in multi-user asynchronous access. We consider a scenario with two co-existing users sharing the available frequency as shown in Fig. 14. The colored area and the non-colored area correspond to time/frequency resources allocated to the user of interest and interfering user. As shown on the figure, the user of interest (UoI) occupies 7 resource blocks (RBs), about 1.1 MHz bandwidth from 2.0020 to 2.0031 GHz. On each side of the user of interest, there are 7 RBs, occupying 1.1 MHz bandwidth as interfering user. A guard-band between two users is separating the frequency bands of both users and a timing offset is given to create asynchronism.
Figure 28: Asynchronous scenario.
In order to well assess the performance of these multicarrier WFs, we measure the NMSE on the decoded symbols of the user of interest. Both per-subcarrier NMSE (Fig. 15) and the average NMSE (Table 3) obtained over all subcarriers are assessed versus timing offset and guard-band.
For the average NMSE, we have considered three cases of guard-bands 𝛿𝑓=0KHz, 𝛿𝑓=4.883KHz and 𝛿𝑓=14.65KHz corresponding to 0, 1 and 3 subcarriers spacing. For each guard-band, four timing offsets are exanimated Δt = 0μs, Δt = 3.3125μs, Δt = 13.25μs and Δt = 106μs corresponding to 0, 1/64, 1/16 and 1/2 symbol duration. While for NMSE per-subcarrier curves in Fig. 15, results are given for guard band δf of 4.883KHz and timing offset Δt of 106μs. Note that there is no carrier frequency offset (CFO) since USRP modules are perfectly synchronized using the external synchronization.
From results illustrated by Table 3, we clearly show that the inter-user interference level depends on the chosen multicarrier waveform. CP-OFDM exhibits the worst performance when the timing offset does not belong to the CP interval (CP = 1/28 symbol duration). This fact is due to its bad frequency response localization which leads to a severe degradation for CP-OFDM with average NMSE reaching up -21dB, -23dB and -24dB when δf= 0KHz, 4.883KHz and 14.65KHz, respectively, in a fully asynchronous scenario (Δt = 106μs).
Regarding WOLA-OFDM case, we can observe better performance compared to CP-OFDM. At Δt = 106μs, one can note a gain of 3dB, 4dB and 4.5dB when δf= 0KHz, 4.883KHz and 14.65KHz, respectively. According to results in Fig. 15, the interference level achieved by WOLA-OFDM in the middle of the bandwidth is lower (approximately -34dB) compared to CP-OFDM scheme. These good results are related to the WOLA processing applied at the receiver that is able to suppress inter-user interference resulting from the mismatched FFT capture window. 𝜹𝒇(𝐊𝐇𝐳) 0 4.883 14.65 𝚫𝐭(𝛍𝐬) 0 3.3125 13.25 106 0 3.3125 13.25 106 0 3.3125 13.25 106 CP-OFDM -31.5 -31.5 -23.4 -21.6 -31 -31 -23.5 -23 -31.5 -31 -23.8 -24 WOLA-OFDM -31.5 -30.5 -26.8 -24.8 -31 -30.5 -26.9 -27,2 -31 -30.6 -27.9 -28.5 BF-OFDM PHY -30 -26.9 -24.8 -23.1 -30 -26.9 -25.2 -25.3 -30 -27 -26 -25.9 BF-OFDM BT -30.5 -30.5 -25 -22.8 -31 -31 -25.1 -25.5 -30.5 -30.5 -26.1 -26.1
Table 8: Average NMSE [dB] performance of different WFs under different configurations.
We move now to BF-OFDM, where additional remarks can be made. Thanks to per-RB filtering, the BF-OFDM shows better performance compared to CP-OFDM. However, the gain of BF-OFDM for the inner subcarriers, located at the middle of the bandwidth, is marginal compared to CP-OFDM.
This is a direct consequence of the BF-OFDM receiver which is no more than the classical CP-OFDM receiver (i.e., a simple FFT). Further, at Δt = 106μs, WOLA-CP-OFDM performs better than BF-OFDM and we note a gain of 2dB and 2.5dB when δf= 4.883KHz and 14.65KHz, respectively.
Figure 29: NMSE performance of different WFs when 𝛥𝑡 = 106𝜇𝑠 and 𝛿𝑓 =4.883KHz
According to Fig. 15, BF-OFDM provides better protection to the edge subcarriers (in the vicinity of interferer subcarriers) compared to both CP-OFDM and WOLA-OFDM. In such region, the NMSE varies from -16dB when δf =4.883KHz to -24dB when δf= 39.06KHz for BF-OFDM scheme while it varies from -14.2dB to -23dB for WOLA-BF-OFDM scheme when the same band is considered. Thus, BF-OFDM could be more interesting than WOLA-OFDM when little number of RBs will be considered for the user of interest. Delightfully, BF-OFDM can be much more interesting when it is combined with a windowing technique at the receiver side.
8 Conclusion
In this deliverable, we have presented results in a real-world environment in order to convince evidences of advanced multicarrier waveform technology feasibility. Thus, we have built a practical and flexible configurable testbed dedicated to development and validation for several 5G physical layer technologies.
We have provided details and guidance on the testbed design and implementations to improve energy efficiency and robustness of the most promising multicarrier waveforms, i.e. WOLA-OFDM, BF-OFDM and f-OFDM. In particular, we have focused on the combination of PAPR reduction and DPD techniques in order to mitigate the in-band and out-of-band nonlinear distortions caused by the real RF PA while improving the energy efficiency. Testbed results demonstrated that the combined DPD and PAPR reduction allows the transmitter to significantly improve the spectrum localization without sacrificing the in-band and out-of-band waveform quality, while operating very close to the PA saturation level, thus achieving high power efficiency as well. The results are generally applicable to all spectrally localized MWFs.
Furthermore, the developed testbed has been dedicated to evaluate the capability of the selected waveforms in handling multi-user signals when there is imperfect synchronization in time domain. We have provided further discussions and comparisons of CP-OFDM, WOLA-OFDM, BF-OFDM and f-OFDM.
More precisely, we have considered the coexistence of two users which are asynchronously transmitting in adjacent bands using the same transmit power per subcarrier. We have also provided insights on the impact of several important system parameters, e.g. guard bandwidth and filter design. According the evaluation performed through the developed testbed, we have demonstrated that the discussed WOLA-OFDM, BF-OFDM and f-OFDM waveforms guaranties satisfactory robustness to inter-user interference compared to CP-OFDM.
In some specific scenario, the guard band can be considerably reduced achieving full spectrum utilization.
Based on the experimental testbed results, it is safe to recommend the consideration of WOLA-OFDM, BF-OFDM and f-OFDM for the future wireless networks.
References
[3GPP17] 3rd Generation Partnership Project (3GPP), overall description stage 2, technical specification group access network 38.300, 12 2017, 2.0.0.
[USR29] USRP-2942 Specifications, available at: https://www.ni.com/pdf/manuals/374410d.pdf. [CUT12] V. Cuteanu and A. Isar. Papr reduction of ofdm signals using selective mapping and clipping hybrid scheme. In 2012 Proceedings of the 20th European Signal Processing Conference (EUSIPCO), pages 2551–2555, Aug 2012.
[WAT05] T. Wattanasuwakull and W. Benjapolakul. Papr reduction for ofdm transmission by using a method of tone reservation and tone injection. In 2005 5th International Conference on Information Communications Signal Processing, pages 273–277, Dec 2005.
[PAS17] Pasternack PE15A4017, available at: https://www.pasternack.com/images/productpdf/pe15a4017.pdf.
[ZHO07] D. Zhou and V. E. DeBrunner. Novel adaptive nonlinear predistorters based on the direct learning algorithm. IEEE Transactions on Signal Processing, 55(1):120–133, Jan 2007.
[LAN15] P. N. Landin and D. Rnnow. Rf pa modeling considering odd-even and odd order polynomials. In 2015 IEEE Symposium on Communications and Vehicular Technology in the Benelux (SCVT), pages 1–6, Nov 2015.
[DIN04] Lei Ding, G. T. Zhou, D. R. Morgan, Zhengxiang Ma, J. S. Kenney, Jaehyeong Kim, and C. R. Giardina. A robust digital baseband predistorter constructed using memory polynomials. IEEE Transactions on Communications, 52(1):159–165, Jan 2004.
[SEU05] Seung Hee Han and Jae Hong Lee. An overview of peak-to-average power ratio reduction techniques for multicarrier transmission. IEEE Wireless Communications, 12(2):56–65, April 2005. [BUL18] S. S. K. C. Bulusu, M. Crussire, J. F. Hlard, R. Mounzer, Y. Nasser, O. Rousset, and A. Untersee. Quasi-optimal tone reservation papr reduction algorithm for next generation broadcasting systems: A performance/complexity/latency tradeoff with testbed implementation. IEEE Transactions on Broadcasting, pages 1–7, 2018.
[BAU96] R. W. Bauml, R. F. H. Fischer, and J. B. Huber. Reducing the peak-to-average power ratio of multicarrier modulation by selected mapping. Electronics Letters, 32(22):2056–2057, Oct 1996. [TAN18] Khaled Tani, Yahia Medjahdi, Hmaied Shaiek, Rafik Zayani, Daniel Roviras: PAPR reduction of post-OFDM waveforms contenders for 5G & Beyond using SLM and TR algorithms. ICT 2018: 104-109.
[ZAY14] R. Zayani, Y. Medjahdi, H. Bouhadda, H. Shaiek, D. Roviras, and R. Bouallegue. Adaptive predistortion techniques for non- linearly amplified fbmc-oqam signals. In 2014 IEEE 79th Vehicular Technology Conference (VTC Spring), pages 1–5, May 2014.
[LAN15] P. N. Landin, S. Gustafsson, C. Fager, and T. Eriksson, “WebLab: A Web-based setup for PA digital predistortion and characterization [application notes],” IEEE Microw. Mag., vol. 16, no. 1, pp. 138–140, Feb. 2015.
[CHA18] Chalmers University of Technology and National Instruments. Accessed: Aug. 29, 2018. [Online]. Available: http://dpdcompetition.com/rfweblab/
[VAA05] O. Vaananen, J. Vankka, and K. Halonen, “Simple algorithm for peak windowing and its application in GSM, EDGE and WCDMA systems,” IEE Proc. - Commun., vol. 152, no. 3, pp. 357– 362, Jun. 2005.
Glossary and definitions
Acronym Meaning
5G NR 5 Generation, New radio
ACPR Adjacent Channel Power Ratio
BER Bit Error Rate
Bps Bytes per second
BF-OFDM Block Filtered OFDM
C-MTC Critical Machine Type Communications
CN Core Network
DFS Dynamic Frequency Selection
DPD Digital Predistortion
eMBB Enhanced Mobile Broadband
EVM Error Vector Magnitude
f-OFDM Filtered OFDM
FWA Fixed Wireless Access
IBO Input Backoff
IoT Internet of Things
KPI Key Performance Indicator
M-MTC Massive Machine Type Communications
MTC Machine Type Communications
NMSE Normalized Mean Square Error
PA Power Amplifier
PÄPR Peak-to-Average Power Ratio
PC Personal Computer
PSD Power Spectral Density
RRC Root Raised Cosine
SCS SubCarrier Spacing
SDR Software Defined Radio
USRP Universal Software Radio Peripheral
WOLA-OFDM Weighted Overlap and Add OFDM