HAL Id: hal-00678001
https://hal.archives-ouvertes.fr/hal-00678001
Submitted on 11 Mar 2012
HAL is a multi-disciplinary open access
archive for the deposit and dissemination of
sci-entific research documents, whether they are
pub-lished or not. The documents may come from
teaching and research institutions in France or
abroad, or from public or private research centers.
L’archive ouverte pluridisciplinaire HAL, est
destinée au dépôt et à la diffusion de documents
scientifiques de niveau recherche, publiés ou non,
émanant des établissements d’enseignement et de
recherche français ou étrangers, des laboratoires
publics ou privés.
Methodology for the Fault Analysis and Evaluation of
True Random Number Generators
Mathilde Soucarros, Jessy Clédière, Cécile Dumas, Philippe Elbaz-Vincent
To cite this version:
Mathilde Soucarros, Jessy Clédière, Cécile Dumas, Philippe Elbaz-Vincent. Methodology for the Fault
Analysis and Evaluation of True Random Number Generators. 2012. �hal-00678001�
(will be inserted by the editor)
Methodology for the Fault Analysis and Evaluation of True Random
Number Generators
Mathilde Soucarros · Jessy Clédière · Cécile Dumas · Philippe Elbaz-Vincent
Received: date / Accepted: date
Abstract True Random Number Generators have many uses, in particular they play a key role in security applications and cryptographic algorithms. Our interest lies in the quality of their generated random numbers. More specifically, for such utilizations, a slight deviation of the numbers from a “per-fect” behavior can have disastrous consequences. It is then necessary to devise schemes for the testing of these genera-tors in order to detect non-random properties of their num-bers. Moreover, one should consider them from an attacker point of view and use any means to try to perturbate their good functionnality. In this article we describe such exper-iments and several standard statistical tools for the genera-tors testing. We also present experimental results obtained through the study of a generator embedded in a processor in order to illustrate our methodology. We show that its pertu-bation leads to the apparition of dangerous deviations in its numbers distribution.
Keywords True Random Number Generator · Perturba-tion · Statistical tests · Temperature · Laser · Frequency injection · Radioactivity · X-rays
The first author is supported by a grant from the French Ministry of Defence (Direction Générale de l’Armement).
Mathilde Soucarros · Jessy Clédière · Cécile Dumas 24 rue des Martyrs, CEA-Leti, Minatec Campus 38000 Grenoble, FRANCE
Tel.: +33438782545 Fax: +33438786547
E-mail: [email protected] Mathilde Soucarros · Philippe Elbaz-Vincent Institut Fourier, 100 rue des maths
38402 St Martin d’Hères, FRANCE
1 Introduction
Random numbers have proved useful in many fields of ap-plication. An obvious one and certainly the most popular is gaming, which comprises lotteries, card games or slot machines. From a scientific point of view, random num-bers have permitted much improvement in the comprehen-sion and prevention of natural phenomena such as seisms, weather forecast or crowd psychology. This was made pos-sible by their utilization in numerical simulation and Monte Carlo methods [13], by replacing parameters at the input of models of physical phenomena and knowing their distribu-tion laws. Random numbers also have important funcdistribu-tions in the domain of security application and more particularly in cryptography. Indeed, secure functions require random numbers to be employed in many different ways, for exam-ple to generate keys, signatures, nonces or countermeasures. The aim of Random Number Generators (RNGs) is to produce numbers with properties similar to random ones, which means that they must be independent and identically distributed. The desired distribution is determined by the ap-plication into which the RNG is used. For instance the sim-ulation of a physical processes can require the random num-bers to follow a Poisson or Gaussian distributions, while it is more probable that uniform numbers will be manipu-lated in cryptography. Furthermore, the very nature of se-curity applications underlines the importance that the ran-dom number should never deviate from their ideal distribu-tion. Random numbers with bad properties can disable rity measures against potential attacks by invalidating secu-rity proofs of cryptographic algorithms or disabling counter-measures, leading to disastrous consequences as illustrated in [10, 6, 23, 16]. Moreover, as a core brick of cryptographic implementations, RNGs are likely to be targeted by attack-ers. In consequence, it is indispensable to study the effect of external perturbations on RNGs in order to determine their
robustness and suitability for such application and prevent possible flaws in their design.
RNGs are composed of two main families, the True Ran-dom Number Generators (TRNGs) and the Pseudo RanRan-dom Number Generators (PRNGs). TRNGs exploit physical phe-nomena that contain a part of incertitude. PRNGs are based on deterministic algorithms. For security applications, there exist recommendations for the design and the evaluation of RNGs, in particular PRNGs [32, 2, 34, 18, 1].
This paper presents a methodology for the testing of TRNGs under physical perturbations. It explains the differ-ent set ups proposed in order to achieve it as well as the means to analyze consequential defects in the sequences of random numbers generated. Also, one TRNG is tested and the results are presented. In the literature, similar studies have been realized: the randomness source perturbations are mostly achieved via variations of their power supply volt-age, temperature or the injection of a frequency. These per-turbations and their effects can be modelized and analyzed from a mathematical point of view [12, 39, 3], but more of-ten studies focus on their observation from real implemen-tations. For instance, TRNGs implemented in commercial-ized components like Infineon chip card controllers or Via C3 processors have been tested with modifications of their temperature, clock frequency, power supply voltage and ac-tivity [7, 5]. In these cases, a very slight or no influence at all were observed in the TRNGs performances. Many studies of TRNGs under stress are done with modifications of the temperature as it is easily done and often yields interesting results [33, 48, 36, 38]. In particular, TRNGs designs based on oscillators have shown to be sensible to different temper-atures, with ensuing modifications of their frequency. A sim-ilar result was obtained with variations of the power supply voltage in [48]. A different kind of perturbation is explained in [33] with the application of neighboring activities to three different TRNGs and the comparison of their performances. Depending on the TRNG design it is shown that there can be a decrease in its performances or not at all. Finally, a perturbation that was introduced recently is the frequency injection [25, 31]. It can be realized by two different means, either directly through the circuit power supply or with elec-tromagnetic (EM) waves. The first experience shows that it is possible for free-running oscillators to lock their phase and thus to considerably reduce the entropy of the TRNG. In the second set up, a free-running oscillator has its frequency varying depending on the injected EM signal.
This paper is organized as follows. In Section 2, the con-cept of RNG is detailed. In Section 3, the experimental set up for TRNG perturbations is explained, with a description of the different test benches. In Section 4, the tests used to determine the level of randomness produced by the TRNGs are presented. In Section 5, results of experiences are com-mented.
2 Random Number Generators
As described previously, RNGs can be divided in two main families and mixed designs. In practice RNGs are embed-ded in electronic circuits, where often only a small space on silicon can be allocated to them, for example in smart cards. Furthermore, it is necessary for some applications that their output rate be important enough while keeping good ran-dom properties. These requirement can limit the choice of a RNG and influence its design. Figure 1 summarizes their conceptions. Entropy source Digitization Post-processing Noisy signal DAS
True random numbers (a) TRNG conception
Seed
Digital processing
Pseudo-random numbers (b) PRNG conception Fig. 1 RNG conception principle
A TRNG is constituted by a source of physical noise that is sampled and digitized. This noise can be found dur-ing the process of radioactive decay [46], in the thermal noise created by flow of electrons [30, 42] or in the oscil-lators phase jitter generated by different propagation times in logic gates [17, 39]. The entropy source produces a digi-talized analog noise (DAS) that is then post-processed. In-deed, the entropy source covers the need for randomness but it often produces numbers that show some deviation from their ideal properties. A whitening function is then necessary to ensure that these undesirable properties are suppressed. Such functions can be very simple like the von Neumann corrector [29] and correct only minor defects. More com-plicated post-processors like resilient or cryptographic func-tions can be also used with more efficiency. Sometimes, many TRNGs can be used for the same application, in which case their output is combined in an entropy pool. This permit to avoid consequences of the collapse or deficiencies of one of them.
A PRNG has only a processing function which consists in the digital computation of a value depending on some deterministic algorithm. The typical used algorithms com-prise linear congruential generators [22] and Linear
Feed-back Shift Register (LFSRs) [35], but also cryptographic al-gorithms [28]. PRNGs are often seeded by TRNGs, in which case they are also used to improve the bit rate at the output.
3 Test benches
In the introduction we presented existing means for stress-ing TRNGs. This section explains the implementations of our set ups for four different kinds of perturbation. As the TRNGs are usually not independent pieces of circuits we consider the components into which they are embedded, like chips for instance.
3.1 Perturbation by the application of a temperature The aim of this experience is to immerse the studied com-ponents in an environment having a certain temperature. We developed three set ups allowing us to heat them up and cool them down.
3.1.1 Principle
Figure 2 describes the general principle of the test benches. A PC monitors the applied temperature and dialogs with the tested component. The component is introduced in the envi-ronment as well as a sensor that measures the temperature via a multimeter.
PC Multimeter
Component Temperature sensor
Environment with a fixed temperature
Fig. 2 Principle of a perturbation by the application of different tem-peratures
3.1.2 Resistor heater
Depending on the current flowing through a resistor heater, it will deliver a certain power dissipated by Joule effect. The resistor is maintained against a hook, as represented in Fig-ure 3, and the heat given off by the former is propagated through the later. The hook is made of aluminium to im-prove the heat propagation. By fixing the tested component
against or inside the hook, it will also heat up and remain stable at a certain temperature between the room tempera-ture and 150◦C.
Fig. 3 A resistor heater is maintained against a hook and heating it up
3.1.3 Peltier Cooler
Peltier coolers exploit the Peltier effect [14]: depending on the direction of the current flowing through two different semi-conductor materials, a heat absorption or emission hap-pens at their junction. The cooler is constituted of many of these thermocouples interconnected between two ceramic plates. In practice it means that one face of the Peltier cooler absorbs heat (cold face) and the other releases it (hot face). Depending on the current flowing through the cooler and the voltage applied, a certain difference of temperature appears between the two faces. In order to minimize the temperature on the cold face, a heat sink combined with a fan is main-tained against the hot face with some thermal grease and evacuates the heat. A temperature between room tempera-ture and -30◦C can thus be obtained on the cold face. The tested component is placed on the cold face as represented in Figure 4.
It is sometimes desirable to have the experience last a few hours. In this case frost will form on the cold face sur-face and the component, maintaining the temperature at about 0◦C. In order to avoid such a phenomenon, the set up needs to be moved in a vacuum environment.
3.1.4 Liquid nitrogen
Colder temperatures are obtained with the use of liquid ni-trogen. Liquid nitrogen has a temperature of -196◦C and de-pending on how far the tested component is from the liquid source, amid the nitrogen vapors, it can be cooled down to
Fig. 4 Temperature down to -30◦C are obtained by the combination of a Peltier cooler and a heat sink
this temperature. The liquid nitrogen is contained in a De-war flask which provides thermal insulation and slows the evaporation down. Depending on the component size, it may or may not be possible to introduce it into the flask. If it is small enough, the component is fixated to a rod introduced in the flask as represented in Figure 5. The temperature is set by adjusting the height of the rod. On the contrary, if the component is too big to be introduced in the flask, a rod is put entirely into it. The component is maintained on its ex-tremity, just outside the flask. The rod is made of aluminum and thus dissipates the heat from the component, cooling it down.
Fig. 5 Cold temperatures are obtained through the use of liquid nitro-gen and a rod
Though very cold temperatures can be attained through this process, a few drawbacks restrict its use. The nitrogen cannot be maintained indefinitely in the Dewar flask even though it reduces its evaporation. Moreover, the
thermaliza-tion is long and the temperature is sensible to the rod move-ments. However, once the temperature is stabilized it will remain so for several hours.
Let’s notice that silicon components are sensible to cold temperature [40]. When the temperature falls down, the elec-trons density decreases until it reaches a state called “freeze-out”. At this stage, at approximately -150◦C, there are not enough electrons to make the component work.
3.2 Perturbation by a laser source
Laser sources were first used to reproduce the effects caused by ionizing radiations on semiconductors [15, 27]. For stance, it was shown that an exposition to a flash could in-duce an error on the illuminated logic gates [37]. Accord-ingly, laser beams are often used to operate faults attacks on electronic circuits by focusing on interesting spots. Laser beams send photons that permit the formation of electron-hole pairs when in the neighborhood of polarized zones. These pairs create currents that disturb the normal behavior of a circuit. Figure 6 describes the set-up that exploits laser beams. A laser diode produces a beam focalized on a 30 µm diameter with a maximum power of 3.75 W. A PC moni-tors the laser and a XY table that moves the beam above the component in order to impact different spots.
PC
Power supply Laser diode
XY Table Focalization
Component
Closed box
Fig. 6 Principle of the perturbation using a laser source
It is necessary to prepare the component beforehand to improve the attack. A thinning of the silicon substrate is performed with a milling machine. This operation reduces transmission losses in the substrate, thus increasing the power in the active zone.
3.3 Perturbation via an electromagnetic injection
Electromagnetic perturbation is a very important issue with respect to electronic circuits. These circuits are sensible to
electromagnetic waves and must be protected from them (hence the electromagnetic compatibility laws). The task is complicated by the fact that electronic circuits are them-selves generators of electromagnetic waves. These waves are created either by the current flow through a loop or by a voltage drop inside a circuit. The components from which the waves are produced are called antennas.
The perturbations induced on circuits are due to their coupling with the emitted radiation. The coupling is made possible via the circuits antennas or directly on its wires and many different effects can be observed depending on the perturbed components. In [8] the effects of electromagnetic waves on electronic circuits are presented. For instance they can lead to signals perturbation with modification of a logi-cal state, delays that desynchronize signals or the frequency and phase jitter variations of oscillating systems.
We present our set up for a perturbation via electromag-netic radiations on Figure 7. The electromagelectromag-netic perturba-tion is generated with a probe constituted by a rod and a loop at its extremity. A sinusoidal signal, whose power is amplified up to 2 W, goes through the loop and creates an electromagnetic field. The probe is placed above the tested component, with an XY table allowing the shifting of its lo-cation so that cartographies can be obtained. A PC pilots the signal parameters, the probe position and it dialogs with the component. PC Signal generator Power amplification XY Table Probe Component
Fig. 7 Perturbation via electromagnetic radiations
3.4 Perturbation via ionizing radiations
A beam is said to be ionizing if the energy it transfers to electrons is important enough to liberate them from their atoms. High energy radiations can even modify a material crystalline lattice and its electronic properties [4].
Ionizing radiations are found in different ways as ex-plained in [43]. They comprise :
– cosmic rays produced by subatomic particles from the outer space,
– high energy electromagnetic waves generated by the in-teraction of electrons beams with a metal (X-rays) or emitted during atomic nuclei decay (γ rays),
– α and β rays emitted during a radioactive decay, – neutron radiations produced by the interaction of
neu-trons with a material.
Studies have shown that ionizing radiations can cause faults on electronic components. Consequences of such ef-fects can be very important, in particular for spatial appli-cations with the impact of cosmic rays but also in the elec-tronic domain. References on studies of the effects induced by such radiations are introduced in [41].
We present two test benches that we used with regards to ionizing radiations, one exploits γ rays and the other X-rays.
3.4.1 Gamma rays
Four different radioactive sources were used. Each one is characterized by its energy level (in electron-volts) and its activity (number of disintegration per second in Becquerels) depending on the material quantity:
– Americium 241, 60 keV, 3.7 MBq – Americium 241, 60 keV, 518 MBq – Barium 133, 356 keV, 2.5 MBq – Cesium 137, 660 keV, 26 MBq
The experiment set up consists in putting the sources the closest to the tested component. Three sources are incorpo-rated into plastic discs (Figure 8a), the Cesium is contained into flask made of lead (Figure 8b).
Electronic card
Plastic disk containing the radioactive source
Tested component
(a) Americium and Barium sources
Electronic circuit
Lead flask containing the radioactive source
Tested component
(b) Cesium source Fig. 8 Perturbation via radioactive sources
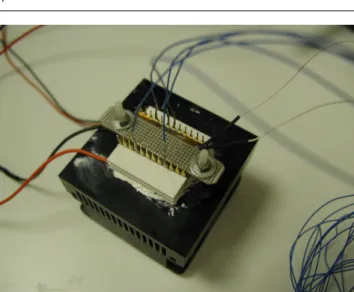
3.4.2 X-rays
A X-ray generator is constituted by a high voltage trans-former supplying a X-ray tube. A current is created between two electrodes when applying a high voltage. Electrons from the cathode impact the anode material. The effect is to en-ergize the material electrons and the consequent emission of a X-radiation. This radiation is characterized by its inten-sity (proportional to the generated current) and its energy (in electron-volts, it is fixed by the chosen voltage).
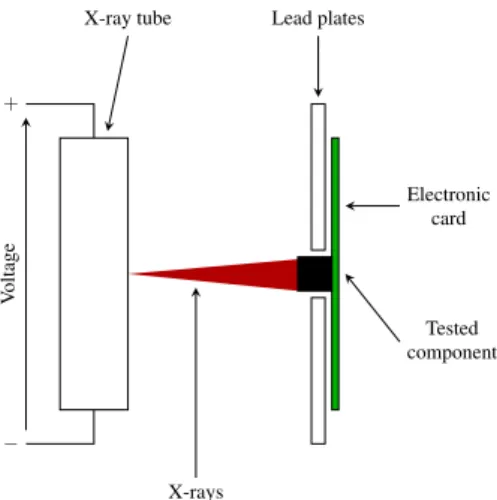
Figure 9 describes the set up for tests with X-rays. The electronic circuit is placed so that the component is perpen-dicular to the emitted X-rays. Lead plates protect the rest of the circuit.
+
−
V
oltage
X-ray tube Lead plates
Electronic card
Tested component
X-rays
Fig. 9 Perturbations via a X-rays
4 Statistical tests
The precise evaluation of RNGs is a difficult task as dis-cussed in [13, 9]. From a mathematical viewpoint, we as-sume the output sequence of the RNGs to be independent and identically distributed(IID), which means that each ran-dom variable has the same probability distribution as the others and all are mutually independent (with respect to a given probability distribution). Such assumption is almost impossible to prove in practice. However, the primary goal is to show that the RNG has no known bias which is differ-ent than proving formal property of the sequence generated. For this purpose, we use statistical tests in order to evaluate how far the RNG is from an IID. During the perturbation of a TRNG we save the random numbers it outputs. By examin-ing those numbers, we can determine if the TRNG has been affected by the perturbation or not. This decision, however, is not easily done as the RNG output is not reproducible and there does not exist a universal test of randomness. In prac-tice we test if the number distribution does not stray too far
from a theoretical distribution of true random numbers (in-dependent uniformly distributed). This means that we must verify the key properties that characterize non-random num-bers. Obviously there is no end to non-random properties that we can think of, therefore we use different batteries of statistical tests that incorporate a few of them.
Some people tried to describe tests that should be used with random numbers [28, 19] and we present batteries that are now commonly applied to assess the performance of RNGs.
4.1 Principle
Each statistical test verify an hypothesisH0about the tested sequence of numbers.H0is the assertion that the sequence is random. Depending on the issue of the test, this hypothesis is accepted or rejected.
For each test a statistic is chosen and its theoretical dis-tribution is computed. A critical value is determined from the distribution, where the probability of this value happen-ing is small. The statistic is calculated durhappen-ing the test and if it exceeds this value thenH0is rejected, else it is accepted. This reflects the fact that a sequence of true random numbers should not have a distribution too different of its theoretical one, so there is a small probability of this value happening.
In reality the statistic will exceed the critical value a cer-tain number of times andH0will be rejected although the sequence may really be random. This event is called a Type I error and its probability is α. On the contrary, the proba-bility of acceptingH0though the sequence is not random is β and this event is called a Type II error. The value of α can be determined by the application for which the TRNG is used. The greater α, the more chance there is to reject a se-quence of numbers and so the harder it is to pass the test. For example, if α = 0.001 then one sequence out of one thou-sand will be rejected. Typical values of α lie in the interval [0.001, 0.05]. β is not fixed because each test verifies only one property of the sequence of numbers and consequently an infinite number of non-random sequences could pass the test.
A drawback of this method is the lack of concrete infor-mation that results from the acceptance or rejection ofH0. More knowledge on their performance can be acquired by observing directly some of their properties, for instance by representing the number distribution. Additionnaly, TRNGs are evolving in time and this should also be taken into ac-count. We will illustrate the interest of such analysis in sec-tion 5.
As all combinations of random numbers are equally prob-ables, the statistical tests basically focus on the detection of pattern repetition. This begs the problem of localized short faults that could be induced by attackers. Indeed, this kind
of event would not be detected during statistical testing. Un-fortunately, from a cryptographic point of view their occur-rence could be sufficient to retrieve sensitive informations. Consequently, one should not always consider it safe to use a TRNG that produces sequences passing the tests. In real-ity, their relevance strongly depends on the context of the TRNG study.
4.2 The ENT program
ENT [47] computes five basic values that allow us to have a first insight in the properties of the tested sequence of num-bers. Those values are the entropy, the chi2, π, the mean and the correlation. It can show biases in the distribution of the numbers and correlations.
4.3 The FIPS PUB 140-2 standard
The Federal Information Processing Standards PUBlication 140-2 [11] describes a standard for the accreditation of cryp-tographic modules. Introduced by the National Institute of Standards and Technology (NIST), it presents four simple tests that can quickly point out defaults in the tested se-quence of numbers.
The sequence is considered as a succession of bits. The monobit test computes the number of zeros and ones in the sequence. The poker test compares the number of four bit patterns in the sequence with their theoretical probabilities of occurrence. The run test calculates the number of n-bit runs (succession of n bits having the same value). The long run test computes the number of runs with more than 25 successive bits.
The sequence produced by a TRNG is divided in 20000 bit subsequences. Each test is applied to every of these sub-sequences. The result must belong to a certain interval given by the standard for each test to pass. We finally consider the percentage of sub-sequences whose tests have passed.
4.4 The AIS31 methodology
The Bundersamt für Sicherheit der Informationstechnik (BSI) is the German institution for information security. They have written an evaluation methodology and functionnality classes for RNGs depending on their design and applications [18].
They have pre-defined three classes for typical use cases of TRNGs, for which the following requirements must be met:
– the random numbers might be used for cryptographic applications but they do not need to be unpredictable (PTG.1),
– the random numbers have a high entropy but they could be distinguishable from independent uniformly distributed ones (PTG.2),
– the random numbers are suitable for any cryptographic applications and they must not show any bias or correla-tion (PTG.3).
They created two procedures to be part of a RNG eval-uation process. They use nine statistical tests, four of which are those of the standard FIPS 140-2. The first procedure evaluates the inconspicuousness of random numbers, which means that it detects if parts of the tested sequenced behave differently from others. The second procedure ensures that the entropy is large enough.
4.5 The Diehard battery
This battery contains several tests [26]. The studied sequence of numbers is considered as a succession of 32 bit integers. For each test a random variable X is chosen with a distribu-tion F. The tests return p-values p given by :
p= 1 − F(X ) (1)
For a sequence of true random numbers the p-values should be uniformly distributed in [0, 1[. As F is only an approximation of the theoretical distribution of X then some deviations should appear. Most of them will be found at the distribution tails where the p-values are equal to 0 or 1. How-ever such values should be expected from time to time. Con-sequently, the sequence is deemed not random if more than five of these values, within some bounds, are computed. For instance with an interval of 0.01 we expect getting p-values belonging to [0.01, 0.099].
4.6 The NIST test suite
This battery was developed by the NIST, its goal being the evaluation of RNGs used in cryptographic applications [32]. The sequences are tested with respect to the following prop-erties :
– uniformity (the occurrence probability of bits to zero or one are equals to 0.5 in any part of the sequence), – scalability (every randomly extracted subsequence should
be proved as random as the original sequence),
– consistency (a RNGs should be tested from several of its outcomes and not only one).
Each statistical test results in a p-value p. This value is the probability that a true random number generator pro-duces a sequence less random than the tested RNG with re-gards to a certain property. A p-value equals to 1 means that the sequence is perfectly random and 0 that it is not at all. ThereforeH0is accepted if p ≥ α with α ∈ [0.001, 0.01].
For example, a p-value p ≥ 0.01 signifies that the tested se-quence is random with a probability of 99.99%.
In practice the sequence is divided in subsequences of at least 1000 bits and each of them generates a p-value for every test. The proportion of p-values greater than α is com-puted and must belong to the following interval for the se-quence to be considered random :
ˆ p± 3 r ˆ p(1 − ˆp) m (2)
where ˆp= 1 − α and m is the subsequence number. The p-value distribution is also examined in order to ver-ify its uniformity. This is realized with a χ2test :
χ2= 10
∑
i=1 Fi− s/10 s/10 (3)where [0,1] is divided in 10 intervals, Fiis the number of p-values in the interval i and s is the number of subsequences in i. A new p-value is computed from this data with :
p-valueT= igamc(9/2, χ2/2) igamc(a, x) = 1 Γ (a) R∞ x e−tta−1dt Γ (z) =R0∞e−ttz−1dt (4)
where igamc is the incomplete gamma function and Γ is the gamma function. If p-valueT ≥ 0.0001 then the subse-quences are considered uniformly distributed.
4.7 The TestU01 library
TestU01 [21] contains several batteries of statistical tests. In TestU01 the sequence of bits can alternatively be considered as a succession of real values in (0, 1). In consequence, the hypothesisH0can be divided as follows :
– the tested sequence is a succession of independent and uniformly distributed reals in (0, 1) (HA
0 ),
– the tested sequence is a succession of independent bits taking values of zero and one with the same probability (HB
0 ).
The tests included in the batteries are written so that they can verify eitherH0AorH0B.
When a sequence of reals is considered then for each test the following p-value is computed :
p= P[Y ≥ y|H0] (5) where y is the realization of the test statistic Y . For some tests, p is considered as a uniformity measure, that is if p is close to 1 then the tested RNG is considered producing values with excessive uniformity while it is the opposite if pis close to 0. If p is very small then the test is failed but if there is a doubt on whether it is too small then the test must be repeated with another sequence until a clear answer is obtained.
In the case a sequence of bits is tested instead of reals then a right and a left p-value are calculated and the se-quence is rejected if either of them is close to 0 :
pR= P[Y ≥ y|H0]
pL= P[Y ≤ y|H0] (6)
5 Experimental results
In this section we present the results of perturbation experi-mentations on a TRNG implanted in a Via Nano processor. We have realised previous studies of TRNGs embedded in smart cards with temperature variations [38]. Our aim is to investigate whether this kind of component is also sensitive to such a perturbation and to realise a more thorough study with other means of disturbance.
In practice we use the Via EITX-3000 motherboard into which the processor is embedded. The processor is running Linux 2.6.32 and APIs developped by VIA [45] allow us to access the TRNG output. We remotely control the processor via a SSH connexion to a PC.
As specified in the documentation [44], two sources of random bits can be chosen. The first one is the direct out-put of the entropy source which consists in a combination of oscillators. The second one is the bit sequences produced by the entropy source that have been post-processed with a AES. As we want to observe perturbation effects on the en-tropy source, we must examine the random bits it generates. In consequence we apply the test batteries described prece-dently. For TestU01 we use two of them, Alphabit and Rab-bit having respectively 9 and 26 tests, as the others need at least 3600 MB random numbers to work and the acquisition time would be too long.
5.1 Design of the entropy source
The TRNG is based on classical designs using ring oscil-lators (loops composed of an odd number of “not” gates). Their principle is the sampling of a high frequency oscilla-tor by one with a slower frequency [17, 7, 20, 24].
The TRNG of the Via Nano processor is realized as de-scribed in Figure 10 [5]. Three independently free-running ring oscillators work in parallel and a bias voltage generator adjusts their frequencies between 450-810 MHz. Oscillators 2 and 3 have their frequencies divided by 8 and the resulting oscillating signals are combined through a XOR operation. The XOR output is used to control the frequency of oscil-lator 4 along with the bias generator. Osciloscil-lator 4 is said to have a frequency between 20 and 68 MHz. Finally, oscilla-tor 4 samples oscillaoscilla-tor 1 through a flip-flop and this process generates a sequence of bits.
Bias voltage generator Ring osc. 1 Ring osc. 2 Ring osc. 3 ÷ 8 ÷ 8 × Ring osc. 4 Flip Flop Raw sequence of bits
Fig. 10 Design of the studied TRNG entropy source
5.2 Temperature perturbation
This experience consists in heating and cooling the proces-sor and through it the TRNG. As the procesproces-sor is embedded in a motherboard, itself fitted with a heatsink, it is difficult to access. Fortunately, the processor heats itself when process-ing information. Therefore, by removprocess-ing the heatsink and using instead a fan we could attain up to 100◦C before it ceased working. For small temperatures we directly used the set up with the liquid nitrogen where the rod is completely inserted into the Dewar flask and the processor is maintained at its extremity. The processor was thus cooled down to 0◦C at most.
For different temperatures between 0-100◦C we analyzed random number sequences of 100 MB produced by the gen-erator. In normal conditions (at about 36◦C with the heatsink), the entropy source has poor performances as a bias occurs naturally. Therefore, our aim is to observe a deviation from this state rather than the apparition of a defect.
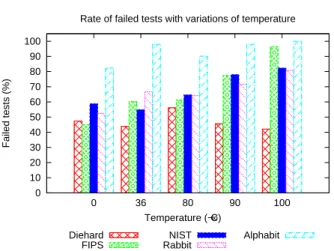
Figure 11 presents the results of statistical tests. Data from FIPS, Diehard, NIST and TestU01 tests give the per-centage of failures at each tested temperature. In this case, the hotter the temperature, the bigger the deviation from true random numbers and vice-versa. With an augmentation of the temperature appears an increase of the bias in the bit distribution as well as more important correlations.
Figures 12a and 12c show the error in the distributions of 1-byte and 2-bytes words and its evolution with the temper-ature. In theory the words should be uniformly distributed. The error is computed as follows:
Ei= Fi− Ni
Ni
(7) where i is the considered word, Fi is its percentage of ap-paritions and Niis its theoretical number of apparitions.
At 0◦C the words approximately follow a uniform distri-bution. Deviations appear whith the increasing temperature and more particularly at 100◦C. This effect is also observed on Figures 12b and 12d with the word Hamming weights (the number of bits to 1 in a word). Words with the smallest and biggest Hamming weights are those happening the most at 100◦C while they where equally probable at 0◦C.
0 10 20 30 40 50 60 70 80 90 100 0 36 80 90 100 Failed tests (%) Temperature (´C)
Rate of failed tests with variations of temperature
Diehard FIPS
NIST Rabbit
Alphabit
Fig. 11 Results of the statistical test with a temperature perturbation
This study allows us to understand the real effect behind the evolution of the statistical test performances.
5.3 Laser perturbation
In this experiment we want to impact the TRNG embedded in the processor with a laser beam. However, the available documentation does not indicate the TRNG precise loca-tion on the die. We decided to sweep the entire processor by small increments, shooting the laser at each position for a few seconds while a sequence of random numbers is gener-ated. Finally, each sequence of random numbers is analyzed and we build cartographies of the processor that represent the test results.
For better performances of the perturbation, we men-tioned that a layer of silicon should be removed from the component. During this step 570 µm of silicon were removed from the die initial thickness of 900 µm. Then the surface was polished to avoid an odd behavior of the laser beam at the impact, thinning the component further down by 80 µm. The size of the random number acquisitions was deter-mined by two factors:
– the whole processor (die size of 7.65 mm by 8.275 mm) is sweeped,
– the laser shot must last only a few seconds to avoid irre-versible damage.
Consequently we decided on acquisitions of 4 MB bytes at each location. Furthermore, in order to get an overview of the experiment results we used the ENT program. Other test batteries would compute statistics relatively to an hypothesis H0 whereas ENT gives values that caraterize a sequence properties which is more interesting in this case. For every value of the program we create a processor cartography.
Figure 13a shows a photography of the processor and its different components. Figure 13b presents a cartography on the value of the source entropy when considering bytes.
(a) 1-byte words distribution (b) 1-byte words distribution depending on their Hamming weight
(c) 2-bytes words distribution (d) 2-bytes words distribution depending on their Hamming weight Fig. 12 Words distribution for the TRNG with variations of temperature
This was obtained with steps of 50 µm and laser beam with a power of 1.05 W. The entropy measures the quantity of un-known information on the source output so that the smaller it is, the less random the numbers. If we consider the TRNG as a source X of n-bits random words then the entropy is calculated with the following formula:
H(X ) = − 2n−1
∑
i=0
Pi(X ) log(Pi(X )) (8) where Piis the occurrence probability of word i.
In Figure 13b, the black pixels show the location where a laser shot made the processor crash. They mostly corre-spond to cache emplacements where the program or the cre-ated data are stored. An interesting phenomenon is produced in the upper right corner of the processor where a ring ap-pears with smaller values of the entropy. A cartography of this location (Figure 13c) was realized with a laser beam of greater power (3.75 W) and smaller steps (30 µm). It throws some more details into relief, in particular, a small zone with a bigger loss of entropy becomes visible near the upper edge of the processor.
A further study of this interesting zone is realised in Sec-tion 5.6.
5.4 Perturbation with radioactive sources
We tested the reaction of the TRNG when subjected to the presence of radioactive sources as presented in Section 3.4.1. For each source several sequences of 100 MB were acquired and analysed. Figure 14 resumes results of the statistical tests. Am1refers to the Americium source with an activity
of 3.7 MBq and Am2an activity of 518 MBq. We do not
ob-serve any variations in the test results that would be mean-ingful about the source used and they are very similar to those without perturbation of the TRNG. This could be due to the fact that the sources activity is too low and the number of created electron-hole pairs not important enough to really disturb the TRNG.
(a) Photography of the Via Nano processor Entropy 7.9 7.92 7.94 7.96 7.98 8
(b) Cartography of the entropy
Entropy 7.86 7.88 7.9 7.92 7.94 7.96 7.98
(c) The entropy locally takes different values from the rest of the processor Fig. 13 Representations of the Via Nano processor
5.5 Perturbation by X-rays
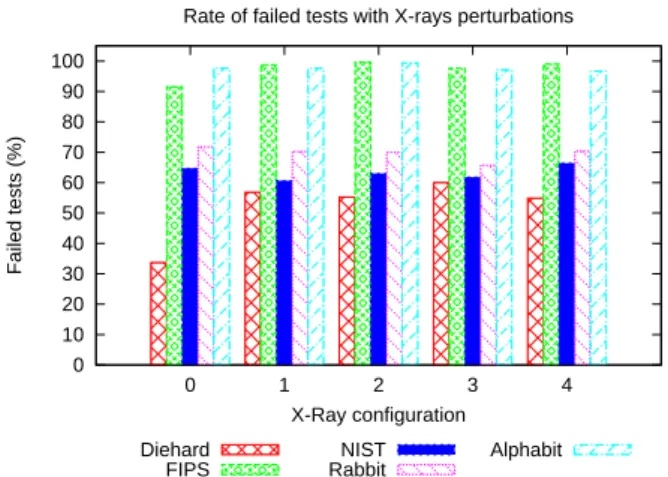
In this experiment the TRNG was impacted by X-rays as de-scribed in Section 3.4.2. Four configurations were tested and several random number sequences of 100 MB were acquired for each:
– the distance between the processor and the X-ray tube is 65 cm and its settings are 140 kV and 21 mA (1), – the distance between the processor and the X-ray tube is
65 cm and its settings are 70 kV and 40 mA (2),
– the distance between the processor and the X-ray tube is 25 cm and its settings are 70 kV and 40 mA (3),
– the distance between the processor and the X-ray tube is 25 cm and its settings are 160 kV and 18.75 mA (4). In configuration 4, the processor crashed some time after the beginning of the experiment. This can be explained by the fact that the processor receives radiations on its whole surface and all its functionnalities are impacted.
Figure 15 gives the results of the statistical tests. Config-uration 0 refers to the case without perturbation. The results
0 10 20 30 40 50 60 70 80 90 100
None Am1 Am2 Baryum Cesium
Failed tests (%)
Radioactive source
Rate of failed tests with perturbations through radioactive sources
Diehard FIPS
NIST Rabbit
Alphabit
Fig. 14 Results of the statistical test with different radioactive sources
are similar for all configurations which implies that there was no effect on the TRNG behavior.
0 10 20 30 40 50 60 70 80 90 100 0 1 2 3 4 Failed tests (%) X-Ray configuration
Rate of failed tests with X-rays perturbations
Diehard FIPS
NIST Rabbit
Alphabit
Fig. 15 Results of the statistical test with configurations of the test bench
5.6 Combination of laser and temperature perturbation Only the experiences with temperature variations and laser shots gave interesting results. We decided to experiment with the two perturbations in the meantime by observing effects on the interesting zone that was localized with laser shots. In addition to the laser perturbation on one point of this zone we let the processor temperature go up to 90◦C. As the combined effect of a laser shot and the temperature in-crease is near enough to crash the processor, we acquired several sequences of random numbers intersected by some waiting time. Between each acquisition the processor gets back to its normal state.
The previously used test of entropy on bytes reflects the deviation in the byte distribution from its theoretical
uni-form distribution. Every sequence of random numbers is di-vided in 10 sequential blocks of data, each one consisting of 400 MB. We compute the numbers distribution for each part of the sequences which gives us a progression of this information during a laser shot. We show in Figure 16 that this deviation not only depends on the perturbation but also evolves in time from the beginning of a laser shot. The figure presents the error on 1-byte and 2-bytes words distributions with and without the perturbations.
Figures 16a and 16c show that the word distributions have deviations which means that the TRNG is not perfect even in its normal behavior. These deviations represent a pattern that is stable through time. By comparison, the same study with a perturbed TRNG yields a different and chang-ing pattern as exposed in Figures 16b and 16d. The tendency of this evolution is toward a steep increase of a few error val-ues. At the beginning of the perturbations, the results already show more important deviations. By the end of the laser shot (after approximately 4-5 seconds), some words have much bigger probabilities of apparition which defeats the TRNG purpose.
Figure 17 represents the word distribution as a function of their Hamming weight. Here again an interesting phe-nomenon can be observed that explains in more details our previous observations. It shows the evolution of the occur-rence probability of the words with the smaller and bigger Hamming weight from the least to most likely.
In consequence, a few words have much bigger proba-bilities of apparition. This kind of result is exploited in brute force attacks. Instead of trying all possible words combina-tions, the search is reduced by the knowledge of the words the most likely to happen.
6 Conclusion
In this article we explained different means for the pertur-bation of TRNGs and statistical tests that should be used in order to detect defects in the random numbers generation. We presented results of such a study on a TRNG embed-ded in a Via Nano processor. Four test benches were oper-ated. The first one with temperature variation is very simple to set up and often yields a bias in the distribution of ran-dom numbers. In this case we showed that the hotter the temperature, the greater the deviation and vice-versa. The second test bench exploits a laser that is more difficult to set up. However, interesting effects could also be observed with this configuration. The generation of cartographies of the processor with different laser diode powers brought out positions where there was an influence on the TRNG. This was observed with a loss of entropy in these zones. The ex-periments with radioactive sources and X-rays did not show a perturbation of the TRNG behavior. The last experiment, by mixing the application of a hot temperature and laser
(a) 1-byte words distribution with the processor in a normal state (b) 1-byte words distribution with the perturbations
(c) 2-bytes words distribution with the processor in a normal state (d) 2-bytes words distribution with the perturbations Fig. 16 Words distribution for the TRNG with and without perturbations
shots, allowed us to apply a bigger perturbation knowing that separately deviations were observed. Studies of the gen-erated random numbers as 8 and 16-bits words showed bi-ases with substantial amplitudes in their distribution. Also, they yielded information about the evolution of this bias in time during a perturbation.
This work points out the very obvious need to study the reaction of TRNGs to perturbations. Indeed, cryptographic post-processing may be able to suppress defects in the gen-erated sequences of random numbers but their utilization is not always compulsory. It is then necessary to create some kind of countermeasures against perturbations, independantly to the post-processing involved. Not only should TRNGs be subjected to some kind of stress but different type of perturbations should be used as there is no assurance they should have only one weakness. Furthermore, in addition to showing losses in TRNG performances, such studies can and should help to design robust circuits suitable for even most critical applications in term of security. As even simple and easy to set up experiments can show interesting results,
there is no reason as to why such a step should be bypassed. For some TRNG utilizations, this verification is mandatory and this article presents tools to monitor their performance. Finally, we highlighted problems concerning the choice of the statistical tests. Though they show tendencies in TRNG performances, it is not always clear how it reflects on the generated numbers. Moreover, it is best to use several bat-teries in order to get the best possible knowledge of TRNG.
References
1. Agence National de la Sécurité des Systèmes d’Information: Référentiel Général de Sécurité. http://www.ssi.gouv.fr/fr/ reglementation-ssi/referentiel-general-de-securite/ (2010) 2. Barker, E., Kelsey, J.: Recommendation for Random Number
Generation Using Deterministic Random Bit Generators. Tech. rep., NIST SP 800-90A (2012)
3. Baudet, M., Lubicz, D., Micolod, J., Tassiaux, A.: On the Secu-rity of Oscillator-Based Random Number Generators. Journal of Cryptology pp. 1–28 (2010)
4. Bourgoin, J.C.: Production des défauts par irradiation dans les semi-conducteurs. J. Phys. Colloques 34(C5), 49–60 (1973)
(a) 1-byte words distribution with the processor in a normal state (b) 1-byte words distribution with the perturbations
(c) 2-bytes words distribution with the processor in a normal state (d) 2-bytes words distribution with the perturbations Fig. 17 Words distribution depending on their Hamming weight for the TRNG with and without perturbations
5. Cryptography Research: Evaluation of VIA C3 Nehemiah RNG. http://www.cryptography.com/public/pdf/VIA_rng.pdf (2003) 6. DarkMirage: PS3 Completely Cracked. http://www.darkmirage.
com/2011/01/06/ps3-completely-cracked/ (2011)
7. Dichtl, M., Janssen, N.: A High Quality Physical Random Number Generator. In: Eurosmart Security Conference Proceedings (2000) 8. Dubois, T.: Etude de l’effet d’ondes électromagnétiques sur le fonctionnement de circuits électroniques – Mise en place d’une méthode de test des systèmes. électronique, Université Montpel-lier 2 (2009)
9. El Haje, F., Golubev, Y., Liardet, P.Y., Teglia, Y.: On Statistical Testing of Random Numbers Generators. In: SCN’06, pp. 271– 287. Springer-Verlag (2006)
10. Fail0verflow: Console Hacking 2010: PS3 Epic Fail. http://events. ccc.de/congress/2010/Fahrplan/attachments/1780_27c3_console_ hacking_2010.pdf (2010)
11. Federal Information Processing Standards Publication: FIPS PUB 140-2, Security Requirements for Cryptographic Modules (2001) 12. Fischer, V., Drutarovský, M.: True Random Number Generator Embedded in Reconfigurable Hardware. In: Revised Papers from the 4th International Workshop on Cryptographic Hardware and Embedded Systems, CHES ’02, pp. 415–430. Springer-Verlag, London, UK (2003)
13. Gentle, J.E.: Random Number Generation and Monte Carlo Meth-ods, 2nd edn. Springer (2004)
14. Goldsmid, H.J.: Introduction to Thermoelectricity. Springer series in materials science; 121. Springer, Heidelberg (2010)
15. Habing, D.H.: The Use of Lasers to Simulate Radiation-Induced Transients in Semiconductor Devices and Circuits. IEEE Trans-actions on Nuclear Science 12(5), 91–100 (1965)
16. Heninger, N.: There’s no need to panic over factorable keys– just mind your Ps and Qs. https://freedom-to-tinker.com/blog/ nadiah/new-research-theres-no-need-panic-over-factorable-keys-just-mind-your-ps-and-qs (2012)
17. Jun, B., Kocher, P.: The Intel Random Number Generator. www.cryptography.com/public/pdf/IntelRNG.pdf (1999) 18. Killmann, W., Schindler, W.: A proposal for : Functionality classes
for random number generators. Tech. Rep. 2, Bundesamt für Sicherheit in der Informationstechnik (BSI), Bonn (2011) 19. Knuth, D.E.: The Art of Computer Programming, vol. 2:
Seminu-merical Algorithms, 3rd edn. Addison-Wesley Longman Publish-ing Co., Inc., Boston, MA, USA (1997)
20. Kohlbrenner, P., Gaj, K.: An Embedded True Random Number Generator for FPGAs. In: Proceedings of the 2004 ACM/SIGDA 12th international symposium on Field programmable gate arrays, FPGA ’04, pp. 71–78. ACM, New York, NY, USA (2004) 21. L’Ecuyer, P., Simard, R.: TestU01: A C Library for Empirical
Test-ing of Random Number Generators. ACM Transactions on Math-ematical Software 33 (2007)
22. Lehmer, D.H.: Mathematical Methods in Large-scale Computing Units. In: M.H.U.P. Cambridge (ed.) Proc. Sec. Symp. on Large-scale Digital Calculating Machinery, pp. 141–146 (1951) 23. Lenstra, A.K., Hughes, J.P., Augier, M., Bos, J.W.,
Klein-jung, T., Wachter, C.: Ron was wrong, Whit is right. http://eprint.iacr.org/2012/064 (2012)
24. Liu, C., McNeill, J.: A digital-PLL-based true random number generator. In: Proc. PhD Research in Microelectronics and Elec-tronics, vol. 1, pp. 113–116 (2005)
25. Markettos, A.T., Moore, S.W.: The Frequency Injection Attack on Ring-Oscillator-Based True Random Number Generators. In: Pro-ceedings of the 11th International Workshop on Cryptographic Hardware and Embedded Systems, CHES ’09, pp. 317–331. Springer-Verlag, Berlin, Heidelberg (2009)
26. Marsaglia, G.: The Marsaglia Random Number CDROM includ-ing the Diehard Battery of Tests. http://stat.fsu.edu/pub/diehard/ (1995)
27. May, T.C., Woods, M.H.: A New Physical Mechanism for Soft Errors in Dynamic Memories. In: Proc. 16th Annual Reliability Physics Symp, pp. 33–40 (1978)
28. Menezes, A.J., Vanstone, S.A., Oorschot, P.C.V.: Handbook of Applied Cryptography, 1st edn. CRC Press, Inc., Boca Raton, FL, USA (1996)
29. von Neumann, J.: Various techniques used in connection with ran-dom digits. National Bureau of Standards, Applied Math Series, 11, pp. 36–38 (1951)
30. Petrie, C.S., Connelly, J.A.: A noise-based IC random number generator for applications in cryptography. Circuits and Systems I: Fundamental Theory and Applications, IEEE Transactions on 47(5), 615–621 (2000)
31. Poucheret, F., Tobich, K., Lisart, M., Chusseau, L., Robisson, B., Maurine, P.: Local and Direct EM Injection of Power Into CMOS Integrated Circuits. In: FDTC’11, pp. 100–104 (2011)
32. Rukhin, A., Soto, J., Nechvatal, J., Barker, E., Leigh, S., Levenson, M., Banks, D., Heckert, A., Dray, J., Vo, S., Rukhin, A., Soto, J., Smid, M., Leigh, S., Vangel, M., Heckert, A., Dray, J., Bassham III, L.E.: A Statistical Test Suite for Random and Pseudorandom Number Generators for Cryptographic Applications. Tech. rep., NIST SP 800-22 (Revision 1a) (2010)
33. Santoro, R., Sentieys, O., Roy, S.: On-the-Fly Evaluation of FPGA-Based True Random Number Generator. In: VLSI, 2009. ISVLSI ’09. IEEE Computer Society Annual Symposium on, pp. 55–60 (2009)
34. Schindler, W., Killmann, W.: Evaluation Criteria for True (Physi-cal) Random Number Generators Used in Cryptographic Appli-cations. In: B. Kaliski, C. KoC, C. Paar (eds.) Cryptographic Hardware and Embedded Systems - CHES 2002, Lecture Notes in Computer Science, vol. 2523, pp. 431–449. Springer Berlin / Heidelberg (2003)
35. Selmer, E.S.: Linear recurrence relations over finite fields. Depart-ment of Mathematics, University of Bergen (1966)
36. Šimka, M., Drutarovský, M., Fischer, V.: Testing of PLL-based True Random Number Generator in Changing Working Condi-tions. Radioengineering 20(1), 94–101 (2011)
37. Skorobogatov, S.P., Anderson, R.J.: Optical Fault Induction At-tacks. In: Revised Papers from the 4th International Workshop on Cryptographic Hardware and Embedded Systems, CHES ’02, pp. 2–12. Springer-Verlag, London, UK (2003)
38. Soucarros, M., Canovas-Dumas, C., Clediere, J., Elbaz-Vincent, P., Real, D.: Influence of the Temperature on True Random Number Generators. In: Hardware-Oriented Security and Trust (HOST), 2011 IEEE International Symposium on, pp. 24 –27 (2011)
39. Sunar, B., Martin, W.J., Stinson, D.R.: A Provably Secure True Random Number Generator with Built-In Tolerance to Active At-tacks. IEEE Transactions on Computers 56(1), 109–119 (2007)
40. Sze, S.M.: Physics of Semiconductor Devices, 2nd edn. John Wi-ley & Sons (1981)
41. Terrazon Semiconductor: Soft Errors in Electronic Memory. http://www.tezzaron.com/about/papers/soft_errors_1_1_secure.pdf (2004)
42. Trichina, E., Bucci, M., De Seta, D., Luzzi, R.: Supplemental Cryptographic Hardware for Smart Cards. IEEE Micro 21, 26– 35 (2001)
43. United Nations Scientific Committee on the Effects of Atomic Ra-diation: Sources and effects of ionizing radiations, vol.1: Sources. Report to the general assembly, UNSCEAR (2000)
44. VIA: Padlock Quick Reference (2008)
45. VIA: VIA Padlock Software Development Kit. http://www.via arena.com/Download/PadlockSDK_3.1_Release_20090121.zip (2009)
46. Walker, J.: HotBits: Genuine random numbers, generated by ra-dioactive decay. https://www.fourmilab.ch/hotbits/ (1996) 47. Walker, J.: Pseudorandom Number Sequence Test Program.
http://www.fourmilab.ch/random/ (2008)
48. Yoo, S.K., Karakoyunlu, D., Birand, B., Sunar, B.: Improving the Robustness of Ring Oscillator TRNGs. ACM Trans. Reconfig-urable Technol. Syst. 3, 9:1–9:30 (2010)