HAL Id: hal-01420098
https://hal.archives-ouvertes.fr/hal-01420098v2
Submitted on 3 Jan 2017
HAL is a multi-disciplinary open access
archive for the deposit and dissemination of
sci-entific research documents, whether they are
pub-lished or not. The documents may come from
teaching and research institutions in France or
abroad, or from public or private research centers.
L’archive ouverte pluridisciplinaire HAL, est
destinée au dépôt et à la diffusion de documents
scientifiques de niveau recherche, publiés ou non,
émanant des établissements d’enseignement et de
recherche français ou étrangers, des laboratoires
publics ou privés.
Collaboration around Wall-Displays in Command and
Control contexts
Arnaud Prouzeau
To cite this version:
Arnaud Prouzeau. Collaboration around Wall-Displays in Command and Control contexts. [Other]
LRI, Univ. Paris-Sud, CNRS, Inria, Université Paris-Saclay. 2016. �hal-01420098v2�
Collaboration around Wall-Displays in Command and
Control contexts
Arnaud Prouzeau
LRI, Univ. Paris-Sud, CNRS, Inria, Universitris-Saclay
F-91405 Orsay, France
[email protected]
ABSTRACT
High resolution wall-dispays are more and more used in re-search contexts in order to visualize, explore and study big dataset. They provide a huge visual space to display data, physical navigation rather virtual, which leads to a more natu-ral pan and zoom, and finally an easy way to collaborate due to their large shared space. Their use in a more operational context like control rooms is more limited, they are most of the time considered as just a big display with which you interact with mice and keyboards. During this PhD, we would like to study how we could embrace the benefits of a wall-display in command and control contexts. To answer this question, we first analyzed the activities in a control room in general, and then focus in a specific use case: road traffic control. In this specific context, we are now working on an experiment to compare the use of a wall-display and several workstations. Then we focussed on collaboration, and study the use of a wall display to perform multi user exploration of graphs, a data structure commonly used in command and control centre. Finally, we studied the use of the capacity of a high resolution wall to help operators assess the impact of their action.
Author Keywords
Wall-display, Collaboration, Graph, Critical System
ACM Classification Keywords
H.5.2 [Information Interfaces and Presentation]: User Inter-faces - Graphical user interInter-faces
INTRODUCTION
High density information spaces are more and more com-mon, some of them containing several millions of data points, such as social networks, scientific database (DNA, Molecules) but also transportation networks. To analyse, understand but also monitor these data, complex interactive visualizations are needed. Wall-sized displays represent a convenient way to immerse and allow users to navigate and manipulate data in these kind of spaces due to several inherent benefits: (i) physical rather than virtual navigation affords a natural pan-and-zoom in the information space to see overview from afar and details up-close; (ii) an enlarged physical space in front of the display enables collaborative viewing; (iii) and millions of pixels support viewing large amounts of data.
Wall-displays are for now mostly used to their full interactive and visualization potential in research contexts only [2], in
more operational and industrial contexts they are used as big computer displays, in which most of the interactions are distant and done with a mouse and a keyboard. This is especially the case in command and control contexts. Indeed, in several control rooms, they are used to give an overview of the system to operators in order to enhance situation awareness, but all the manipulations are done on individual workstations. This situation provokes a lack of group awareness, as it is harder for an operator to be aware and understand what another colleague is doing when focusing on their desktop, and so harder to coordinate their actions.
The lack of adoption of wall-displays as more than monitors leads to our research question: Could interactive wall-displays be useful in collaborative command and control environment? In the remaining of this paper, we will first perform an analysis of control room activities, then we study how the use of an interactive wall-displays can impact coordination between two operators, compared to the use of several workstations. We will then discuss our work on multi-user exploration of graphs on a wall display, as graphs are a data structure which is use a lot to visualize transportation networks. Finally, we introduce a specific use-case: road traffic control, and how to use the full potential of an high-resolution wall in order to help operators monitor, but also forecast the effect of possible interventions on the traffic in big cities like Paris.
ANALYSIS OF CONTROL ROOM ACTIVITIES
In control room contexts, it is crucial to be aware of what the other operators are doing in the room, in order to collaborate and coordinate their actions. This is particularly necessary in cases of emergency, where coordinate cost should be as low as possible to act as fast as possible. This is illustrated in the study of the London subway control room by Smith et al. [13], in which to enhance group awareness, subway controllers put on speaker their conversation with train drivers, giving others information about the current situation with this train, and allow them to act quickly in case of incident.
Interviews of operators from different fields (road traffic con-trollers from before, one air traffic controller and one nuclear power plant operator), visits of control rooms (two Paris road traffic control room, the French police operation centre) and my past experiences (Visits of French and Scottish air traffic control centres and airport control towers) showed us that we can find mainly two types of situations in this context: (i) The
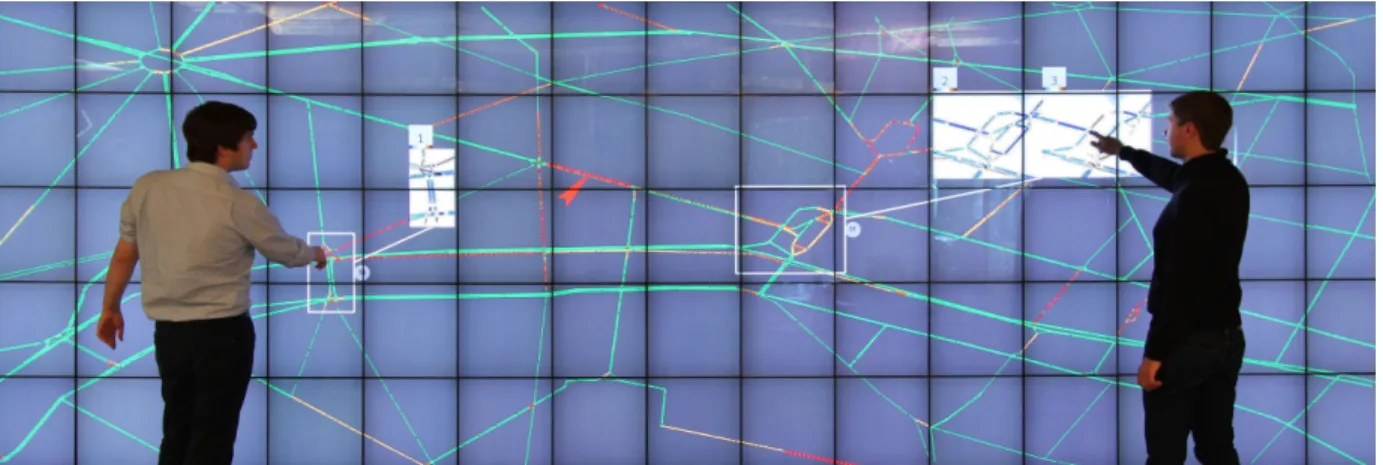
Figure 1. Visualization of traffic in a city with two “DragMagics” (white rectangles) showing one (left) and two (right) simulations associated with different possible interventions on the traffic. The simulation visualizations use difference color maps to highlight differences with the real traffic.
normal situations, in which the operators mainly monitor the system,don’t need to act a lot and don’t need to coordinate their actions with others. It represents most of their time dur-ing a shift in the control room. And (ii) the critical situations, that can correspond to an accident, a failure in the system, or just a situation in which the system is saturated (traffic jam for road traffic control) and for which the automation can’t provide an optimized solution. In that case, the operators need to act, but also to coordinate their actions with others. As usually these situations are time critical the coordination has to be done at the same time as the action.
These also showed us the main general layout of a control room: the operators work on individual workstations, and they have a shared large visualization of the system projected on a shared surface. The large visualization is used to provide context information, while the workstation is used to provide detailed information and to act on the system.
A high resolution wall-displays provides a large space that can be used to display general information about the state of the system, but also detailed information about a specific part of it when viewed up-close due to its high resolution. It can also provide more direct way to interact with the system by directly touching it, which can attenuate divided attention issues. This way of interacting with the wall provides more information about an operator’s action to others which improves group awareness, and can facilitate group coordination, as operators can just point with their fingers at a part of the system they are talking about.
COMPARISON OF A WALL DISPLAY WITH WORKSTA-TIONS
Empirical studies support the idea that large displays foster collaboration. Nevertheless, to our knowledge, no study quan-titatively compares collaboration using a large vertical display, with a setup that doesn’t possess its characteristics, i.e., the large and shared surface. In this paper, we measure perfor-mance and coordination differences when pairs use a large display, compared to two workstations that share a common view. Workstations are far enough to avoid face-to-face and deictic communication, while allowing verbal communication.
The configuration of the two workstations are similar to the configuration seen in control rooms.
To quantitatively study collaboration, we chose a low level task, to better control task difficulty across setups, and allow for multiple repetitions. Inspired by previous work on col-laboration [14] and by real tasks performed in control rooms, we used a simplified path-finding task with constraints. We expected our pairs to develop efficient collaboration strategies over multiple trials, eventually reducing the need for coordina-tion and decision making that are essential in collaboracoordina-tion [8]. As such, we did not provide any training to our participants, but rather compared the learning phase across settings, as this is where pairs need to communicate and coordinate to improve their strategy.
Moreover, to study possible trade-offs between the setups, we also measured other metrics that could shed light to differ-ences in collaboration, such as the amount of communication between pairs and their coordination strategies.
We were unable to measure a difference in learning between setups, but pairs were generally faster using workstations. Nevertheless, quality was more consistent with the large dis-play, and pairs communicated and planed more in this setup. With workstations, pairs divided the task as much as possible, requiring less communication, and affecting their quality of work.
Now that we show that the wall facilitates communication and coordination compared to two workstations, we want to see what can have an influence on collaboration. We then study the influence of interaction technique on collaboration strategy.
MULTI-USER GRAPH EXPLORATION
Graph structures, consisting of vertices and edges, exist in various application areas, such as traffic networks, they are frequently represented as node-link diagrams. But like many visual representations of large datasets today, they can be too wide to view comfortably on regular screen monitors. We thus propose viewing and exploring them on a wall-displays. We perform a first systematic study of how pairs use a wall-display to solve topology based tasks, that are common
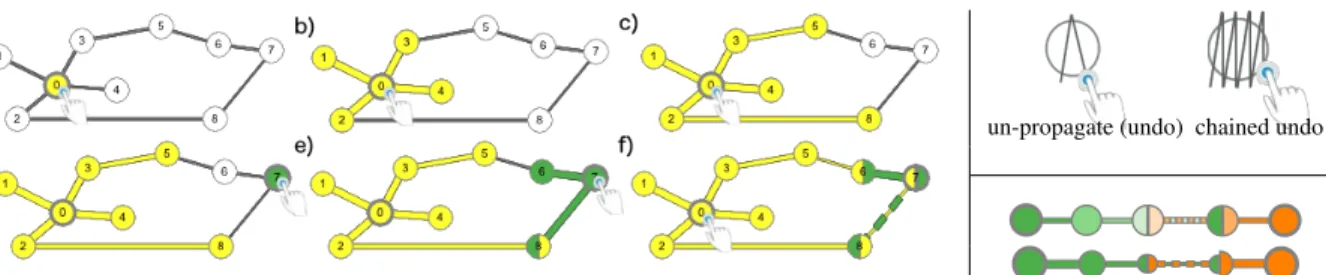
com-un-propagate (undo) chained undo
Figure 2. On the left multiple propagations: (a) a first tap on node 0 selects it; (b) a second tap propagates the selection to immediate neighbors; (c) and a third tap to 2nd degree neighbors (notice the difference in link width according to distance); (d) a tap on node 7 selects it with a new color; (e) a second tap selects its neighbors, one of which (node 8) is shared with the first propagation and has both colors; (f) a fourth tap on node 0 propagates the first selection a third time, resulting in nodes 6,7,8, and link 8-7 being shared between propagations, with the color and width on shared link 8-7 alternating. On the top right gesture to undo one propagation step on a node (left) and chained undo for backtracking multiple steps (right). On the bottom right design variations for displaying propagation distance using color intensity (top) and node-link size (bottom).
ponents of more complex graph analysis tasks [5]. We study how the choice of interaction technique supports or hinders pairs collaborating on these tasks, as it is shown for a data manipulation task by Liu et Al. [6]. We focus on techniques for selection, a fundamental visualization task, as it is a pre-requisite to many interactions such as filtering, comparisons, details on demand, etc.
We adapt two general purpose graph selection techniques for use by multiple users on a touch-enabled wall-display. Our baseline is a basic node/edge selection. It is easy to master, and has a limited, and thus fairly localized, visual footprint on the wall display, that does not interfere with colleagues’ work. We called this technique Basic. The propagated selection extends, for multiple users, the idea of transmitting a selection to neighboring nodes/edges [9] It highlights the connectivity structure of the graph, but may have a large visual footprint that disturbs colleagues. We called it Propagation (Figure 2). We first assess the impact of selection technique on pairs con-ducting a specific topology analysis task, namely identifying a shortest path. As this is the first study of pairs working on such tasks on wall-displays, we tease out effects due to technique vs. collaboration, by also studying single user selections. We then examine how propagation, the most promising technique, is used by pairs on other graph analysis tasks [5]. Our stud-ies are conducted on a touch enabled wall-display, instead of interacting using mice and keyboards, as mobility allows viewers to perform implicit zooming [1] and correct for visual distortions [7].
The first study showed Propagation to be faster in both individ-ual and multi-user contexts, to be more accurate for multiple users, and to require less movement than Basic in a shortest path identification task. It is also versatile enough to be used in a series of topology tasks, observed in our second study. Nevertheless, as Propagation has a large visual footprint, it requires higher coordination when used by multiple users, we often found pairs alternate their interactions to coordinate ac-tions. When working in pairs, propagation selection increases accuracy overall, but due to a coordination cost it improves time only for complex graphs. When using basic selection, that has a small visual footprint, accuracy dropped for pairs, most noticeably in complex graphs. Indeed, we observed that using basic selections, participants tended to work
inde-pendently and lose awareness of each other’s work, which proved detrimental for the task we consider, that is not clearly divisible.
ROAD TRAFFIC MANAGEMENT ON WALL-DISPLAYS
Finally we want to study the use of a wall display in a specific use-case: road traffic control management. Traffic congestion in major cities and highways is a growing problem in most countries. Perturbations and incidents such as accidents and breakdowns, or exceptional events such as demonstrations, can overload a road network that may already be operating at its limit, e.g. during rush hour. To prevent and to react efficiently to incidents and perturbations, road traffic in cities and highways is monitored in dedicated control centers. Even for experienced operators, it is often challenging to eval-uate the impact of an intervention on the network. While they are equipped with predefined traffic plans (sets of compatible interventions on a sector or area), it is still sometimes unclear which plan will work best for the current state of the network, in particular during exceptional events. This is where simula-tion models of road-traffic can help operators better understand and chose among possible intervention alternatives.
Road-traffic is a complex system that is particularly chal-lenging to model, as it involves multiple agents (cars) that can behave in a non-deterministic manner. Nevertheless, re-searchers are able to approximate road-traffic using methods from physics or statistics and machine learning Their sim-ulations can perform short-term traffic forecasting, identify problematic sectors with high-risk of traffic-congestion, and test new concepts to improve road-traffic such as dynamic adjustment of speed limits.
Following interviews and observations of road-traffic control centers, we extracted user needs related to both possible in-terventions they make, and the lack of support tools to help them understand the impact of these interventions. We then designed a prototype system for road-traffic monitoring and management that runs on a touch enabled ultra high-resolution wall display (Figure 1). Taking advantage of their high res-olution and large real-estate, our prototype extends the vi-sualizations currently used in road-traffic control centers, to allow operators to concurrently explore and visualize results from multiple simulations that can help them test alternative interventions on the network, both in a local and global scale.
We propose two visualization techniques for viewing multiple simulations in combination with real traffic: (i) multiple views [4, 15] to show global views of the network; and (ii) Drag-Magic, a combination of DragMags [16] and magic lenses [3] to visualize localized sectors. For the first time, we adapt and combine these techniques to visualize and compare several forecast visualizations using wall displays in control centers. Our choice of techniques is influences by both controllers’ comments on the type of feedback they require for monitoring and forecasting (on the whole network, but also more specifi-cally on one intersection), but also by our previous findings that global versus local focus can influence performance. To better understand when to use each of these techniques, we compared them in a lab experiment. Non expert participants were asked to follow several simulations of road traffic and to find the more fluid one.
Participants performed well in comparison tasks of up to 6 different simulations, contrary to previous findings on mul-tiple views [10] that predicted decreased performance with the increase of comparisons. Our results also suggest that DragMagic is easier to master and may be beneficial when the number of simulations to compare is high, but that both techniques are viable alternatives. Early feedback on our pro-totype from experts, were very promising. They particularly appreciate the DragMagic, and they say it can also be used to compare the present traffic with past traffic data to detect unusual events. Our study was conducted on a single user setup to first assess the impact of such novel visualization on user’s abilities to follow multiple simulations on the wall. It remains future work to also test these designs with multi-users. We took advantage of the high resolution of the wall-displays to show more information on the shared display, in the form of multiple simulation results. But we feel it was important, then, to study how people collaborate and coordinate in front of it. In order to isolate the coordination effect, we did our study in a more abstract context: graph exploration.
CONCLUSION
Due to their large size and high resolution, wall-displays can be an interesting solution to answer to current control rooms issues like group awareness for example. In that case, visual-ization and interaction techniques have to be designed with the the type of collaboration wanted in mind (close or loose). We want now to understand how operator will perform the transition between their workstations and the wall.
AKNOWLEDGEMENT
I thank my two supervisors, Anastasia Bezerianos and Olivier Chapuis, for their help and support and all the members of the ILDA team. This work has been partially supported by the ANR grant ANR-10-EQPX- 26-01 “Digiscope”. Details about part of this work can be found in these publications [11, 12].
BIBLIOGRAPHIE
1. Robert Ball, Chris North, and Doug A. Bowman. 2007. Move to improve: Promoting physical navigation to increase user performance with large displays. In CHI ’07. ACM, 191–200.
2. Anastasia Bezerianos and Petra Isenberg. 2012.
Perception of visual variables on tiled wall-sized displays for information visualization applications. IEEE TVCG 18, 12, 2516–2525.
3. Eric A. Bier, Maureen C. Stone, Ken Pier, William Buxton, and Tony D. DeRose. 1993. Toolglass and magic lenses: The see-through interface. In SIGGRAPH ’93. ACM, 73–80.
4. Waqas Javed and Niklas Elmqvist. 2012. Exploring the design space of composite visualization. In PACIFICVIS ’12. IEEE Computer Society, 1–8.
5. Bongshin Lee, Catherine Plaisant, Cynthia Sims Parr, Jean-Daniel Fekete, and Nathalie Henry. 2006. Task taxonomy for graph visualization. In BELIV ’06. ACM, 1–5.
6. Can Liu, Olivier Chapuis, Michel Beaudouin-Lafon, and Eric Lecolinet. 2016. Shared interaction on a wall-sized display in a data manipulation task. In CHI ’16. ACM, 2075–2086.
7. María-Jesús Lobo, Emmanuel Pietriga, and Caroline Appert. 2015. An evaluation of interactive map comparison techniques. In CHI ’15. ACM, 3573–3582. 8. Munir Mandviwalla and Lorne Olfman. 1994. What do
groups need? a proposed set of generic groupware requirements. ACM TOCHI 1, 3, 245–268.
9. Michael McGuffin and Igor Jurisica. 2009. Interaction techniques for selecting and manipulating subgraphs in network visualization. IEEE TVCG 15, 6, 937–944. 10. Matthew D. Plumlee and Colin Ware. 2006. Zooming
versus multiple window interfaces: Cognitive costs of visual comparisons. ACM ToCHI 13, 2, 179–209. 11. Arnaud Prouzeau, Anastasia Bezerianos, and Olivier
Chapuis. 2016a. Evaluating multi-user selection for exploring graph topology on wall-displays. IEEE Trans. Visual. Comput. GraphicsPP, 99, 1–1. DOI:
10.1109/TVCG.2016.2592906
12. Arnaud Prouzeau, Anastasia Bezerianos, and Olivier Chapuis. 2016b. Towards road traffic management with forecasting on wall displays. In Proceedings of the 2016 ACM on Interactive Surfaces and Spaces (ISS ’16). ACM, 119–128. DOI:10.1145/2992154.2992158
13. Penn Smith, Ann Blandford, and Jonathan Back. 2008. Questioning, exploring, narrating and playing in the control room to maintain system safety. Cognition, Technology & Work11, 4, 279–291.
14. Anthony Tang, Melanie Tory, Barry Po, Petra Neumann, and Sheelagh Carpendale. 2006. Collaborative coupling over tabletop displays. In CHI ’06. ACM, 1181–1190. 15. Edward R. Tufte. 1986. The Visual Display of
Quantitative Information. Graphics Press, Cheshire, CT, USA.
16. Colin Ware and Marlon Lewis. 1995. The dragmag image magnifier. In CHI ’95. ACM, 407–408.