HAL Id: hal-00296552
https://hal.archives-ouvertes.fr/hal-00296552
Submitted on 22 May 2008
HAL is a multi-disciplinary open access
archive for the deposit and dissemination of
sci-entific research documents, whether they are
pub-lished or not. The documents may come from
teaching and research institutions in France or
abroad, or from public or private research centers.
L’archive ouverte pluridisciplinaire HAL, est
destinée au dépôt et à la diffusion de documents
scientifiques de niveau recherche, publiés ou non,
émanant des établissements d’enseignement et de
recherche français ou étrangers, des laboratoires
publics ou privés.
contributions in Beijing in 2004 using positive matrix
factorization
S. D. Xie, Z. Liu, T. Chen, L. Hua
To cite this version:
S. D. Xie, Z. Liu, T. Chen, L. Hua. Spatiotemporal variations of ambient PM10 source contributions
in Beijing in 2004 using positive matrix factorization. Atmospheric Chemistry and Physics, European
Geosciences Union, 2008, 8 (10), pp.2701-2716. �hal-00296552�
© Author(s) 2008. This work is distributed under the Creative Commons Attribution 3.0 License.
Chemistry
and Physics
Spatiotemporal variations of ambient PM
10
source contributions in
Beijing in 2004 using positive matrix factorization
S. D. Xie1, Z. Liu1, T. Chen2, and L. Hua2
1College of Environmental Sciences and Engineering, State Key Joint Laboratory of Environmental Simulation and Pollution
Control, Peking University, Beijing 100871, People’s Republic of China
2Beijing Municipal Environmental Monitoring Center, Beijing 100044, People’s Republic of China
Received: 1 October 2007 – Published in Atmos. Chem. Phys. Discuss.: 11 January 2008 Revised: 7 May 2008 – Accepted: 7 May 2008 – Published: 22 May 2008
Abstract. Source contributions to ambient PM10 (particles with an aerodynamic diameter of 10 µm or less) in Bei-jing, China were determined with positive matrix factoriza-tion (PMF) based on ambient PM10composition data
includ-ing concentrations of organic carbon (OC), elemental car-bon (EC), ions and metal elements, which were simultane-ously obtained at six sites through January, April, July and October in 2004. Results from PMF indicated that seven major sources of ambient PM10 were urban fugitive dust,
crustal soil, coal combustion, secondary sulfate, secondary nitrate, biomass burning with municipal incineration, and vehicle emission, respectively. In paticular, urban fugitive dust and crustal soil as two types of dust sources with simi-lar chemical characteristics were differentiated by PMF. Ur-ban fugitive dust contributed the most, accounting for 34.4% of total PM10 mass on an annual basis, with relatively high
contributions in all four months, and even covered 50% in April. It also showed higher contributions in southwestern and southeastern areas than in central urban areas. Coal com-bustion was found to be the primary contributor in January, showing higher contributions in urban areas than in subur-ban areas with seasonal variation peaking in winter, which accounted for 15.5% of the annual average PM10
concen-tration. Secondary sulfate and secondary nitrate combined as the largest contributor to PM10 in July and October, with
strong seasonal variation peaking in summer, accounting for 38.8% and 31.5% of the total PM10 mass in July and
Oc-tober, respectively. Biomass burning with municipal incin-eration contributions were found in all four months and ac-counted for 9.8% of the annual average PM10 mass
concen-tration, with obviously higher contribution in October than in other months. Incineration sources were probably located
Correspondence to: S. D. Xie
in southwestern Beijing. Contribution from vehicle emis-sion accounted for 5.0% and exhibited no significant sea-sonal variation. In sum, PM10 source contributions in
Bei-jing showed not only significant seasonal variations but also spatial differences.
1 Introduction
According to the Report on the State of the Environment in China issued by State Environmental Protection Administra-tion (SEPA), from 2003 through 2006, there were 54.4%, 53.2%, 48.1% and 43.4% of Chinese cities where annual av-erage daily concentration of PM10 (inhaled particulate
mat-ter, particles with an aerodynamic diameter of 10 µm or less) exceeded the level II of National Ambient Air Quality Stan-dard 100 µg m−3(State Environmental Protection
Adminis-tration (SEPA), 2005, 2007). PM10 has become the primary
air pollutant in cities of China. Therefore, source apportion-ment studies are of great significance for controlling ambient PM10pollution in China.
Research on sources of ambient particulate matter began with analyzing source emission inventories and using disper-sion models based on them. The focus shifted from source to receptor in the 1970s. Receptor models identify and appor-tion sources by analyzing aerosol chemical composiappor-tions and physical parameters at a sampling site (or receptor) without information about source strengths, do not rely on meteoro-logical data, and can identify fugitive emission sources. With such advantages, receptor models have been developing fast from its birth. Based on whether source profiles should be known at first, receptor models can be divided into two cat-egories: chemical mass balance model (CMB) and various forms of multivariate statistical models.
Wang (1985) performed the earliest source apportionment study for ambient aerosols in Beijing using factor analysis. Recently, Okuda et al. (2004) performed a CMB study with daily concentrations of trace metals and ionic constituents in aerosols in Beijing from 2001 through 2003, and identified crustal soil and coal combustion as two primary sources. Dan et al. (2004) identified PM2.5sources in Beijing by
compar-ing concentrations of OC, EC and trace elements at receptor sites. Zheng et al. (2005) determined 9 sources of PM2.5 in
Beijing using CMB model with particle-phase organic com-pounds as fitting tracers. Bi et al. (2005) performed a CMB source apportionment of ambient PM10in six cities in
north-ern China based on measured chemical profiles of local re-suspended dust and coal combustion emission, and found resuspended dust and coal fly ash to be the primary PM10
sources. However, it is difficult to establish databases of spe-cific local source profiles for CMB studies. Furthermore, similarities among some source profiles may easily cause problems of collinearity. The CMB studies above used a va-riety of source categories and profiles which led to the poor comparability of their results, due to the incomplete informa-tion on local source profiles.
Therefore, multivariate statistical methods have been used more extensively for source apportionment of ambient parti-cles in China in recent years. Sun et al. (2004) performed a factor analysis for a preliminary discussion of ambient PM10 sources in Beijing. Wang et al. (2005) used Ca2+/Al
ratio to estimate the mixing of different dust sources and roughly calculated PM2.5source contributions by factor
anal-ysis. But these traditional statistical methods could not iden-tify sources elaborately and precisely.
A new approach named positive matrix factorization (PMF) developed by Paatero and Tapper (1994, 1997) takes an explicit least squares approach by integrating non-negative constrains into the optimization process and utiliz-ing the error estimates for each data value as point-by-point weights. Due to the advantages over traditional factor anal-ysis methods, during the last one or two decades, PMF was successfully used in source apportionment of airborne par-ticulate matter in the United States (Kim and Hopke, 2006), Switzerland (Lanz et al., 2007), Spain (Zabalza et al., 2006), Mexico (Johnson et al., 2006), Canada (Lee et al., 2003), Korea (Han et al., 2005), as well as in China (Lee et al., 1999; Yuan et al., 2006; Song et al., 2006, 2007). Most recently, Reff et al. (2007) reviewed the methods for using PMF model, and recommended future publications to fully document procedures for data preparation, PMF application, and result interpretation.
Since December 1998, a series of measures have been taken to control pollution of SO2, NOx and PM10 in
Bei-jing. However, compared with the significant decline of SO2
concentration, from 80 µg m−3 in 1999 to 53 µg m−3,
am-bient PM10 mass concentration remained at a high level.
From 1999 to 2006, annual average PM10 mass
concen-trations were respectively 180, 162, 165, 166, 141, 149,
142 and 161 µg m−3(Beijing Environmental Protection
Bu-reau, 2004, 2005, 2006), which were about 65% higher than National Ambient Air Quality Standard (level II) of 100 µg m−3. These concentrations were also more than two
times of those in magacities as New York, London, and Moscow. Previous control measures showed no significant effects at all, due to the complexity of PM10sources in
Bei-jing. With such background, we performed a source appor-tionment study using PMF model for ambient PM10 in
Bei-jing in 2004, in order to provide scientific basis for control-ling PM10pollution more effectively.
2 Methods
2.1 Sampling and chemical analysis
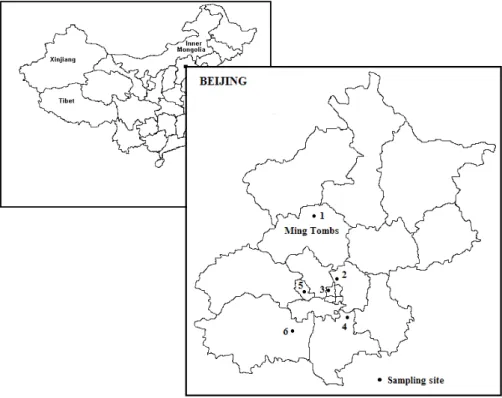
Six PM10 sampling sites were set up at Ming Tombs (MT),
Chegongzhuang (CGZ), Gucheng (GC), Fangshan (FS), Yizhuang (YZ), and National Olympic Sports Center (AT) (Chen et al., 2006), as shown in Fig. 1. Ming Tombs (MT) site located in Changping District and 45 km northeast from central Beijing is currently a background air quality moni-toring site for Beijing Environmental Monimoni-toring Network. Chegongzhuang (CGZ) site near Chegongzhuang East Road and National Olympic Sports Center (AT) site next to the Northern 4th ring road are two traffic sites representing dif-ferent streets in urban areas. Yizhuang (YZ) as suburban site near the Southern 5th Ring Road with Beijing’s southeastern industrial emission sources on its north is a typical represen-tation for economic development area. It is also located on the aerosol transport path in southeastern Beijing. Gucheng (GC) site, an industrial site, is located next to the Capital Iron and Steel Plant in western Beijing. Fangshan (FS), located in southwestern Beijing and surrounded by Beijing Yanshan Petrochemical Corporation as well as several building mate-rial plants producing cement, lime, and sandstones, is a typ-ical representation of centralized area by petrochemtyp-ical and building material industries. It is also a representative site on the southwestern aerosol transport path.
PM10 samples were collected using TH-16A
Medium-Volume Samplers made by Wuhan Tianhong Intelligence In-strumentation Facility simultaneously at these six sites on the middle ten days in January, April, July and October in 2004 with sampling duration of 23 h and 30 min on each sampling day, from 09:00 a.m. to the next 08:30 a.m. Quartz fiber filters were used for analysis of organic carbon (OC), ele-mental carbon (EC), and Teflon filters were used for analy-sis of PM10 mass concentration, elements and ions
concen-trations. Gravimetric method was used to determine PM10
mass concentration. Inductively coupled plasma mass trometry (ICP-MS), graphite furnace atomic absorption trometry (GF-AAS), hydrogenation atomic fluorescent spec-trometry (HG-AFS) were used to determine concentrations of 20 elements: Al, As, Ba, Ca, Cd, Cr, Cu, Fe, K, Mg,
Fig. 1. Locations of the sampling sites in Beijing 1. Ming Tombs (MT) 2. National Olympic Sports Center (AT) 3. Chegongzhuang (CGZ)
4. Yizhuang (YZ) 5.Gucheng (GC) 6. Fangshan (FS).
Mn, Na, Ni, Pb, Sc, Se, Si, Ti, V, and Zn. Ion Chromatog-raphy (IC) (Dionex, Model DX-500) was used for analyz-ing NH+4, NO−3, and SO2−4 concentrations. Organic carbon (OC) and elemental carbon (EC) were measured using a ther-mal/optical carbon analyzer produced by Sunset Laboratory Inc., USA. In total, 243 PM10samples were collected at the
six sites, for whom concentrations of PM10 species
men-tioned above were measured.
2.2 Source apportionment by positive matrix factorization 2.2.1 Positive matrix factorization (PMF) model
Positive matrix factorization (PMF, Paatero and Tapper, 1994, Paatero, 1997) is an advanced factor analysis tech-nique that uses negativity constraints and allows non-orthogonal factors. The bilinear factor analytic model de-noted as PMF2 can be written as,
X = GF + E (1)
where X is the n×m matrix of species concentrations in am-bient PM10; G is the n×p matrix of source contributions; F
is the p×m matrix of source profiles, and the residual matrix
E is defined as the difference between the observed
concen-tration X and the modeled values, Y: eij =xij−yij =xij−
p
X
k=1
gikfkj (2)
where i=1, ..., n samples; j =1, ..., m species; k=1, ..., p sources. The model uses least-squares fit of the data to mini-mize the objective function, Q(E), which is defined as
Q(E) = m X i=j m X j =1 (eij/σij)2 (3)
where σij is the standard deviation corresponding to the
ob-served value xij.
PMF was run in the robust mode, in order to decrease the impact of extreme values or outliers that are very common in environmental data (Paatero, 2004).
2.2.2 Data pretreatment
Missing concentration values and below detection limit (BDL) values were treated with the methods by Polissar et al. (1998): missing concentration values were replaced by the arithmetic mean concentration of that species and four times of this mean value were assigned as the correspond-ing uncertainties. BDL values were replaced by half of the detection limit (DLj) for that species and the corresponding
uncertainties were estimated as in Eq. (4). The uncertain-ties for determined values were estimated by the following Eqs. (5) and (6) (Jon Zabalza et al., 2006):
σ (xij < DLj) = xij+
2
EC, 6, 3.9% Trac e, .2, 2 .7% NH4 + , .9, 2.5 % SO 4 2 -, 14.5, 9.5% NO3 -, 7.9, 5.2% Organic s , 34.6, 22.6% Crust al, 69. 2, 45. 2% unknown, 12.7, 8.3% PM10 concentration in January, 2004, 153 μg m-3 EC, 7, 2.4% Trace , 9.6, 3 .3% NH4 + , 5.3, 1.8% SO 4 2 -, 28.2, 9.6% NO3 -, 23.2 , 7.9% Organ ics , 3 3, 11. 2% Crusta l, 128, 43.4 % unknown, 60.7, 20.6% PM10 concentration in April, 2004, 295 μg m-3 EC, 3 .2, 1.9 % Tra ce, 5.7, 3.5% NH4 + , 11.8, 7.2% SO 4 2 -, 44.1, 26.9% NO 3 -, 12.2, 7.4% Organics , 19, 11.6% Crustal, 65.2, 39.7% u nknown, 3 , 1.8% PM10 concentration in July, 2004, 164 μg m-3 EC, 5.4, 3 .2% Trace, 3, 1.8% NH 4 + , 7.9, 4.7% S O 4 2 -, 1 8.5, 1 1.1% NO3 -, 23.4, 14.1% Organic s , 38.6, 23.2% Crustal , 48.2, 29.0% unknown, 21.4, 12.9% PM10 concentration in October, 2004, 166 μg m-3
Fig. 2. Proportional ambient PM10chemical compositions in Beijing in January, April, July and October, 2004.
σ (DLj < Xij < 3DLj) = 0.2xij + 2 3DLj (5) σ (xij > 3DLj) = 0.1xij+ 2 3DLj (6)
In this study, Sc was not included in PMF analysis due to its large number of BDL valus.
2.2.3 Model trial
The first step in PMF analysis is to determine the number of factors and identify the related sources. Then the chemical composition profiles for the sources and their contributions to each sample are acquired from the F and G matrices in PMF output, respectively. In order to choose the factor num-bers, all the possibilities should be compared to find the most reasonable solution. In this process, mathematical diagnos-tics in PMF output are used to examine the technical feasi-bilities. In this study, the diagnostics taken into considered included the value of Q, which should be proximated by the
number of data points; frequency distribution of scaled resid-uals (eij/σij), most of which should be between −2 and +2
to guarantee a nice agreement between the results and the in-put data; rotmat, a matrix generated by the PMF model to estimate the rotational ambiguities of the factors; and the co-efficients in the multiple linear regression (see Eq. 7), which should be all positive (Lee et al., 1999). The solusions with 6, 7, 8, 9 factors in our study were found to be relatively rea-sonable after 2–12 factors were examined carefully. Mean-while, since these mathematical parameters cannot guarantee the interpretability of the solution, further examination based on the preliminary recogonitions for the pollution sources in the target area is necessary to assure the final solution repre-senting the local conditions of the atmospheric pollution. By referring to our previous understanding of pollusion sources in Beijing and other findings on identificaion of PMF factors (e.g. Zabalza et al., 2006; Lee and Hopke, 2006; Lee et al., 1999), we chose a 7-factor solution as the best. The second step is to control rotation and optimize the solution, using the
PM10 0 50 100 150 200 250 300 350 400 1 0 11 12 13 14 15 16 17 18 19 10 11 12 13 14 15 16 17 18 19 10 11 13 14 15 16 17 18 19 21 15 16 17 18 19 20 21 22 23 24
Jan-04 Apr-04 Jul-04 Oct-04
C o n c e n tr a ti o n (µ g m -3) 0 5 10 15 20 25 30 35 40 45 1 0 11 12 13 14 15 16 17 18 19 10 11 12 13 14 15 16 17 18 19 10 11 13 14 15 16 17 18 19 21 15 16 17 18 19 20 21 22 23 24
Jan-04 Apr-04 Jul-04 Oct-04
C o n c e n tr a ti o n ( µ g m -3) Si Ca Al 0 2 4 6 8 10 12 1 0 11 12 13 14 15 16 17 18 19 10 11 12 13 14 15 16 17 18 19 10 11 13 14 15 16 17 18 19 21 15 16 17 18 19 20 21 22 23 24
Jan-04 Apr-04 Jul-04 Oct-04
C o n c e n tr a ti o n (µ g m -3) Fe Mg K 0 5 10 15 20 25 30 35 40 45 1 0 11 12 13 14 15 16 17 18 19 10 11 12 13 14 15 16 17 18 19 10 11 13 14 15 16 17 18 19 21 15 16 17 18 19 20 21 22 23 24
Jan-04 Apr-04 Jul-04 Oct-04
C o n c e n tr a ti o n ( µ g m -3) OC EC 0 10 20 30 40 50 60 70 80 1 0 11 12 13 14 15 16 17 18 19 10 11 12 13 14 15 16 17 18 19 10 11 13 14 15 16 17 18 19 21 15 16 17 18 19 20 21 22 23 24
Jan-04 Apr-04 Jul-04 Oct-04
C o n c e n tra ti o n (µ g m -3) NH4+ NO3-
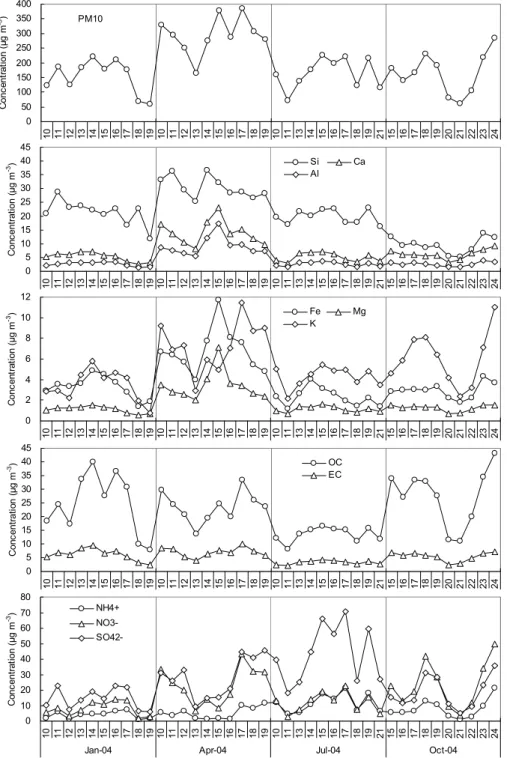
SO42-Fig. 3. Average daily variations for concentrations of PM10, Si, Al, Ca, Fe, Mg, K, OC, EC, SO2−4 , NO
−
3, NH
+
4 in 2004 Fig. 4. PMF
resolved source profiles for ambient PM10in Beijing.
parameters FPEAK and FKEY (or GKEY) provided by the model (Paatero, 2004). Usually PMF is run with different FPEAK values to find the range within which the objective function Q does not show a significant change. The opti-mal solution should lie in this range (Paatero et al., 2002). Sometimes, the unrealistic concentration values in resolved sources can be pulled down toward zero to obtain a reason-able profile through the matrix FKEY.
After numerous runs, FPEAK=0 and a FKEY matrix pro-vided the most physically reasonable solution. In the FKEY matrix, values of all elements were set to 0 except for values of 3 and 5 for OC and EC in secondary nitrate; and values of 5, 3, 5, and 5 for SO2−4 in biomass burning, crustal soil, secondary nitrate, and vehicle emission, respectively.
The results of PMF analysis were scaled to the mea-sured concentration using a scaling constant sk, obtained by
regressing the measured total PM10 mass against the factor
scores, gik, determined by the model (Hopke et al., 1980), as
described by Eq. (7) below, xij =
p
X
k=1
(skgik)(fkj/sk) . (7)
3 Results and discussion
3.1 Concentration and chemical composition of ambient PM10in Beijing in 2004
The overall average PM10 concentration of the 243
sam-ples at the six sites through the sampling duration was 194 µg m−3. Average PM
10 concentrations for January,
April, July and October were 153 µg m−3, 295 µg m−3,
164 µg m−3 and 166 µg m−3, respectively. The highest
PM10concentration 482 µg m−3appeared on 15 April at FS
and the lowest concentration 33.8 µg m−3 was on October
21 at MT. Average PM10 mass concentrations at each site
were 231 µg m−3 at FS, 227 µg m−3at GC, 204 µg m−3at
YZ, 197 µg m−3at CGZ, 195 µg m−3at AT and 146 µg m−3
at MT, respectively, indicating that PM10concentration was
growing higher from northern Beijing to the south.
Based on the method by Christoforou et al. (2000): (1) concentrations of organics in PM10were obtained from OC
concentrations multiplied by 1.4; (2) total concentrations of crustal elements were obtained from sum of Al, Si, Ca, Fe, Ti, Mn, and K oxides concentrations; (3) total concentra-tions of trace elements were calculated from the sum of As, Cd, Cr, Cu, Mg, Na, Ni, Pb, Se, V, and Zn concentrations. And then the monthly averages of PM10chemical
composi-tions in Beijing in January, April, July, and October, 2004 shown in Fig. 2 were obtained. As seen in Fig. 2, the ma-jor chemical components of ambient PM10 in Beijing were
crustal elements, organics, SO2−4 and NO−
3, accounting for
39.9%, 16.1%, 13.5% and 8.6% of total PM10mass,
respec-tively. Figure 2 also indicates significant seasonal variations for PM10chemical compositions.
Crustal elements accounted for more than 40% of PM10
mass concentration in January, April, and July. SO2−4 in July and NO−3 in October accounted for 26.9% and 14.1% of PM10 mass concentrations in the corresponding months,
which were obviously higher than in other months.
Daily concentrations of PM10 and its organic and
inor-ganic species in Beijng in 2004 were obtained by averaging the concentration values at the six sites. Figure 3 presents the seasonally different daily variation patterns for each species, with high PM10 concentration all through the year. Apart
from K, other crustal elements Si, Ca, Al, Fe, and Mg dis-played a common pattern, similar as that of PM10 mass,
which indicated their same source and the domination in PM10concentrations. Especially, daily PM10concentrations
in April were almost all comprised of crustal elements. K
and OC concentrations in October stayed high with simi-lar patterns, indicating their same sources, such as biomass burning. OC corresponded with high concentrations in Jan-uary, April, and October with great daily fluctuations, while EC displayed little monthly variations. The characteristics for SO2−4 , NO−3 and NH+4 variations included high SO2−4 in July and high NO−3 in October. In addition, NO−3 concentra-tions being quite close to NH+4 in July allowed us to estimate NH4NO3to be the major form of nitrate; while NO−3 being
obviously higher than NH+4 in other months, indicating other forms of nitrate to exist in the particles.
In general, these comparisons above showed that in Jan-ualy PM10 were dominated by crustal elements and OC, in
April crustal elements, in July SO2−4 and crustal elements, and in October OC, K, and NO−3.
3.2 Source identification for ambient PM10 in Beijing in
2004
Seven sources of ambient PM10in Beijing were resolved by
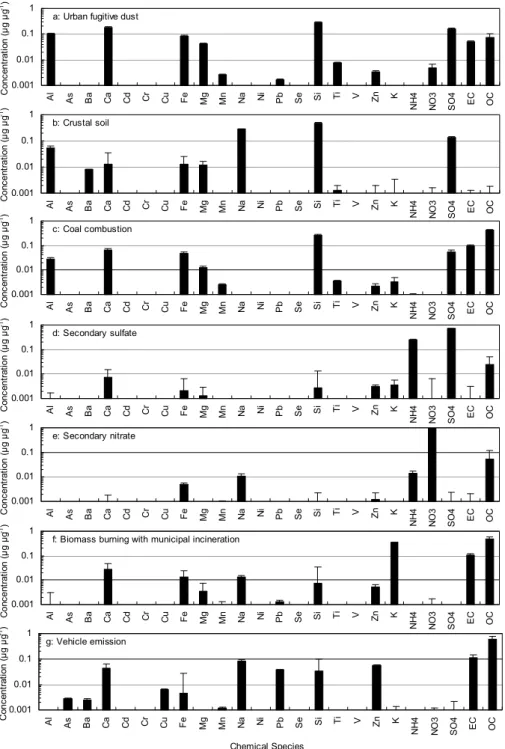
PMF, which were urban fugitive dust, crustal soil, coal com-bustion, secondary sulfate, secondary nitrate, biomass burn-ing with municipal incineration, and vehicle emission, for which source profiles were shown in Fig. 4.
The first source profile illustrated in Fig. 4a was charac-terized by high concentrations of crustal elements, such as Si, Ca, Al, Fe, Mg, Mn and Ti, along with relatively high loadings of OC, EC, SO2−4 and NO−
3, presenting significant
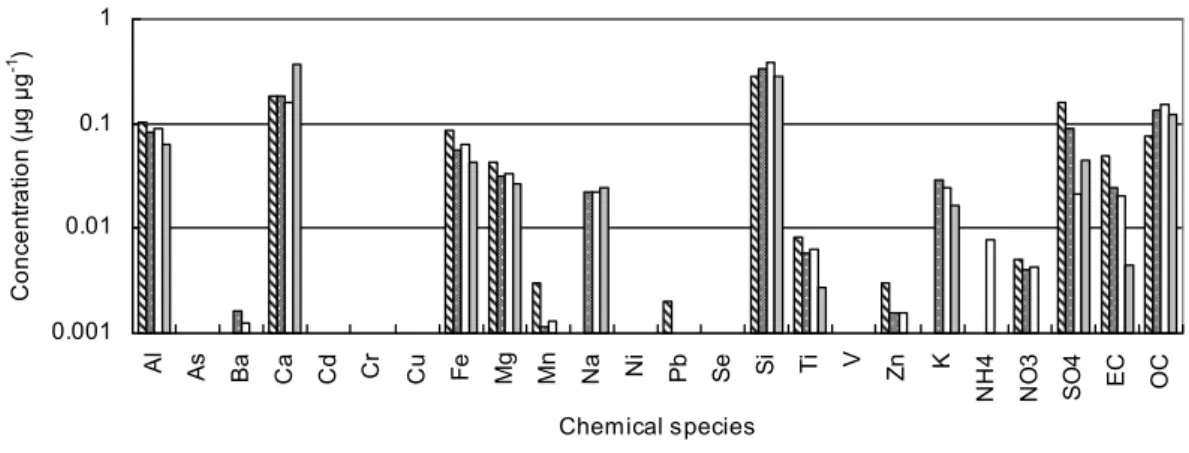
characteristics of urban fugitive dust (Song et al., 2006). This source profile was displayed together with other three types of measured dust profiles in Beijing, namely, urban suspended dust, road dust and construction dust (Hua et al., 2006) in Fig. 5. It can be seen by comparing the chemical profiles in Fig. 5 that concentrations of crustal elements, such as Si, Ca, Al, Fe, Mg, Ti and OC, NO−3 were comparable in these four dust profiles, while PMF resolved dust profile ex-hibited higher loadings of SO2−4 , EC and lower loadings of K and Na than other three types of measured dust profiles. These differences might be caused by factor rotations and similar phenomenon has been reported by Lee and Hopke (2006). The abundance of EC, OC and NO−3 might be due to unavoidable influences from human activities, such as dete-rioration of waste and deposition of fly ashes from coal com-bustion. Therefore, this source represented fugitive emission of dust mainly from local roads traffic, agricultural tilling op-erations, aggregate storage piles, construction operations and was identified as “urban fugitive dust”.
The second source profile illustrated in Fig. 4b was one of the most stable factors during model trial, represented by high concentrations of crustal elements Si, Al, Ca, Fe, Mg with relatively high concentration of SO2−4 , showing simi-lar pattern with urban fugitive dust. But the concentration values in this source differed from those in urban fugitive dust. OC and EC were not found in this source and Ca
29 0.001 0.01 0.1 1 Al As Ba Ca Cd Cr Cu Fe Mg Mn Na Ni Pb Se Si T i V Z n K N H 4 N O 3 SO 4 EC OC C o n c e n tr a ti o n ( µ g µ g -1)
a: Urban fugitive dust
0.001 0.01 0.1 1 Al As Ba Ca Cd Cr Cu Fe Mg Mn Na Ni Pb Se Si Ti V Zn K N H 4 N O 3 SO 4 EC OC C o n c e n tr a ti o n ( µ g µ g -1) b: Crustal soil 0.001 0.01 0.1 1 Al As Ba Ca Cd Cr Cu Fe Mg Mn Na Ni Pb Se Si T i V Z n K N H 4 N O 3 SO 4 EC OC C o n c e n tr a ti o n ( µ g µ g -1) c: Coal combustion 0.001 0.01 0.1 1 Al As Ba Ca Cd Cr Cu Fe Mg Mn Na Ni Pb Se Si T i V Z n K N H 4 N O 3 SO 4 EC OC C o n c e n tr a ti o n ( µ g µ g -1) d: Secondary sulfate 0.001 0.01 0.1 1 Al As Ba Ca Cd Cr Cu Fe Mg Mn Na Ni Pb Se Si Ti V Zn K N H 4 N O 3 SO 4 EC OC C o n c e n tr a ti o n ( µ g µ g -1) e: Secondary nitrate 0.001 0.01 0.1 1 Al As Ba Ca Cd Cr Cu Fe Mg Mn Na Ni Pb Se Si Ti V Zn K N H 4 N O 3 SO 4 EC OC C o n c e n tr a ti o n ( µ g µ g -1)
f: Biomass burning with municipal incineration
0.001 0.01 0.1 1 Al As Ba Ca Cd Cr Cu Fe Mg Mn Na Ni Pb Se Si Ti V Zn K N H 4 N O 3 SO 4 EC OC Chemical Species C o n c e n tr a ti o n ( µ g µ g -1) g: Vehicle emission
Fig. 4. PMF resolved source profiles for ambient PM10in Beijing.
concentration was lower than in urban fugitive dust, indicat-ing fewer influences by human activities. High SO2−4 con-centration in this source might be metal sulfates (e.g. CaSO4
and MgSO4) formed through atmospheric reactions between
airborne H2SO4/SO2and crustal elements (Lee et al., 1999).
By all appearances, this source was identified as crustal soil. PMF successfully indentified these two types of dust source with similar chemical characteristics in Beijing.
The third source profile was presented in Fig. 4c. The major chemical species of this source were Si, Ca, Fe, Al, Mg, Ti, Mn and Zn with high concentrations of OC, EC and SO2−4 , revealing the main chemical composition with crustal elements and C. This is the typical pattern for emission from coal combustion (Song et al., 2006 and 2007).
The fourth source profile shown in Fig. 4d was character-ized by high concentrations of SO2−4 and NH+4, along with
0.001 0.01 0.1 1 Al As Ba Ca Cd Cr Cu Fe Mg Mn Na Ni Pb Se Si Ti V Zn K N H 4 N O 3 SO 4 EC OC Chemical species C o n c e n tr a ti o n ( µ g µ g -1)
PMF urban f ugitive dust Urban suspended dust Road dust Construction dust
Fig. 5. PMF resolved urban fugitive dust versus three types of measured dust profiles in Beijing.
certain amount of OC, which are characteristics of secondary sulfate. Such pattern has been reported in several PMF stud-ies (Polissar et al., 2001; Kim and Hopke, 2006; Song et al., 2006; Yuan et al., 2006). Secondary sulfate is formed by photochemical reactions, especially in the summer when so-lar radiation and the ambient temperature are high (Seinfield and Pandis, 1998). The calculated NH+4 to SO2−4 molar ra-tio of 2.1 in the profile indicated that (NH4)2SO4, instead of
NH4HSO4, was the major species formed by SO2−4 and NH+4
(Lee et al., 1999; Wang et al., 2005). The presence of OC might be ascribed to that sulfuric acid can catalyze particle-phase heterogeneous reactions of atmospheric organic car-bony species when secondary sulfate is formed, resulting in formation of secondary organic aerosols (Jang et al., 2002).
The fifth source profile shown in Fig. 4e contained high concentrations of NO−3 and NH+4 along with certain amount of OC, which were typical characteristics for secondary ni-trate. Similar pattern has been reported by Li et al. (2004). NOx from traffic emission and stationary sources, such as
power plants, is oxygenated to HNO3, and equilibrium
be-tween HNO3and NH3in ambient air leads to the formation
of NH4NO3. The existence of OC was similar as secondary
sulfate and suggested condensation of organic matter on the NH4NO3particles which was consistent with previous
stud-ies on individual particles (Liu et al., 2003).
The sixth source profile in Fig. 4f was characterized by high concentrations of OC and K, along with EC, Si, Ca, Fe, Mg, Zn and Pb. OC and K as tracers are commonly used to identify biomass burning (Duan et al., 2004; Song et al., 2006; Lee et al., 2006). OC, EC, Zn, Pb, and K were also identified as signatures for municipal incinerators (Yoo et al., 2002). Therefore this source type was identified as biomass burning with municipal incineration.
The seventh source profile in Fig. 4g was represented by high concentrations of EC and OC, with relatively high con-centrations of Zn, Cu, Pb, Ca, Si and Fe. Cadle et al.(1999) found the EC/OC ratio to be 3:7 in gasoline exhust and 6:4
in desel exhaust. Considering gasoline and diesel accounted for respectively 14.3% and 8.5% of Beijing’s total fuel con-sumption in 2004, and the population of diesel vehicles only accounted for 5% of Beijing’s total vehicle population, OC might be much higher than EC for vehicle emission in Bei-jing. Si, Fe, Zn and Pb have been detected in vehicle emis-sion sources (Cadle et al., 1998). Fe can also be from muf-fler ablation. Ca is used as lubricating oil additives (Hwang and Hopke, 2006); Cu is emitted from metal brake wear or could be generated from high-volume air sampling pumps (Lee et al., 1999); Si has been linked to heavy-duty diesel emissions (Lee and Hopke, 2006) or is from road dust. Zn has been found to be emitted by motor vehicles (Huang et al., 1994) and has been commonly associated with motor vehicle sources in recent PMF studies. This profile was also quite similar as the vehicle emission source profile for PM2.5 in
Beijing in 2000 by Song et al. (2006). Therefore, this source should be identified as vehicle emission.
3.3 Temporal trends of ambient PM10source contributions
in Beijing in 2004
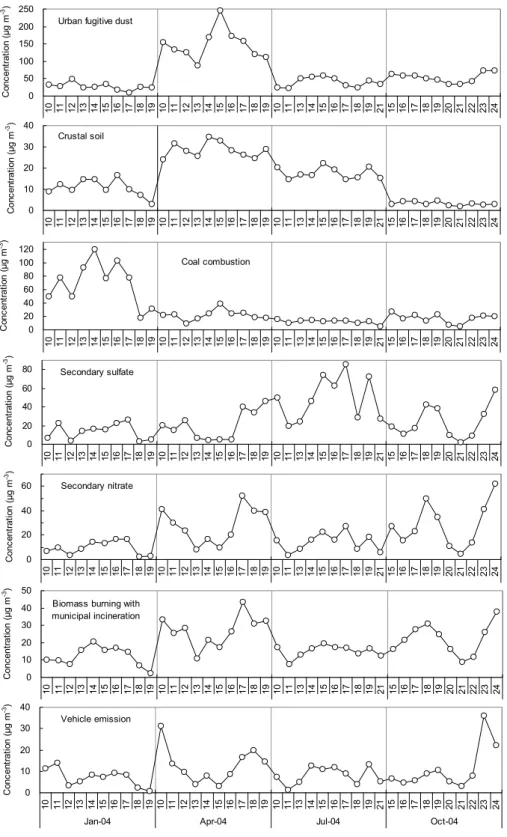
The daily average mass contributions of each source to am-bient PM10 in Beijing were calculated by averaging
appor-tionment results at six sites on a daily basis and presented in Fig. 6.
It can be seen in Fig. 6 that the daily average contributions of urban fugitive dust were in the range of 11 to 245 µg m−3
and relatively high on all the sampling days. Especially in April, with the daily contributions from 75 µg m−3 to
245 µg m−3 which were significantly higher than in other
months, urban fugitive dust contributed 50.2% of total PM10
mass on a monthly basis. According to statistical meteoro-logical data in many years, cyclone and front activities hap-pened frequently in March and April in Beijing and caused the highest frequency of dust weather days in these two months. About 50% of dust weather days on an annual basis
Urban fugitive dust 0 50 100 150 200 250 1 0 1 1 1 2 1 3 1 4 1 5 1 6 1 7 1 8 1 9 1 0 1 1 1 2 1 3 1 4 1 5 1 6 1 7 1 8 1 9 1 0 1 1 1 3 1 4 1 5 1 6 1 7 1 8 1 9 2 1 1 5 1 6 1 7 1 8 1 9 2 0 2 1 2 2 2 3 2 4
Jan-04 Apr-04 Jul-04 Oct-04
C o n c e n tr a ti o n ( µ g m -3) Crustal soil 0 10 20 30 40 1 0 11 12 13 14 15 16 17 18 19 10 11 12 13 14 15 16 17 18 19 10 11 13 14 15 16 17 18 19 21 15 16 17 18 19 20 21 22 23 24
Jan-04 Apr-04 Jul-04 Oct-04
C o n c e n tr a ti o n ( µ g m -3) Coal combustion 0 20 40 60 80 100 120 1 0 11 12 13 14 15 16 17 18 19 10 11 12 13 14 15 16 17 18 19 10 11 13 14 15 16 17 18 19 21 15 16 17 18 19 20 21 22 23 24
Jan-04 Apr-04 Jul-04 Oct-04
C o n c e n tr a ti o n ( µ g m -3) Secondary sulfate 0 20 40 60 80 1 0 11 12 13 14 15 16 17 18 19 10 11 12 13 14 15 16 17 18 19 10 11 13 14 15 16 17 18 19 21 15 16 17 18 19 20 21 22 23 24
Jan-04 Apr-04 Jul-04 Oct-04
C o n c e n tr a ti o n ( µ g m -3) Secondary nitrate 0 20 40 60 1 0 11 12 13 14 15 16 17 18 19 10 11 12 13 14 15 16 17 18 19 10 11 13 14 15 16 17 18 19 21 15 16 17 18 19 20 21 22 23 24
Jan-04 Apr-04 Jul-04 Oct-04
C o n c e n tr a ti o n ( µ g m -3)
Biomass burning with municipal incineration 0 10 20 30 40 50 1 0 11 12 13 14 15 16 17 18 19 10 11 12 13 14 15 16 17 18 19 10 11 13 14 15 16 17 18 19 21 15 16 17 18 19 20 21 22 23 24
Jan-04 Apr-04 Jul-04 Oct-04
C o n c e n tr a ti o n ( µ g m -3) Vehicle emission 0 10 20 30 40 1 0 11 12 13 14 15 16 17 18 19 10 11 12 13 14 15 16 17 18 19 10 11 13 14 15 16 17 18 19 21 15 16 17 18 19 20 21 22 23 24
Jan-04 Apr-04 Jul-04 Oct-04
C o n c e n tr a ti o n ( µ g m -3)
Fig. 6. Daily variations of PM10source contributions in Beijing.
appeared in April, caused by external and internal dust (Xie et al., 2005). On 15 April 2004, strong windy weather dom-inated in Beijing and the maximum gust speed in the after-noon was as high as 40 mph (www.wunderground.com). As
expected, contribution from urban fugitive dust on this day reached the extremely high concentration of 245.4 µg m−3,
reflecting serious local scale resuspended dust pollution. Therefore, the great contribution from urban fugitive dust
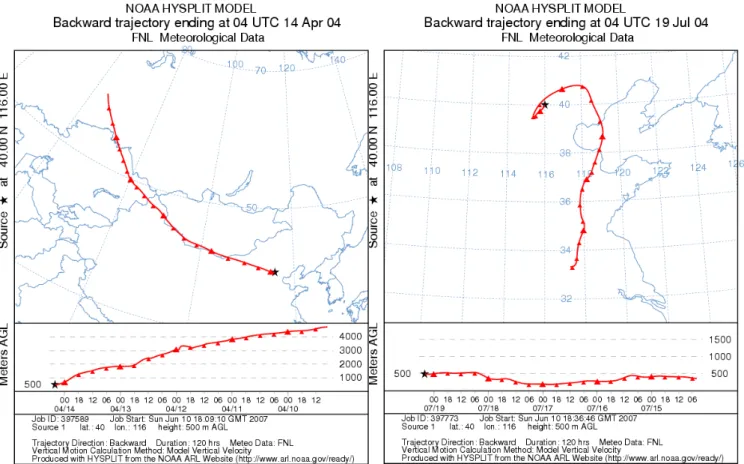
Fig. 7. Backward trajectories arriving at Beijing on April 14 and July 19 in 2004.
in April was due to high wind velocity and indicated high dust loading on the ground surface in Beijing. Oppositely in January, the urban fugitive dust contribution was relatively low as 27.6 µg m−3, accounting for 18.0% of PM
10 mass
concentration due to the cold weather, freezing ground sur-face, and relatively low dust loading.
By comparing the daily average contributions of urban fugitive dust with those of crustal soil shown in Fig. 6, it was found that the daily average contributions of crustal soil, ranging from 2 to 35 µg m−3, showed a different variation
pattern from urban fugitive dust. Monthly average contri-butions were 10.7 µg m−3, 28.6 µg m−3, 17.7 µg m−3 and
3.3 µg m−3 for January, April, July, and October,
respec-tively, much lower than those of urban fugitive dust. Crustal soil mainly concentrated in April, followed by July and Jan-uary. In October, its contribution was almost none.
In order to identify the possilbe transport path for non-local crustal soil to Beijing, backward trajectory ending at Beijing on each sampling day was calculated with NOAA-HYSPLIT model (Draxler and Rolph, 2003). Backward tra-jectories on 14 April 2004 and 19 July 2004, two typical sam-pling days with high peak contributions from crustal soil, illustrated in Fig. 7 indicated that non-local dust was from northwest of Beijing on 14 April 2004 and from south of
Bei-jing on 19 July 2004. In addition, downloaded TOMS-NASA global aerosol index maps (TOMS, http://jwocky.gsfc.nasa. gov; Herman et al., 1997) in 2004 exhibited high aerosol concentrations on the northwest of Beijing in April and on the south of Beijing in July, respectively. Oppositely, in Oc-tober and January, aerosol concentrations in the whole area of China were relatively low. Therefore, it can be concluded that this crustal soil source with high Si and Na concentra-tions might be mainly from the northwest in April and from the south in July in 2004.
These two dust sources had similar chemical characteris-tics and were differentiated by PMF, contributing 42.2% of measured total PM10 mass concentration, which are
consis-tent with the CMB results by Okuda et al. (2004) in which soil dust accounted for 47% and 42% of PM10
concentra-tions in 2001 and 2002, respectively. By comparing Fig. 3 and Fig. 6, it can be found that PMF identified the different sources for the two high PM10 concentration days 14 April
2004 and 15 April 2004. Non-local crustal soil and urban fugitive dust might be the major sources for these two days, respectively, which can be further proved by Fig. 7 and the serious fugitive dust rendered by the great wind whether on 15 April 2004. These also justified our source profiles for these two source.
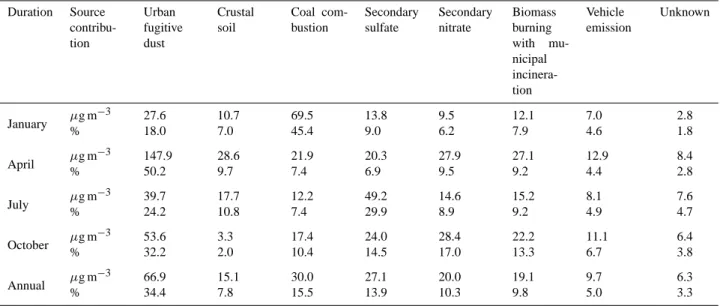
Table 1. Monthly and annual average PM10source contributions in Beijing, 2004. Duration Source contribu-tion Urban fugitive dust Crustal soil Coal com-bustion Secondary sulfate Secondary nitrate Biomass burning with mu-nicipal incinera-tion Vehicle emission Unknown January µg m −3 27.6 10.7 69.5 13.8 9.5 12.1 7.0 2.8 % 18.0 7.0 45.4 9.0 6.2 7.9 4.6 1.8 April µg m −3 147.9 28.6 21.9 20.3 27.9 27.1 12.9 8.4 % 50.2 9.7 7.4 6.9 9.5 9.2 4.4 2.8 July µg m −3 39.7 17.7 12.2 49.2 14.6 15.2 8.1 7.6 % 24.2 10.8 7.4 29.9 8.9 9.2 4.9 4.7 October µg m −3 53.6 3.3 17.4 24.0 28.4 22.2 11.1 6.4 % 32.2 2.0 10.4 14.5 17.0 13.3 6.7 3.8 Annual µg m −3 66.9 15.1 30.0 27.1 20.0 19.1 9.7 6.3 % 34.4 7.8 15.5 13.9 10.3 9.8 5.0 3.3
Daily average contributions of coal combustion to PM10
in 2004 in Beijing showed in Fig. 6 ranged from 5 to 120 µg m−3 and displayed a pattern characterized by
ex-tremly higher level in January than those in other months. Monthly average contribution in January was 69.5 µg m−3,
covering 45.4% of PM10 mass concentration, followed by
22 µg m−3in April and 17 µg m−3in October. Due to much
less coal consumed in summer, the contribution was only 12 µg m−3 in July on a monthly basis. The Daily
fluctua-tions of contribufluctua-tions were great in January but not obvious in other months, which therefore also became an obvious sea-sonal variation pattern for coal combustion.
Daily contributions from secondary sulfate ranged from 2.6 to 86 µg m−3with high peaks mainly in July. Monthly
average contribution was as high as 49.2 µg m−3in July and
much higher than in other months, followed by 24.1 µg m−3
in October, 20.3 µg m−3 in April and 13.8 µg m−3 in
Jan-uary. The reason for this pattern is that strong solar ra-diation, high ambient temperature and relative humidity in July favored the formation of secondary sulfate from SO2
by photochemical reactions (Seinfield and Pandis, 1998). It can be seen in Fig. 6 that daily contributions of secondary sulfate displayed a significant fluctuation, which might be related with the daily variations of meteorological condi-tions. Specifically, the meteorological data in July 2004 (www.wunderground.com) revealed that the average wind velocities on 13, 14 and 18 July 2004 were in the range of 1.5–2 m s−1, with maximum gust speed of 10–12 m s−1,
av-erage temperature of 25–28◦C, and moderate rain and
thun-der shower on 14 and 18 July 2004. These weather con-stituents went against the formation of secondary sulfate, re-sulting in the low daily contributions of secondary sulfate. In contrast, fog events, low wind velocity and high ambient
temperature occurred on other sampling days in July; such weather constituents were favorable for secondary sulfate formation. Hence, daily contributions of secondary sulfate to PM10reached as high as 85.7 µg m−3on 17 July. The source
contribution of secondary sulfate replaced that of urban fugi-tive dust to become the most in July, with the monthly av-erage contribution of 49.2 µg m−3, accounting for 29.9% of
the PM10 mass. And the annual average contribution was
27.1 µg m−3, accounting for 13.9% of the total PM 10mass.
Daily average contributions from secondary nitrate varied from 2.2 to 62 µg m−3and showed different variation pattern
from secondary sulfate, as shown in Fig. 6. Considerable differences for variation ranges were found to exist among sampling days and months, which might depend on different meteorological conditions. The monthly average contribu-tions were 28.4 and 27.9 µg m−3in April and October, while
merely 10.3 and 14.6 µg m−3 in January and July,
respec-tively. In ambient air, NH4NO3, known as a semi-volatile
compound, is the major existence form for NO−3 and NH+4. Since low temperature in January does not favor secondary nitrate formation, while high temperature in July leads to decomposition and volatilization of NH4NO3, nitrate
con-centration were not high in these two months. In contrast, in April and October, high nitrate concentrations were ob-served due to moderate temperature in these two months. Besides, as seen in Fig. 6, the daily average contributions for secondary nitrate showed similar variation pattern with biomass burning and vehicle emission, which is understand-able considering biomass burning and vehicle emission may be sources of NOx, which is an important precursor for
sec-ondary nitrate. Therefore, controlling biomass burning and vehicle emission is vital for reducing secondary nitrate con-tribution in Beijing.
It was seen from the daily contributions of biomass burn-ing with municipal incineration to ambient PM10 in 2004
in Fig. 6 that this source contributed in the range from 2.6 to 43 µg m−3on a daily basis, and 12.1 µg m−3in January,
27.1 µg m−3in April, 15.2 µg m−3in July and 22.2 µg m−3
in October, respectively on a monthly basis. Obviously, the daily average contributions in April and October were higher than in other months. The daily contribution variations of this source were smooth in July but considerable in other months, especially in April and July. Furthermore, daily variations for source contributions of biomass burning in April were close to those of urban fugitive dust source. Specifically, it is the right time for spring ploughing in April; wheat straw burn-ing intensifies from May to July; maize straw burnburn-ing takes place during August through October and fallen leaves are burned during November through next January. PM10
emit-ted by biomass burning source actually exist in all the months around Beijing. Meanwhile, 3–4% wastes in Beijing were in-cinerated. Therefore their contributions to PM10 should not
be neglected, which was different from the results of pre-vious PM10source apportionment studies in China (Bi et al.,
2005; Okuda et al., 2004). Furthermore, it must be noted that in March and April, apart from local crop burning, non-local biomass burning rendered PM10might be transported to
Bei-jing along with crustal soil, and lead to increase in the daily average contribution of biomass burning and appearing to be similar to the daily variation pattern of daily average contri-bution of crustal soil and urban fugitive dust in April. Xie et al. (2005) have found that a large quantity of fine particles were transported into Beijing with sand dust during sand-dust storm periods.
The daily average contributions from vehicle emission to PM10in 2004 presented in Fig. 6 showed no obvious
fluctu-ation except on April 10 and October 23. It was seen from Fig. 6 that vehicle emission contributed in the range from 0.6 to 36 µg m−3 on a daily basis, and 7.0 µg m−3 in January,
12.9 µg m−3 in April, 8.1 µg m−3 in July and 11.1 µg m−3
in October on a monthly basis. It was a stable source with and the annual average contribution of 9.7 µg m−3.
3.4 Seasonal and spatial variations of ambient PM10source
contributions in Beijing in 2004
Average source contributions on annual and monthly basis were calculated by averaging apportionment results at six sites and shown in Table 1. On average, the contributions from seven sources resolved by PMF accounted for about 96.7% of observed PM10mass concentration. Among them,
urban fugitive dust which came from local road traffic, agri-cultural tilling operations, aggregate storage piles, and heavy construction operations contributed the most in Beijing, with the annual average contribution of 66.9 µg m−3,
account-ing for 34.4% of the total PM10 mass. The second largest
contributor was coal combustion source with contribution of 30.0 µg m−3, accounting for 15.5% of the total PM
10 mass
on an annual basis. Contributions of secondary sulfate and secondary nitrate were 27.1 µg m−3 and 20.0 µg m−3,
ac-counting for 13.9% and 10.3% of the total PM10 mass,
re-spectively, which indicated considerably high contributions of secondary sources to ambient PM10in Beijing.
Contribu-tion from biomass burning with municipal incineraContribu-tion was 19.1 µg m−3, accounting for 9.8% of the total PM
10 mass.
Crustal soil contributed 15.1 µg m−3, accounting for 7.8%
of the total PM10 mass. Contribution from vehicle emission
was relatively low at 9.7 µg m−3. However, vehicles not only
directly emit particulate matter, but also emit large amount of gaseous pollutants, such as NOxand VOC (Cai and Xie,
2007), which will transform to secondary aerosols, including secondary nitrate and organics (Lee and Hopke, 2006; Per-rino et al., 2002). In addition, vehicle traveling also causes road dust which is also an important source for PM10. Based
on this consideration, contribution from vehicles actually ac-counted for a much larger part than 5.0%. Besides, some existing industrial sources, such as Capital Iron and Steel Company, may be important contributors for iron elements such as Pb, Zn, and Cu, and large source of SO2, which is
precursor for secondary sulfate. All these potential sources cannot be neglected either and need more investigation.
It was also found from Table 1 that the contribution of each source to PM10in Beijing showed significant seasonal
varia-tions. In January, due to increasing demand for heat supply in winter, coal combustion dominated with the contribution of 69.5 µg m−3, accounting for 45.4% of total PM
10 mass.
In April, urban and crustal soil became the primary PM10
sources. Contribution from urban fugitive dust in this month was as high as 147.9 µg m−3, accounting for 50.2% of
to-tal PM10 mass. In July, secondary sources, including
sec-ondary sulfate and secsec-ondary nitrate, with the contribution of 63.8 µg m−3, 38.8% were major PM
10 sources. In October,
urban fugitive dust, secondary sulfate and secondary nitrate were the major PM10 sources. Contribution from biomass
burning in October was also high due to the increase of leaves burned in fall. Overall, urban fugitive dust source contributed large portion of PM10mass concentration in every month and
should be the priority to be controlled in Beijing. Monthly average source contributions for each site were illustrated in Fig. 8. It can be seen from Fig. 8 that PM10 source
contri-butions in Beijing displayed not only seasonal variations but also spatial differences. The contributions from urban fugi-tive dust were higher at suburban sites FS, GC, and YZ than at urban sites AT and CGZ. It was indicated that contributions from urban fugitive dust were higher than those from other sources in southeastern and southwestern Beijing, and that dust loading in urban areas was lower than in suburban areas. GC is near Capital Iron and Steel Company, where aggregate storage piles of all kinds of materials might generate sus-pended dust. Construction materials plants and various roads emitted dust around FS. Coal combustion contributions at AT, CGZ and GC were higher than at other sites. Secondary sulfate and secondary nitrate contributions at AT, CGZ, FS
0 50 100 150 200 250 300 350 400 AT C G Z MT FS GC YZ Av e ra g e AT C G Z MT FS GC YZ Av e ra g e AT C G Z MT FS GC YZ Av e ra g e AT C G Z MT FS GC YZ Av e ra g e
Jan-04 Apr-04 Jul-04 Oct-04
C o n c e n tra ti o n (µ g m -3)
Urban fugitive dust Crustal soil Coal combustion
Secondary sulfate Secondary nitrate Biomass burning with municipal incineration
Vehicle emission Unknown
Figure 8. Monthly average PM10 source contributions in January, April, July, and October
Fig. 8. Monthly average PM10source contributions in January, April, July, and October for each sampling site in Beijing in 2004.
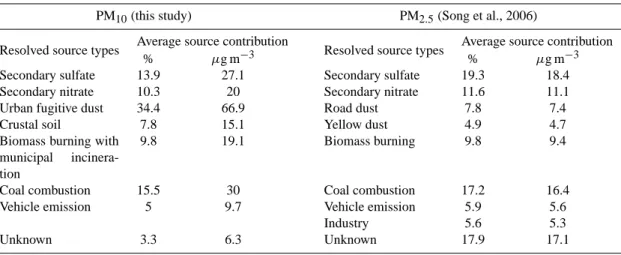
Table 2. Comparison between source contributions for PM10in 2004 and PM2.5in 2000 in Beijing.
PM10(this study) PM2.5(Song et al., 2006)
Resolved source types Average source contribution Resolved source types Average source contribution
% µg m−3 % µg m−3
Secondary sulfate 13.9 27.1 Secondary sulfate 19.3 18.4
Secondary nitrate 10.3 20 Secondary nitrate 11.6 11.1
Urban fugitive dust 34.4 66.9 Road dust 7.8 7.4
Crustal soil 7.8 15.1 Yellow dust 4.9 4.7
Biomass burning with
municipal
incinera-tion
9.8 19.1 Biomass burning 9.8 9.4
Coal combustion 15.5 30 Coal combustion 17.2 16.4
Vehicle emission 5 9.7 Vehicle emission 5.9 5.6
Industry 5.6 5.3
Unknown 3.3 6.3 Unknown 17.9 17.1
and GC were higher than at other two sites. Biomass burn-ing contribution at FS was much higher than at other sites. This was probably due to biomass burning activities in kilns around FS or transported PM10from the southwest,
consid-ering FS was located on the southwestern transport path in Beijing.
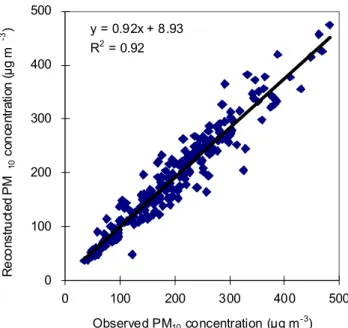
Sums of PMF resolved source contributions on all the sam-pling days and sites were calculated to represent the recon-structed PM10mass concentrations. And then reconstructed
versus observed PM10mass concentrations were plotted. As
seen in Fig. 9, reconstructed PM10 concentrations showed
good agreements with observed values, with a R2=0.92, a lope 0.92 and an intercept 8.93 µg m−3. These indicated a
successful source apportionment and credible results.
In Table 2, PM10 souce contritutions in 2004 and PM2.5
source contributions in 2000 (Song et al., 2006) in Beijing were compared. 8 and 7 sources were identified for PM2.5
in 2000 and for PM10 in 2004, respectively. Different from
PM2.5in 2000, industial source was not identified for PM10
but municipal incineration was found, which agreed well with the facts in Beijing: industries were ordered to move outside Beijing from 1999 and waste incineration plants be-gan to be under construction from 2003. Meanwhile, the par-ticle size characteristics for different emission sources can be found in Table 2, although based on data in different years. Secondary sulfate, secondary nitrate, biomass burning with municipal incineration and vehicle emission mainly emit-ted PM2.5, urban fugitive dust and crustal soil were mainly
y = 0.92x + 8.93 R2 = 0.92 0 100 200 300 400 500 0 100 200 300 400 500 Observed PM10 concentration (μg m-3) R e co n s tr u ct e d P M 1 0 c o n ce n tr a ti o n (μ g m -3 )
Fig. 9. Observed versus reconstructed PM10mass concentrations.
comprised of larger particles, and coal combustion emitted particles with both sizes.
4 Conclusions
The average PM10 concentration in Beijing during the
sam-pling period in 2004 was 194 µg m−3, which exceeded
Na-tional Ambient Air Quality Standard (GB3095-1996) level II for PM10 (100 µg m−3) and also exceeded level III
(150 µg m−3). PM
10 in Beijing was mainly composed of
crustal elements, organic matter, SO2−4 and NO−3, which ac-counted for 8.6%, 39.9%, 16.1% and 13.5% of total PM10
mass on an annual basis. Crustal elements accounted for more than 40% of PM10 mass concentration in January,
April, and July. SO2−4 accounted for 26.9% in July and NO−3 accounted for 14.1% of PM10mass concentration in October,
both of which were significantly higher than in other months. Seven sources of ambient PM10 in Beijing in 2004 were
resolved by PMF, which were urban fugitive dust, crustal soil, coal combustion, secondary sulfate, secondary nitrate, biomass burning with municipal incineration and vehicle emission. In paticular, urban fugitive dust and crustal soil as two types of dust sources with similar chemical char-acteristics were differentiated by PMF. Urban fugitive dust was the largest contributor with the annual average con-tribution of 66.9 µg m−3, accounting for 34.4% of PM
10
mass concentration. Coal combustion was still an important source of PM10in Beijing. Especially in winter, its
contribu-tion reached 69.5 µg m−3, accounting for 45.4% of the total
PM10 mass. Secondary sources including secondary sulfate
and secondary nitrate contributed 47.1 µg m−3, accounting
for 24.3% of the total PM10 mass, indicating quite serious
secondary pollution in Beijing. Contributions of biomass burning and vehicle emission were 19.1 µg m−3, 9.8% and
9.7 µg m−3, 5.0%, respectively. In spite of the relative low
contribution from direct vehicle emission, considering sec-ondary aerosols formed by oxidation of vehicles emitted gaseous precursors and resuspended dust caused by vehicle traveling, PM10 generated by vehicles, both directly and
in-directly, were quite significant and should not be neglected. The source apportionment results of ambient PM10 in
2004 in Beijing indicated that significant seasonal and spa-tial variations of PM10sources in Beijing were found. Coal
combustion was the primary source of ambient PM10in
win-ter which accounted for 45.4% of PM10mass concentration.
Higher contributions were found in urban areas than in sub-urban areas. Urban fugitive dust contributed 50.2% of PM10
mass concentration in spring, and was significant in other months, too. Higher contributions from urban fugitive dust were found in southwestern and southeastern suburban areas than in central urban areas, indicating higher dust loadings in these areas. Secondary sulfate and secondary nitrate com-bined to be the largest source in summer and fall, with per-centages of 38.8% and 31.5%, respectively. Contributions from secondary sources were higher in urban areas than in suburban areas. Biomass burning with municipal incinera-tion contributed more in fall than in other months, and more in southwestern Beijing than in other areas, which indicated biomass burning with municipal incineration sources might locate in southwestern area of Beijing. In conclusion, it was found that ambient PM10sources in Beijing showed
signifi-cant seasonal variations as well as spatial differences.
Acknowledgements. This study was funded by National Basic
Research Program of China (Grant2002CB211600) and was a part of the Air Pollution Control Strategy research project funded
by Beijing Municipal Science & Technology Commission. We
also thank P. Paatero for providing valuable suggestions on PMF analysis.
Edited by: V.-M. Kerminen
References
Beijing Environmental Protection Bureau: Report on the State of the Environment in Beijing in 2002, www.bjepb.gov.cn/bjhb/ tabid/68/InfoID/2618/Default.aspx, 2004.
Beijing Environmental Protection Bureau: Report on the State of the Environment in Beijing in 2004, www.bjepb.gov.cn/bjhb/ tabid/68/InfoID/2620/Default.aspx, 2005.
Beijing Environmental Protection Bureau: Report on the State of the Environment in Beijing in 2005, www.bjepb.gov.cn/bjhb/ tabid/68/InfoID/7622/Default.aspx, 2006.
Bi, X., Feng, Y., Wu, J., Wang, Y., and Zhu, T.: Source
apportion-ment of PM10in six cities of northern China, Atmos. Environ.,
41, 903–912, 2007.
Cadle, S. H., Mulawa, P., Hunsanger, E. C., Nelson, K., Ragazzi, R. A., Barrett, R., Gallagher, G. L., Lawson, D. R., Knapp, K.
T., and Snow, R.: Measurements of exhaust particulate matter emissions from in-use light-duty motor vehicles in the Denver, Colorado area, report prepared for coordinating research council, Atlanta GA, 1998.
Cadle S. H., Mulawa P. A., Hunsanger E. C., Nelson K, Ragazzi R. A., Barrett R., Gallagher G. L., Lawson D. R., Knapp K. T., and Snow R.: Composition of light-duty motor vehicle exhaust par-ticulate matter in the Denver, Colorado area, Environ. Sci. Tech-nol., 33, 2328–2339, 1999.
Cai, H. and Xie, S. D.: Estimation of vehicular emission in-ventories in China from 1980 to 2005, Atmos. Environ., doi:10.1016/j.atmosenv.2007.08.019, 2007.
Chen, T., Hua, L., Jin, L., Xu, Z., Wang, H., Bai, J., Liu, W., Hu,
Y., and Lin, A.: Research on PM10source apportionment in
Bei-jing, Environmental Monitoring in China, 22, 6 (in Chinese with abstract in English), 2006.
Christoforou, C. S., Salmon, L. G., Hannigan, M. P., Solomon, P. A., Cass, and G. R.: Trends in fine particle concentration and chemical composition in southern California, J. Air Waste Manag. Assoc., 50, 43–53, 2000.
Draxler, R. R. and Rolph, G. D.: HYSPLIT (HYbrid Single-Particle Lagrangian Integrated Trajectory) model access via NOAA ARL READY Website, www.arl.noaa.gov/ready/hysplit4.html, 2003. Duan, F., Liu, X., Yu, T., and Cachier, H.: Identification and
esti-mate of biomass burning contribution to the urban aerosolorganic carbon concentrations in Beijing, Atmos. Environ., 38, 1275– 1282, 2004.
Han, J. S., Moon, K. J., Lee, S. J., Kim, Y. J., Ryu, S. Y., Cliff, S. S., and Yi, S. M.: Size-resolved source apportionment of ambient particles by positive matrix factorization, Atmos. Chem. Phys., 6, 211–223, 2006,
http://www.atmos-chem-phys.net/6/211/2006/.
Hedberg, E., Gidhagen, L., and Johnansson, C.: Source
contribu-tions to PM10 and arsenic concentrations in Central Chile
us-ing positive matrix factorization. Atmos. Environ., 39, 549–561, 2005.
Hopke, P. K., Lamb, R. E., and Natusch, D. F. C.: Multi-elemental characterization of urban roadway dust, Environ. Sci. Technol., 14, 164–172, 1980.
Hua, L., Guo, J., Xu, Z., Hu, Y., Huang, Y., and Zou, B.: Analysis
of PM10source profiles in Beijing. Environmental Monitoring in
China 22, 6, 64–71 (in Chinese with abstract in English), 2006. Huang, X. D., Olmez, I., Aras, N. K., and Gordon, G. E.:
Emis-sions of trace-elements from motor-vehicles-potential marker el-ements and source composition profile, Atmos. Environ., 28, 1385–1391, 1994.
Hwang, I. and Hopke, P. K.: Comparison of source apportionments of fine particulate matter at two San Jose Speciation Trends Net-work Sites, J. Air Waste Manag. Assoc., 56, 1287–1300, 2006. Jang, M., Czoschke, N. M., Lee, S., and Kamens, R. M.:
Heteroge-neous atmospheric aerosol production by acidcatalyzed particle-phase reactions, Science, 298, 814–817, 2002.
Johnson, K. S., de Foy, B., Zuberi, B., Molina, L. T., Molina, M. J., Xie, Y., Laskin, A., and Shutthanandan, V.: Aerosol com-position and source apportionment in the Mexico Metropolictan Area with PIXE/PESA/STIM and multivariate analysis, Atmos. Chem. Phys., 6, 4591–4600, 2006,
http://www.atmos-chem-phys.net/6/4591/2006/.
Kim, E. and Hopke, P. K.: Characterization of fine particle sources
in the Great Smoky Mountains area, Sci. Total Environ., 368, 781–794, 2006.
Lanz, V. A., Alfarra, M. R., Baltensperger, U., Buchmann, B., Hueglin, C., and Pr´evot A. S. H.: Source apportionment of sub-micron organic aerosols at an urban site by factor analytical mod-eling of aerosol mass spectra, Atmos. Chem. Phys., 7, 1503– 1522, 2007,
http://www.atmos-chem-phys.net/7/1503/2007/.
Li, Z., Hopke, P. K., Husain, L., Qureshi, S., Dutkiewicz, V. A., Schwab, J. J., Drewnick, F., and Demerjian, K. L.: Sources of fine particle composition in New York city, Atmos. Environ., 38, 6521–6529, 2004.
Lee, E., Chan, C. K., and Paatero, P.: Application of positive ma-trix factorization in source apportionment of particle pollutants in Hong Kong, Atmos. Environ., 33, 3201–3212, 1999. Lee, P. K. H., Brook, J. R., Zlotorzynska, E. D., and Mabury, S. A.:
Indentification of the major sources contributing to PM2.5
ob-served in Toronto, Environ. Sci. Technol., 37, 4831–4840, 2003.
Lee, J. H. and Hopke, P. K.: Apportioning sources of PM2.5in St.
Louis, MO using speciation trends network data, Atmos. Envi-ron., 40, 360–377, 2006.
Liu, W., Hopke, P. K., Han, Y. J., Yi, S. M., Holsen, T. M., Cybart, S., Kozlowski, K., and Milligan, M.: Application of receptor modeling to atmospheric constituents at Potsdam and Stockton, NY, Atmos. Environ., 37, 4997–5007, 2003.
Okuda, T., Kato, J., Mori, J., Tenmoku, M., Suda, Y., Tanaka, S., He, K., Ma, Y., Yang, F., Yu, X., and Duan, F.: Daily concentra-tions of trace metals in aerosols in Beijing, China, determined by using inductively coupled plasma mass spectrometry equipped with laser ablation analysis, and source identification of aerosols, Sci. Total Environ. 330, 145–158, 2004.
Paatero, P.: User’s guide for positive matrix factorization programs PMF2 and PMF3, Part 1: tutorial, 2004.
Paatero, P. and Tapper, U.: Positive matrix factorization: a non-negative factor model with optimal utilization of error estimates of data values, Environmetrics, 5, 111–126, 1994.
Paatero, P.: Lest squares formulation of robust non-negative factor analysis, Chemometr. Intell. Lab., 37, 23–35, 1997.
Perrino, C., Catrambone, M., Di Menno Di Bucchianico, A., and Allegrini, I.: Gaseous ammonia in the urban area of Rome, Italy and its relationship with traffic emissions, Atmos. Environ., 36, 5385–5394, 2002.
Polissar, A. V., Hopke, P. K., and Poirot, R. L.: Atmospheric aerosolover Vermont: chemical composition and sources, Env-iron. Sci. Technol., 35, 4604–4621, 2001.
Polissar, A. V., Hopke, P. K., Paatero, P., Malm, W. C., and Sisler, J. F.: Atmospheric aerosol over Alaska, 2. Elemental composition and sources, J. Geophys. Res., 103, 19 045–19 057, 1998. Reff, A, Eberly, S. I., and Bhave, P. V.: Receptor modeling of
am-bient particulate matter data using positive matrix factorization: Review of exising methods, J. Air Waste Manag. Assoc., 57, 146–154, 2007.
Seinfeld, J. H. and Pandis, S. N.: Atmospheric Chemistry and Physics from Air Pollution to Climate Change, Wiley, New York, USA, 649–655, 1998.
Song, Y., Zhang, Y., Xie, S.D., Zeng, L., Zheng, M., Salmon, L.
G., Shao, M., and Slanina, S.: Source apportionment of PM2.5
in Beijing by positive matrix factorization, Atmos. Environ., 40, 1526–1537, 2006.
Song, Y., Tang, X., Xie, S. D., Zhang, Y., Wei, Y., Zhang, M., Zeng,
L., and Lu, S.: Source apportionment of PM2.5 in Beijing in
2004, J. Hazard. Mater., 146, 124–130, 2007.
State Environmental Protection Administration: Report on the State of the Environment in China, www.zhb.gov.cn/ztbd/sjhjr/ 2007hjr/tpbd56/200706/P020070611461716557487.pdf, 2005. State Environmental Protection Administration: Report on the
State of the Environment in China, www.zhb.gov.cn/download/ 2004gb.pdf, 2007.
Sun, Y., Zhuang, G., Wang, Y., Han, L., Guo, J., Dan, M., Zhang, W., Wang, Z., and Hao, Z.: The air-borne particulate pollution in Beijing – concentration, composition, distribution and sources, Atmos. Environ., 38, 5991–6004, 2004.
Wang, M.: Study on sources of aerosol in Beijing using factor anal-ysis, Chinese J. Atmos. Sc., 9, 73–81, 1985.
Wang, Y., Zhuang, G., Tang, A., Yuan, H., Sun, Y., Chen, S., and
Zheng, A.: The ion chemistry and the source of PM2.5aerosol in
Beijing, Atmos. Environ., 39, 3771–3784, 2005.
Xie, S. D., Yu, T., Zhang,Y. H., Zeng, L. M., Qi, L., and Tang, X.
Y: Characteristics of PM10, SO2, NOxand O3 in ambient air
during the dust-storm period in Beijing, Sci. Total Environ., 345, 153–164, 2005.
Yoo, J. I., Kim, K. H., Jang, H. N., Seo, Y. C., Seok, K. S., Hong, J. H., and Jang, M.: Emission characteristics of particulate matter and heavy metals from small incinerators and boilers, Atmos. Environ., 36, 5057–5066, 2002.
Yuan, Z., Yu, J. Z., Lau, A. K. H., Louie, P. K. K., and Fung, J. C. H.: Application of positive matrix factorization in estimating aerosol secondary organic carbon in Hong Kong and its relationship with secondary sulfate, Atmos. Chem. Phys., 6, 25–34, 2006, http://www.atmos-chem-phys.net/6/25/2006/.
Zabalza, J., Ogulei, D., Hopke, P. K., Lee, J. H., Hwang, I., Querol, X., Alastuey, A., and Santamaria, J. M: Concentration
and sources of PM10and its constituents in Alsasua, Spain,
Wa-ter Air Soil Poll., 174, 385–404, 2006.
Zheng, M., Salmon, L. G., Schauer, J. J., Zeng, L., Kiang, C. S.,
Zhang, Y., and Cass, G. R.: Seasonal trends in PM2.5source
con-tributions in Beijing, China, Atmos. Environ., 39, 3967–3976, 2005.