Computational Modeling of Knowledge and Uncertainty in Systems
Biology for Drug Target Identification and Protein Engineering
by
David C. Flowers
B.S. Chemical Engineering, University of Tennessee, 2011
M.S. Chemical Engineering, University of Tennessee, 2012
SUBMITTED TO THE DEPARTMENT OF BIOLOGICAL ENGINEERING IN PARTIAL FULFILLMENT OF THE REQUIREMENTS FOR THE DEGREE OF
DOCTORATE OF PHILOSOPHY IN BIOLOGICAL ENGINEERING
AT THE
MASSACHUSETTS INSTITUTE OF TECHNOLOGY
JUNE 2018
C2018 Massachusetts Institute of Technology. All rights reserved
Signature of Author: Certified by:
Signature
Signature
redacted
. <red acted
Department of Biological Engineering May 8, 2018
Accepted by:
Bruce Tidor Professor of Biological Engineering and Computer Science
Thesis Supervisor
Signature redacted
Forest White Professor of Biological Engineering
TS INSTUTEGSfAyT Graduate Academic Program Chair
AUG 28 2018
MASSACHUSAC TgI~I%This doctoral thesis has been examined by a Committee of the Department of Biological Engineering as follows:
K. Dane Wittrup Thesis Committee Chair
C. P. Dubbs Professor in Chemical Engineering and Biological Engineering
Bruce Tidor
Thesis Supervisor Professor of Biological Engineering and Computer Science
Jacob White
Computational Modeling of Knowledge and Uncertainty in Systems
Biology for Drug Target Identification and Protein Engineering
by
David C. Flowers
Submitted to the Department of Biological Engineering on May 8, 2018, in Partial Fulfillment of the Requirements for the
Degree of Doctorate of Philosophy in Biological Engineering ABSTRACT
In systems biology, ordinary differential equation models are used frequently to model the dynamics of molecular and cellular systems. These models are parameterized with rate constants and other quantities that are often estimated from empirical data. When the data are insufficient to fully determine the model parameters, the parameter values are unidentifiable, and many parameter sets are consistent with the data. To cope, many studies sample a collection of parameters to represent the uncertainty or simplify the model to remove parameters. Studies rarely verify that their sampling is sufficient or test alternative model simplifications.
There is a need for better practices for uncertainty quantification. In this work, I present two case studies demonstrating the use of biochemical models with unidentifiable parameters to make useful predictions. The first study investigates a model of the complement system, a system of circulating proteins involved in immune response, to find promising drug targets for treatment of sepsis. I compared a sampling method to a worst-case search method for quantifying the
uncertainty in responses to hypothetical inhibitors and found that the choice of method
significantly impacts the results. I identified mechanistic explanations for the observed inhibitor responses that demonstrate limitations of intuition and suggest strategies for further studies. The second study uses a kinetic model of the thiolase and reductase enzymes of the 3-hydroxyacid metabolic pathway to interpret available in vitro data to determine the kinetic changes induced by a mutation in the thiolase. Sampling approaches cannot identify all combinations of rate constants that could have changed according to the data, so I perform a selective enumeration strategy that identifies all feasible combinations by testing only a limited number. The simplest feasible combinations identify three classes of rate constant changes induced by the mutation. I also use a global sensitivity analysis approach to predict which reaction steps are most likely to positively affect the product selectivity ratio of the system. Together, these studies demonstrate that unidentifiable models can be useful if the correct methods are chosen to quantify their uncertainty and serve as examples of how to choose or design these methods.
Thesis Supervisor: Bruce Tidor
Acknowledgements
I would like to thank Bruce Tidor for the mentorship, guidance, and leadership he has provided
over these five years in his lab. I have developed tremendously as a scientist and a critical thinker from interacting with him. In particular, I have benefitted from his talent for understanding the story behind the data and knowing what needs to be shown and said to make the point to the audience. He has more than once helped me to see the forest for the trees. I am also greatly appreciative of the guidance my committee members, Dane Wittrup and Jacob White, have provided me at my annual meetings with them and their willingness to advise me on career matters. Professor White's advice on numerical methods has proven particularly useful for my research.
I also want to thank the various members of the Tidor group during my tenure in the lab,
including David Hagen, Ishan Patel, Andrew Homing, Nirmala Paudel, Raja Srinivas, Brian Bonk, Kevin Shi, James Weis, Natasha Seelam, Ishan Arora, David Bloore, and Erika DeBenedictis, who have all contributed their own ways of thinking to my own through their feedback in group meeting and their conversation during lunch or over coffee. Natasha has been a good friend to me and a support when I have run into difficulties in my research, and I
appreciate her interesting conversation and enthusiasm for science and people. I am particularly thankful for Kevin Shi's support as the lab's system administrator; without his dedication to keeping our lab's cluster and other computer systems running, I would have none of the results I present here. I am also thankful for David Hagen's, as well as Kevin Shi's and Joshua Apgar's, work developing the KroneckerBio toolbox, which has been the key piece of software behind the computations I have run over the past five years. I'd also like to thank the various undergraduate and master's students that I have mentored over my time in the lab, including Sahar Alkhairy, Jesse Gibson, Anne Kim, Jonathan Redwine, and Adrian Orozco, who have given me experience in leading scientific investigations and learning to how to manage and teach others.
I would also like to thank my collaborators and colleagues at Pfizer, including Hannah Jones,
Simeon Ramsey, Lisa Murphy, Pratap Singh, Abhinav Tiwari, Nick Pullen, and others, who all have been a tremendous help as collaborators and have helped me understand my results from the perspective of the pharmaceutical industry. Additional thanks belong to Hannah and Pratap for their career advice.
I am extremely grateful for the support of Jessica Zoino, who has been incredibly supportive,
encouraging, and loving since we met and especially during the writing of this thesis. I am also grateful for my family, including my mother Diane, my father Mike, and my two brothers Michael and Brian, who have taught me my entire life to work hard and help others and have shown me exceptional love and dedication over these past nearly thirty years.
Contents
Chapter 1: Introduction... 10
1.1 Parameterizing ordinary differential equations in systems biology ... 10
1.2 Methods for mitigating and quantifying parameter uncertainty... 12
1.3 Lim itations of uncertainty quantification m ethods ... 14
1.4 Overview of the thesis... 15
Chapter 2: Complement system drug target identification for the treatment of sepsis ... 18
2.1 Abstract ... 18
2.2 Contributors to the work ... 19
2.3 Introduction ... 20
2.4 M ethods... 22
2.4.1 M odel ... 22
2.4.2 In vitro human serum complement activation assays ... 23
2.4.3 Param eter estim ation... 24
2.4.4 Param eter sam pling... 25
2.4.5 Sim ulation of sepsis onset and treatm ent... 25
2.4.6 Estim ating the SOFA and norm alized SOFA scores ... 26
2.4.7 Inhibitor properties... 26
2.4.8 Pathw ay activation quantification... 27
2.4.9 Inhibitor pair sim ulations... 27
2.4.10 Confidence interval calculation ... 28
2.5 Results ... 28
2.5.1 M odel fitting and ensem ble sam pling... 28
2.5.2 Effects of single inhibitors on predicted SOFA scores... 29
2.5.3 Explanations for variability in inhibitor effects ... 29
2.5.4 W orst cases for inhibitors ... 33
2.5.5 Com bination therapies ... 34
2.6 Conclusions ... 36
2.7 Supplem entary figures... 41
3.1 Abstract ... 44
3.2 Contributors to the work ... 44
3.3 Introduction ... 46
3.4 M ethods... 48
3.4.1 M odel structure ... 48
3.4.2 In vitro assays ... 48
3.4.3 Fitting the m odel param eters ... 50
3.4.4 Sam pling the ensem ble ... 50
3.4.5 Calculating the variability in 3-hydroxyhexanoyl-CoA production rates... 52
3.4.6 Identifying feasible rate constant variations ... 52
3.4.7 Triplet rate constant quantification ... 53
3.4.8 Product ratio global sensitivity analysis ... 53
3.5 Results ... 54
3.5.1 M odel fitting and ensem ble sam pling... 54
3.5.2 Variability of m odel predictions ... 54
3.5.3 Identifying changed rate constants in the m utant ... 55
3.5.4 Determ ining rate-lim iting steps ... 58
3.6 Conclusions ... 61
3.7 Supplem entary figures... 64
Chapter 4: Conclusion ... 66
References... 72
Appendix A : M odeling the com plem ent system ... 77
A . 1 M odel structure ... 77
A .2 Cytom etric bead array sam ple analysis... 77
A .3 Fitting m odel param eters to the experim ental data ... 77
A .3.1 Types of m odel reactions ... 77
A .3.2 Param eter initialization and bounds... 78
A .3.3 In vitro activation assays... 81
A.3.4 C5aR and C5L2 trafficking assays ... 81
A .3.5 Com plem ent levels in healthy and septic individuals... 82
A .5 Calculation of the SOFA score... 83
A .6 Inhibitor param eters and reactions ... 84
Appendix B: M odeling the thiolase system ... 85
B. 1 Reagent concentrations used in in vitro experim ents... 85
B.2 Fitting the m odel ... 87
Figures
Figure 2.1. Schematic of the complement model ... 24
Figure 2.2. The ensemble distribution of SOFA scores... 30
Figure 2.3. Ensemble distributions of target-to-inhibitor amount ratios ... 31
Figure 2.4. Fraction of the ensemble predicting efficacy for various combinations of active up stream pathw ays... 32
Figure 2.5. Statistical benefit of combination therapies targeting different upstream pathways.. 35
Figure 2.6. The ensemble distribution of free target concentration reduction one week following initiation of treatment with each inhibitor ... 41
Figure 2.7. The effects of inhibitor half-life and dissociation constant on efficacy ... 42
Figure 2.8. Variability of pathway activation across the ensemble ... 43
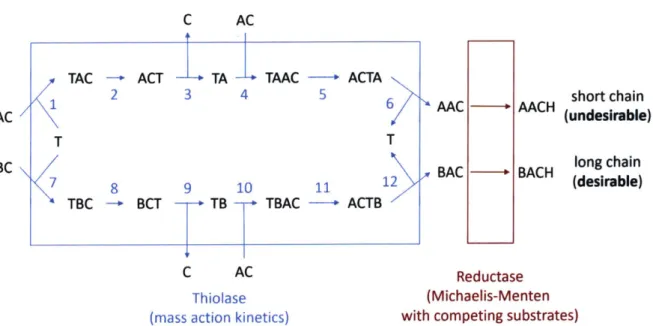
Figure 3.1. Schematic of the model structure ... 49
Figure 3.2. Ensemble distribution of predicted increases in the BACH production rate resulting from the thiolase m utation ... 56
Figure 3.3. Feasible rate constant triplets ... 57
Figure 3.4. Sensitivity of the product selectivity ratio to transition state free energies... 59
Figure 3.5. Quality of fit of the ensemble ... 64
Tables
Table 1. Param eter values and their bounds ... 78
Table 2. Steady state concentrations of components used for parameter estimation... 82
Table 3. Parameters and chosen ranges of values for inhibitors... 84
Table 4. Concentrations of reagents (in tM) used in the in vitro assays... 85
Chapter 1: Introduction
As molecular biology has become more systems-oriented, computational modeling approaches have become an attractive method for analyzing data and understanding complexity in biological systems. Molecular biological systems are comprised of many different parts interacting
nonlinearly to perform coherent functions (1). Before the advent of systems biology, molecular biology depended primarily on accurate experimentation and intuitive analysis to uncover the function of the individual parts (proteins and genes). The governing philosophy, referred to as reductionism, was that biological systems could be divided into pieces and each piece understood individually to understand the overall function. While successful initially, this philosophy
appears to be reaching its limit, and a more holistic approach is needed (2). Systems biology seeks to understand biological interactions holistically by using statistical and computational methods to integrate experimental data.
1.1 Parameterizing ordinary differential equations in systems biology
One of the common mathematical frameworks for representing how the properties of biological systems evolve in time is systems of first-order ordinary differential equations (ODEs). ODE systems are integrated with respect to an independent variable (time, in this case) to calculate the values of the system properties (or state variables) at each time of interest, starting from a set of initial state values defined by the modeler. ODE systems describe a number of phenomena in physics and chemistry, including chemical kinetics (3), and today are used in a variety of
subfields of biology, including enzyme kinetics (4), pharmacokinetic and pharmacodynamics for drug development (5), metabolic engineering (6), epidemiology (7), ecology (8), and
neuroscience (9). Models are used to represent interactions on the scales of molecules, cells, tissues, and populations of organisms.
Models are characterized by parameters that quantify the rates of its various reactions and processes. Values must be chosen for these parameters to fully specify the system, yet the true values of the parameters are usually unknown (10). Therefore, modelers often rely on parameter estimation techniques to determine the set of parameters that are most consistent with whatever system-related data are available. Parameter estimation techniques commonly consist of optimization algorithms applied to perform least-squares regression: select parameter values to minimize the square of the difference (or residual) between model-predicted output values and their corresponding experimental measurements. Gradient-based optimization algorithms, such as the Levenberg-Marquardt algorithm (11), are frequently used for this purpose, but many other algorithms are available, including particle swarm methods (12) and genetic algorithms (13).
One commonly encountered difficulty in parameter estimation is that there are insufficient data to determine precise values for the parameters. In these cases, there is not just one set of parameters that adequately fits the available data, but many, perhaps even an infinite number. The existence of many parameter sets consistent with the data indicates the model parameter values are uncertain. Models with uncertain parameters often have a sum-of-squares residual function that has plateau-like flat regions and many local minima, both of which cause problems with convergence for many optimization algorithms. Even if the optimal parameter sets are found, there can be many alternative parameter sets that are comparably consistent with the data. Since both the model and the available data are approximate, the parameter values that are the solution to the optimization problem may not coincide with the "true" or "best" values.
The obvious solution is to collect more data, but the amount of data required to fully
determine the model parameters can be very large. The data from very specific experiments may be necessary to specify the model parameters (14), and these experimental designs may not be known or easily determined. Even if suitable experimental designs are known, they may be infeasibly difficult, expensive, or time-consuming. Also, modelers frequently must build models using pre-existing data, precluding additional experiments from being performed.
1.2 Methods for mitigating and quantifying parameter uncertainty
To cope with uncertainty when more data are not available, one approach is to reduce the number of parameters in the model, thereby reducing the amount of data needed to determine the parameters. One method of parameter reduction is to find species of the model that change rapidly enough to allow model simplification. The quasi-steady-state assumption assumes that a model species or combination of species has fast enough dynamics that it can be assumed to be at steady state at all times (15). This assumption removes one degree of freedom from the ordinary differential equations and frequently removes a parameter from consideration. This assumption is the key assumption of the derivation of the well-known Michaelis-Menten
equation in enzyme kinetics. Time-scale separation techniques are a more general application of this principle that categorize all the model species or particular combinations of species as slow or fast, then assume a quasi-steady-state for all the fast species (16). Automated time scale separation algorithms have been developed to automatically perform the categorization and resulting model simplifications (17).
Another approach is to use global sensitivity analysis to determine how sensitive each model prediction of interest is to each parameter across many feasible parameter sets (18). These methods often involve sampling a collection of feasible parameters, then using various metrics,
such as partial rank correlation coefficients or variance decompositions, to quantify how the model predictions vary with the parameters (19). Parameters that weakly covary with the model species of interest indicate irrelevant parameters, species, or reactions that can be removed from the model.
Rather than remove the uncertainty, one can instead quantify the uncertainty in the model parameters and propagate that uncertainty through to the model predictions. A simple way to do this is to use sampling techniques to generate an ensemble of parameter sets that represent the distribution of parameters. If the residuals are treated as normally distributed variables, the sum of squared residuals corresponds to a chi-squared distribution, and a likelihood value can be calculated for any sum of squared residuals value. Parameter sets can then be sampled from the likelihood function using any sampling technique.
One class of popular sampling techniques is Markov Chain Monte Carlo (MCMC) methods, such as the Metropolis-Hastings algorithm and the related Gibbs sampler (20), which represent a path through parameter space as a Markov chain, accepting or rejecting moves with a probability based on the likelihood of the parameter values before and after the move. As the series of moves increases in size, the collected parameter sets converge to the desired distribution. In another class of methods, the likelihood function is approximated and sampled using a linearization of the model that is less computationally expensive to evaluate. One approximation method is to use the Fisher information matrix evaluated at the best-fit parameter set to calculate an
approximate multinormal distribution, which is readily sampled using standard techniques such as Latin hypercube sampling (21).
1.3 Limitations of uncertainty quantification methods
Unfortunately, uncertainty quantification via sampling tends to be either inaccurate, computationally expensive, or both. The number of samples needed to characterize the uncertainty grows exponentially with the number of model parameters, making sampling difficult for models with more than a few uncertain model parameters. MCMC techniques are inherently serial, so large computing clusters do not help alleviate the computational cost. Efforts are ongoing to parallelize these techniques (22-24). Also, the highly nonlinear nature of the target distribution means that most standard proposal distributions generate Markov chains that are very slow to converge to the target distribution. Sampling methods that approximate the likelihood function are parallelizable, but they are often inaccurate because they usually depend on linearizations of the highly nonlinear model functions at the best-fit parameter values. The linearizations are only accurate near the evaluation point, so samples tend to span a small region.
Because of these difficulties, many studies approach uncertainty one of two ways: (1) only examining the best-fit parameter set or a relatively small number of samples, or (2) using simplistic models with small numbers of parameters. The first approach ignores accurate quantification of uncertainty outright, while the second attempts to avoid the issue entirely, sometimes at the cost of removing some of the known biological mechanism. It is unclear how inadequate sampling affects predictions of the model systems biology modeling studies. Due to the paucity of studies using uncertain models, there are no established methods or pipelines for dealing with model uncertainty, and there are few case studies to serve as examples to guide other modelers.
It is tempting to think that the solution to these issues lies in methods development, but it is difficult for methods development studies to change the field. Modelers needs to be strongly
convinced of the importance and usefulness of a new method before they will use it. It is a substantial effort to learn new methods because doing so requires learning a new theory, adapting one's workflow, and gaining experience applying the method to problems.
Many methods studies do not effectively demonstrate their significance. Methods development studies typically test the method on a small number of models that do not
demonstrate how well the method will generalize. Additionally, methods from papers are often not implemented to the level of quality required for general use and are difficult for the reader to implement without substantial effort. Many systems biology modeling software platforms have been developed (25-28), and implementations of new methods are usually compatible with a limited range of these platforms.
Applications studies of highly uncertain models could provide the beginnings of a framework for mitigating parametric uncertainty. With a biological question instead of a methodological one driving the study, the target audience is widened to include both modelers and biologists. Also, the significance of the work and the methodological decisions made by the investigator is easier to gauge in the context of an application. If a method is critical to the conclusions of the study, its value is shown much more clearly than if the method is studied on its own.
1.4 Overview of the thesis
In this work, I present two case studies of using highly uncertain chemical kinetic models to study biological systems. In these studies, I compared the diversity of predictions attained from different uncertainty representations and found that the representation has a significant impact on the conclusions drawn from the models. I was able to make useful predictions from the models
by searching for feasible parameter sets that predict interesting outcomes. By carefully choosing
predictions of interest while avoiding the poor scaling of sampling-based methods. The sources of uncertainty reveal novel hypotheses for the mechanisms behind biological phenomena. They also provide a mechanistic rather than mathematical or statistical explanation for the most critical sources of uncertainty, which enables effective communication of the results to those less
familiar with modeling concepts and terminology.
The first study is presented in Chapter 2, in which a model of the complement system is used to predict the efficacy of hypothetical drug targets for treating sepsis. A panel of experimental data only partially informs the model parameters, and an ensemble of parameter sets is sampled to represent the uncertainty. Hypothetical inhibitors are simulated across the ensemble, and intuitive concepts are shown to explain the variability in the ensemble inhibitor responses. These results are compared to results obtained from a worst-case search procedure for representing uncertainty and found to differ significantly; the worst cases predict the inhibitors can significantly worsen disease, even for some inhibitors that were frequently effective in the ensemble. We find that realistic explanations underlie the worst cases, suggesting that these worst cases should not be ignored. We also identify an inhibitor that does not have a pathological worst case and appears to work consistently despite the parameter uncertainty.
The second study, presented in Chapter 3, uses models of the 3-hydroxyacid metabolic pathway to determine how a mutation to the first enzyme of the pathway, a thiolase, affects the kinetics of the pathway and causes an observed increase in the product selectivity ratio. The model parameters were estimated from data from the wild-type and mutant pathways and were found to be unidentifiable, resulting in highly variable model predictions across an ensemble of sampled rate constant sets. Due to the model uncertainty, the model predicted many
procedures infeasible to fully characterize the possible changes. To avoid sampling issues, I developed and used a selective enumeration procedure that only evaluates the feasibility of certain highly informative combinations. Using this method, I successfully determined all the feasible combinations of rate constants. Studying the feasible changes that vary no extraneous rate constants reveals three core changes to the thiolase rate constants indicated by the data. To guide future efforts to further engineer the pathway, I performed a global sensitivity analysis to determine the reaction steps whose transition state free energies most strongly affect the product selectivity ratio in both the wild type and the mutant. Like the other model predictions, the most sensitive transition states vary across the ensemble, but we find that some reaction steps are more likely to be ratio-sensitive than others.
Together, the two studies demonstrate that the choice of method for uncertainty quantification is important. The model predictions can differ dramatically between methods, as demonstrated
by the complement study, and choosing the correct method can be the difference between
feasibility and infeasibility, as observed in the thiolase study. The studies also show how one can avoid incomplete conclusions and infeasibly large computational costs by selectively studying only the interesting sources of uncertainty. In the complement study, this was done by using an optimization-based search procedure to find only the parameter sets predicting the extreme values of the inhibitor responses. In the thiolase study, the total set of feasible combinations of changing rate constants was simplified down to those sets that vary no more rate constants than was necessary.
Chapter 2: Complement system drug target
identification for the treatment of sepsis
2.1 AbstractSepsis refers to multi-organ damage resulting from systemic infection and is a common condition with high mortality rates, and there are no approved therapeutics for its treatment. Activation of the complement system appears to play a critical role in the pathogenesis of sepsis, and the recent successes of complement therapeutics such as eculizumab for other diseases suggest that complement-targeted therapeutics may be beneficial to sepsis patients as well. However, there are many possible inhibition targets in the complement system, and it is unclear which target(s), if any, would decrease complement activation appreciably enough to improve patient outcomes.
In this study, we developed and used a mechanistic model of the complement system, informed by in vitro assays of complement activation in human serum, to predict the degree of activation modulation in septic patients in response to hypothetical inhibitors targeting various complement proteins. To calculate the variability in the predictions arising from uncertainty in the model parameters, we calculated the distribution of responses over an uncertainty ensemble of parameter sets. We found that inhibitors that show little efficacy tend to target proteins that are present in large amount or that are in inactive pathways and that variability in target amount and pathway activity explain much of the variability in responses seen in the ensemble. We also searched for worst-case parameter sets for each inhibitor and found that most of the inhibitors can increase activation in certain parameter sets. Most of these cases predict that accumulation of a second complement species drives a transient burst of complement activation upon target breakthrough. Others predict that inhibition of one pathway prevents it from outcompeting a
second, more productive pathway for a limiting resource. We also studied combination inhibitors and found that inhibitors targeting different upstream pathways have a greater chance to block an active pathway. We also observed that upstream inhibitors can reduce production of downstream targets, preventing breakthrough of the downstream inhibitor's target, resulting in efficacy for two inhibitors that show no efficacy alone.
Our results indicate some of the possible responses to complement inhibition in sepsis and provide a mechanistic explanation for the responses that can generalize to other diseases and pathways.
2.2 Contributors to the work
In vitro assays were performed by Elizabeth Murphy, a collaborator at the Pfizer Biomedical
Institute in Cambridge, Massachusetts. All complement modeling work, including the construction, simulation, and analysis of the model, was performed by David Flowers.
2.3 Introduction
Sepsis is a systemic immune response to an infection that often leads to organ failure and death. Severe infection leads to pro-inflammatory responses, which clear the pathogen but also cause tissue damage, and compensational anti-inflammatory responses, which can limit damage to organs but also cause susceptibility to secondary infections (29). Mortality rates range from 25 to
50 percent (30). Of all hospital stays, those involving sepsis were responsible for the largest
fraction of hospital costs in the United States in 2011 (31).
No therapeutic is currently available to treat sepsis. The standard of care consists of administration of antibiotics, intravenous fluid replenishment, oxygen therapy, removal of infected or damaged tissue, and machine-assisted respiration and kidney dialysis, if necessary (32). Drug candidates have failed to show any effective decrease in the mortality rate in over one hundred clinical trials (33). Human recombinant protein C was temporarily approved for the treatment of severe sepsis in 2001 but was withdrawn in 2011 because subsequent clinical trials could not reproduce its purported benefit to patient survival (34).
A possible pathway to target for treating sepsis is the complement system, a set of proteins in
the circulation involved in the innate immune response that plays a critical role in sepsis pathology. The complement system consists of three upstream pathways (the classical,
alternative, and lectin pathways) and a downstream terminal pathway. Complement precursor proteins in the upstream pathways cleave into active fragments in the presence of pathogen associated molecular patterns such as lipopolysaccharides (LPS). These active fragments bind to and opsonize foreign cells, marking them for phagocytosis by cells such as neutrophils or
macrophages. The bound fragments also form enzymes called convertases that catalyze the formation of additional active fragments and cleavage of C5 into C5a and C5b. C5b binds other
complement components to form the membrane attack complex, which binds and lyses foreign cells. C5a binds to the receptor C5aR on neutrophils and other immune cells and stimulates receptor internalization and pro-inflammatory and chemotactic responses.
In sepsis, excess production of C5a may simultaneously drive a pro-inflammatory response and cause "neutrophil paralysis," depressing neutrophil's ability to respond to foreign cells by overstimulating the C5aR receptor (35). This mechanism appears to be important to sepsis pathology in animal models, as inhibition of C5, C5a, or C5aR significantly increase survival in rodent, porcine, and primate models of sepsis (35-41). There is evidence this mechanism is important in humans as well. The surface concentration of C5aR on neutrophils was found to be negatively correlated to the sequential organ failure assessment (SOFA) score, a measure of the degree of organ failure in sepsis that positively correlates with patient mortality rates (42,43).
Complement inhibitors have proven useful, or at least promising, for treatment of other immune-related diseases. Eculizumab, a monoclonal antibody inhibitor of C5, has been approved
by the FDA for three indications (44). Several other complement inhibitors that target various
complement proteins are in various phases of clinical trials (45). Whether any of these inhibitors would provide a benefit to sepsis patients, or whether another untested inhibition strategy would be optimal, is currently unclear.
Computational modeling of the complement system is an inexpensive way to evaluate the feasibility of hypothetical drugs for treating sepsis. The model could be used to suggest possible failure modes for drug targets and highlight some of the target and patient characteristics that determine whether a drug will fail or succeed, helping drug development efforts. Computational models of complement or sepsis have been developed previously, but to our knowledge, no studies have used modeling to study the role of the complement system in sepsis. Complement
models developed previously (46-52) only represent select pathways, do not study the
complement to disease processes, and/or do not study pharmacological inhibition in detail. While computational studies of systemic inflammation (53-57) and sepsis (55,58) have been
performed, none study pharmacological interventions within complement.
We developed a computational model of the complement system to evaluate hypothetical drug targets for the treatment of sepsis. We performed in vitro complement activation experiments and gathered additional data from the literature to inform the parameters of the model, then quantified the uncertainty in the model and its predictions by performing simulations over an ensemble of feasible parameter sets. We also sought out "worst-case" parameter sets that predict the worst possible responses to inhibitors. Most inhibitors are seen to work for only a fraction or none of the ensemble members because prohibitively large doses are necessary to cover the targets and different pathways are active in different ensemble members. In the worst cases, inhibitors worsen disease substantially as a result of nonlinear yet intuitive processes. Combination therapy simulations demonstrate how these concepts determine which pairs of ineffectual inhibitors show efficacy. Our results provide a roadmap to inhibition of complement in sepsis and other complement-associated diseases and provide insight into how nonlinear pathway dynamics in general can be understood and leveraged pharmacologically.
2.4 Methods
2.4.1 Model
A model of LPS activation of the classical, alternative, lectin, and terminal pathways of
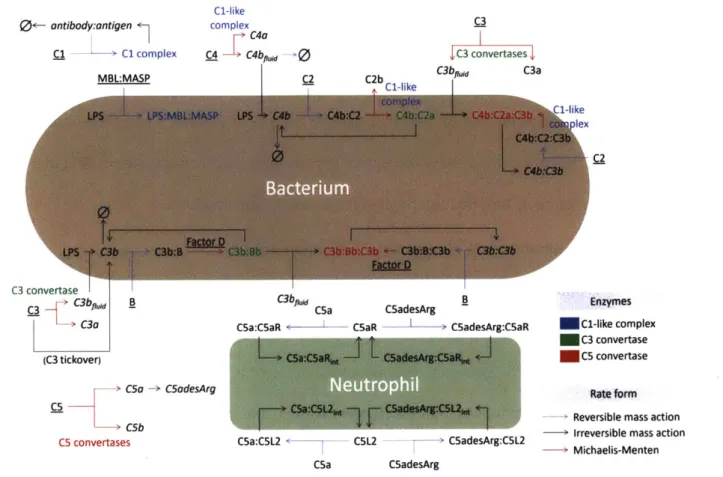
complement was developed. We chose to include the central complement reactions critical to the formation of the C3 and C5 convertases on foreign cells, the formation of C5a, and the binding of C5a to its receptors. A schematic of the model is shown in Figure 2.1. LPS, held at a constant
concentration, is treated as a model species to which complement proteins can bind, driving production of C3 and C5 convertases and, consequently, generation of C5a and internalization of C5aR and C5L2. By increasing the parameter setting the LPS concentration, one can increase the rate of complement activation and thereby increase the severity of disease. The LPS parameter is optimized during the parameter estimation routine to reproduce levels of complement factors reported in the literature as described in Section Parameter estimation2.4.3.
2.4.2 In vitro human serum complement activation assays
A complement anaphylatoxin cytometric bead array (BD Biosciences, Franklin Lakes, NJ) was
used to measure C3a, C4a, and C5a concentrations in human serum in response to three complement activators, LPS, zymosan, and cobra venom factor (CVF). Blood was drawn into silicon coated plastic serum tubes (BD Biosciences) with no anti-coagulants. Blood samples originated from two donors, both females, ages 33 and 47. After 30 minutes of incubation at room temperature, the samples were spun down, and 135 pL serum samples were immediately harvested and dispensed into 96-well polypropylene microplates (Greiner Bio-One,
Kremsmtnster, Austria) containing 15 pL activator stock diluted with CMF-PBS (in-house preparation). Activator stocks used included Ultra-pure LPS-EB (InvivoGen, San Diego, CA) at
5 mg/mL in nuclease-free water, zymosan (InvivoGen, San Diego, CA) 10 mg/mL stock, and
purified cobra venom factor (Complement Technology, Inc., Tyler, TX) 1 mg/mL stock. Serum samples were incubated at 37'C and quenched at various time points with 1.5 ptL of 0.005 M
Cl-like 0<- antibody:antigen complex Q C4a C1 - C1 complex C4 C4bft * C3 convertases MBL:MASP C2 C2b C3bfl C3a I Cl-like complex
LPS LPS:MBL:MASP LIPS C4b - C4b:C2 L C4b:C2a + C4b:C2a:C3b I complex
C4b:C2:C3b 0 C2 C4b:C3b 0 0 Factor D LPS T C3b C3b:B > C3b:Bb C3b:Bb:C3b +- C3b:B:C3b< C3b:C3b
It
Factor D C3 convertase C C3bfw B C3b C5a C5adesArg B' C3o C5a:C5aR : i CSaR - -- + C5adesArg:CSaR
(C3 tickoverj C5a:C5aR t C5adesArg:C5aR -- C5a -+ C5adesArg
C5b Ca:C5L2 , C5adesArg:C5L2w
CS convertases C5a:C5L2 - C5L2 - > C5adesArg:C5L2 C5a C5adesArg Enzymes Cl-like complex C3 convertase CS convertase Rate form Reversible mass action Irreversible mass action -4Michaelis-Menten
Figure 2.1. Schematic of the complement model. Underlined species have zeroth-order synthesis and first-order degradation reactions. Italicized species have first-order degradation reactions. Text next to Michaelis-Menten arrows indicates the enzymes that catalyze the reaction.
EDTA and 1.5 p.L of 50 ug/mL Futhan (BD Biosciences). Sample analysis was performed
according to the manufacturer's instructions for filter plates (see Appendix A.2).
2.4.3 Parameter estimation
The model parameters were chosen to minimize the least-squares error between the model values and experimental values for three sets of data simultaneously: (1) in vitro measurements of C3a, C4a, and C5a concentrations in human serum after stimulation with various concentrations of complement activators, (2) literature data on C5aR and C5L2 internalization and recycling in response to binding of C5a and C5adesArg (59,60), and (3) normal levels of complement factors in healthy and septic patients. Parameter estimation was performed via a gradient-descent-based
algorithm using the FitObjective function of the KroneckerBio toolbox running on MATLAB R2016a. Parameters were bounded to prevent them from taking unrealistically small or large values.
2.4.4 Parameter sampling
The parameter estimation procedure described previously was performed 500 times, each time starting from a different initial parameter set selected log-uniformly within the parameter bounds. Of these parameter estimation attempts, 251 converged. For each converged parameter set, an additional 100 parameter sets were sampled from a bounded multinormal distribution centered on the best-fit parameter set with an estimated covariance matrix and bounded by the parameter bounds. The covariance matrix was calculated as the inverse of the Fisher information matrix of the likelihood function evaluated at the best-fit parameter set. Any parameter sets were eliminated that did not meet three feasibility criteria: (1) a least-squares residual less than 672, the upper 95 percent bound on the chi-squared statistic for 613 degrees of freedom; (2) all individual data point errors less than four standard errors from their means; and (3) a sepsis LPS concentration greater than healthy LPS concentration.
2.4.5 Simulation of sepsis onset and treatment
Sepsis is simulated in three stages: the healthy state, the pre-treatment sepsis state, and the post-treatment sepsis state. At the healthy state, the model components are at their steady state
concentrations with the LPS parameter set to its healthy value. Similarly, the pre-treatment sepsis state is defined as the steady state with the LPS parameter set to its elevated sepsis value. We assume that patients presenting to the hospital with sepsis are described reasonably well by the steady state, because the time scale for models to reach the sepsis steady state from the healthy steady state is only a few days (data not shown).
In sepsis treatment simulations, at t--0, the model components are set to their sepsis steady state concentrations, and an inhibitor dose is introduced at a constant rate over 30 minutes into the circulation. The model component concentrations are tracked for one week following the inhibitor dose unless otherwise noted.
2.4.6 Estimating the SOFA and normalized SOFA scores
Disease severity is quantified as a sepsis-related organ failure assessment (SOFA) score estimated from the degree of reduction of surface C5aR on neutrophils. The SOFA score is an integer-valued metric ranging from 0 to 24 that measures the severity of organ failure in the patient (43). We calculated the SOFA score as a linear function of the molar fraction of healthy C5aR remaining on the surface of neutrophils. The linear function is based on a reported
correlation between neutrophil C5aR levels and the SOFA score (61).
To quantify disease severity post-treatment relative to pre-treatment, we defined a normalized
SOFA score as the ratio of the post-treatment SOFA score to the pre-treatment SOFA score. This
was to allow comparisons between ensemble members that predict different pre-treatment SOFA scores.
2.4.7 Inhibitor properties
Antibody inhibitors to ten separate sets of targets were simulated. The target sets include Factor B, Cl, C2, C3, C4, C5, C5a and C5adesArg, C5aR, Factor D, and MBLMASP. Antibody
inhibitors bound to their targets reversibly, and both free and complexed inhibitor degraded with the same half-life. A single-compartment model was used to model the pharmacokinetics of the
inhibitors. 1200 mg of inhibitor were administered over 30 minutes, unless noted otherwise. We chose to simulate a high dose (similar to the dose used for eculizumab in the maintenance phase
of paroxysmal hemoglobinuria treatment (62)) to determine whether any of the targets could feasibly show efficacy at realistic doses.
2.4.8 Pathway activation quantification
To quantify pathway activation, we calculated and compared the relative contribution of each pathway's enzymes to the rate of production of four active fragments (C3b, C5a, C4b, and C2a).
C3b and C5a are produced by C3 and C5 convertases, respectively. C3 convertases include
C3bBb, produced by the alternative pathway, and C4b2a, produced by both the classical and
lectin pathways. C5 convertases include C3bBb3b, produced by the alternative pathway, and C4b2a3b, produced by the classical and lectin pathways. C4b and C2a are both produced by separate proteases from the classical and lectin pathways. Rates of production were calculated at the pre-treatment sepsis steady state. We report the fraction of C3b and C5a generated by the alternative pathway convertases and the fraction of C4b and C2a generated by the classical pathway proteases.
The alternative pathway was considered active if it produced at least 50 percent of either C3b or C5a. The classical and lectin pathways were considered active if they produced at least 50 percent of C3b or C5a and produced at least 50 percent of C4b or C2a.
2.4.9 Inhibitor pair simulations
Combination inhibitor simulations were performed across the uncertainty ensemble as previously described for all possible pairs of inhibitors. For each pair of inhibitors, each ensemble member was randomly assigned a dose amount of each single inhibitor ranging from the smallest dose achieving 10 percent of the maximum effect across the ensemble to the largest dose achieving 90 percent of the maximum effect across the ensemble. Maximum reductions in the normalized
minutes), and the 10% and 90% doses were calculated for each ensemble member using MATLAB's fzero function, a nonlinear equation solver.
Combination therapy efficacy calculations were compared to an estimated "independent action" efficacy calculated according to the Bliss independence model. When the normalized
SOFA score is used to measure efficacy, the Bliss independence estimate corresponds to the
product of the two normalized SOFA scores. When the fraction of ensemble members predicting a normalized SOFA score below a threshold value is used as the efficacy metric, the Bliss
independence estimate is the sum of the two fractions minus the product of the fractions.
2.4.10 Confidence interval calculation
Unless indicated otherwise, confidence intervals were calculated via bootstrapping. For a quantity calculated from n samples, 1000 sets of n samples were drawn with replacement, and the 2p percent lower and upper confidence limits were calculated from the pth and (1 00-p)th
percentile values of the 1000 sets.
2.5 Results
2.5.1 Model fitting and ensemble sampling
To estimate the model parameters and quantify their uncertainty, we performed 500 iterations of parameter estimation, then sampled 100 parameter sets in the neighborhood of each converged
fit. The resulting ensemble of 25,100 parameter sets adequately fit the experimental data. The mean sum of squares error is 402, and no model has a sum of squared residuals greater than the upper 99 percent confidence limit of 674. Additionally, no single data point has a residual more than four standard errors away from the experimental value.
2.5.2 Effects of single inhibitors on predicted SOFA scores
To calculate the distribution of inhibitor responses, we calculated the SOFA scores predicted by each ensemble member before treatment and after one week of treatment. The distribution of pre- and post-treatment SOFA scores is shown in Figure 2.2.
Some inhibitors consistently show strong or weak responses. Every ensemble member predicts a maximal response to C5aR inhibition, while CI, C3, and C4 inhibition results in a
maximal response in less than one percent of the ensemble simulations. The remaining inhibitor responses vary significantly across the ensemble, ranging from near-complete response in the case of C5a to nearly no response in the case of Factor B inhibition.
2.5.3 Explanations for variability in inhibitor effects
We investigated possible explanations for the variability in efficacy. First, we determined whether the inhibitors were successfully reducing the free concentration of their targets. We found that target breakthrough was occurring in a substantial fraction of the ensemble by one week following initiation of treatment for most inhibitors (see Figure 2.6).
One explanation was that doses were stoichiometrically insufficient to cover their targets, meaning there are more molecules of target than of inhibitor. To investigate this possibility, we calculated the ratio of the moles of target generated over the one-week treatment period to the moles of inhibitor for each ensemble member and inhibitor. A ratio greater than 1 indicates the inhibitor is underdosed. The distribution of these ratios for each inhibitor are shown in Figure
2.3. Most of the inhibitors with variable efficacy are underdosed in a significant fraction of the
ensemble. C3 and C4 inhibitors in particular are underdosed in more than 98.6 (98.4 - 98.7, =
0.01) percent of the ensemble. C5aR inhibitors are never underdosed. When underdosed,
B D 0.8 0.6 0.4, 1 0.8 0.6 0.4 C3 0.2 0.2 0.2 0 2 0 2L82 1 0 2 K 2 0 6 12 18 24 0 6 12 18 24 0 6 12 18 24 1 0.8 0.6 0.4 C2 1 0.2 0.2 0 6 12 18 24 0 6 12 18 24 0.8 0.6 0.4 C4 0.2 0 -0 6 12 18 24 1 MBLMASP 0.8 0.6 0.4 0.2 0 0 6 12 18 24 1 C5 0.8 1 0.6 0.4 0.2 0 0 6 12 18 24 1 0.8 0.6 0.41 C5a 1 0.21 0 -0 6 12 18 24 0.8 0.6 0.4 C5aR 0.2 01 0 6 12 18 24 SOFA score Pre-treatment Post-treatment
Figure 2.2. The ensemble distribution of SOFA scores before treatment and one week after single inhibitor treatment. Higher SOFA scores indicate more severe disease. Each subplot represents the inhibitor that blocks the listed target. Pre-treatment scores are calculated at the sepsis steady state for each ensemble member. Post-treatment scores are calculated one week after a 1200 mg dose of the
indicated inhibitor. 99 percent confidence intervals were calculated but are not shown because they were very small; the largest observed interval was 0.0 17 (unitless).
exceed inhibitor amounts by 10 percent or more, no inhibitors reduce the normalized SOFA score below 0.25 except Factor B and C5 inhibitors, which do so in only 4.3 percent (3.9 - 4.6 percent, a = 0.01) and 0.15 percent (0.06 -0.28 percent, a = 0.01) of ensemble members,
respectively. 1 0.8 0.6 0.4 C1 1 0.8 0.6 0.4 E a) C -0 4-0 U
LI
0.1 0 1 0.1 0. C 0.1 C-- 1 0.05 0.5 0.05 0.5 0.05 0.5 00 0 0 0 0 0 10-5 1 105 10-5 1 105 10-5 1 105 0C1 C2 C4 MBLMASP -o 0.1 .... , - 1 0.1 0.1 - 0.1 -0.05 0.5 0.05 0.5 0.05 0.5 0.05 0.5 0 0 0 0 0 0 0 0 10-5 1 105 10-5 1 105 10-5 1 105 10-5 1 10 LL 0.1 CS 1 0.1 C5a 1 0.1 CUaR 1 0.05 0.5 0.05 0.5 0.05 0.5 0 ._ 0 0 LJ0 01 A0 10- 1 1 105 10-5 1 105 10-5 1 105
Target-to-inhibitor amount ratio (pmol/pmol)
Figure 2.3. Ensemble distributions of target-to-inhibitor amount ratios (shown in the blue histograms, left vertical axes) and the mean normalized SOFA scores of ensemble members with specified ratio values (orange lines, right vertical axis; two-tailed 99 percent confidence intervals are shown but are generally very small). Many inhibitor targets are underdosed in a substantial fraction of the ensemble, as indicated by distributions lying to the right of a ratio value of 1. The mean normalized SOFA score is significantly lower for ratio values less than 1.
Weak drug affinity and rapid clearance could also contribute to target breakthrough. We tested this explanation by determining how the mean normalized SOFA score varies with the inhibitor dissociation constant and half-life (shown in Figure 2.7) and found that variability in these does not strongly influence efficacy if the dissociation constant is less than 0.1 nM.
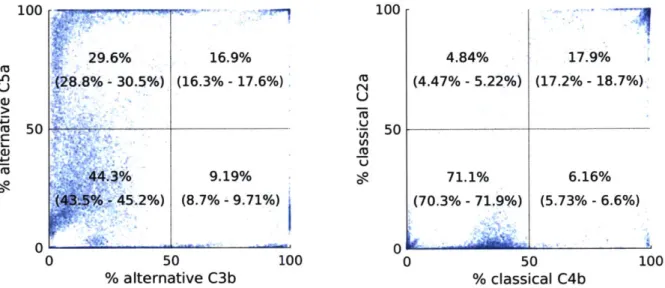
Variability in pathway activation could also affect inhibitor response. To quantify pathway activation prior to inhibitor treatment, we calculated the fraction of active fragments generated
by the upstream (alternative, classical, and lectin) pathways' enzymes at the septic steady state,
as shown in Figure 2.8. Each pathway generates more than 50 percent of at least one active fragment in at least 4 percent of the ensemble, indicating that pathway-specific activation is significantly variable across the ensemble.
100 10-2, 10-4 L "LiI)J-U "LiI)J-U 100 10-2. 10-4 6 - I i ,a 5 .at E Li <L La5 100 10-2 10.0 SU «La~ 100 D 10-1 Uo Li -J < LI - - % U <«< 100 10 MLMASP 102 102 10-2, 10-2 <«<iUi < < Li i
All targeted pathways inactive
At least one targeted pathway active
Active pathways
(red indicates all targeted pathways are inactive)
Figure 2.4. Fraction of the ensemble predicting efficacy for various combinations of active upstream pathways. Each inhibitor is shown in each subplot. The horizontal axis indicates the active pathways in the sub-ensemble (A = alternative, C = classical, L = lectin, "any" indicates the entire ensemble). The vertical axis indicates the fraction of the sub-ensemble that predicts efficacy, with efficacy
defined as a one-week post-treatment normalized SOFA score less than 0.25. Red text and orange bars indicate the pathway combinations in which the inhibitor's targeted pathways are inactive. Missing bars indicate sub-ensembles in which no members predict efficacy. 99 percent confidence intervals are
shown. For C1, C2, MBLMASP, Factor B, and Factor D inhibitors, if no targeted pathways are active, the fraction predicting efficacy is significantly lower than in the whole ensemble. For C2,
MBLMASP, Factor B, and Factor D inhibitors, if any targeted pathway is active, the inhibitor shows the same or significantly greater efficacy as in the entire ensemble. C3 inhibitor is not shown because no ensemble members predicted C3 inhibitor efficacy.
We suspected that inhibitors targeting inactive upstream pathways would fail to show efficacy. To investigate this possibility, for each upstream inhibitor, we calculated how
frequently efficacy is observed among ensemble members when each combination of pathways is active. We considered a pathway to be inactive when it generates less than 50 percent of each type of active fragment; otherwise the pathway is considered active. As shown in Figure 2.4, efficacy is seen significantly less often in upstream inhibitors when all targeted pathways are
inactive. C3 and C4 inhibitors do not follow this trend because only a very small fraction of the ensemble predicts efficacy due to their significant underdosage (see Figure 2.3).
U, V 0 Cn 0 C 0. UL.
2.5.4 Worst cases for inhibitors
It was possible that parameter sets exist outside the ensemble that predict negative responses to the inhibitors. To study the most adverse reactions to the inhibitors, we searched for feasible parameter sets predicting the worst possible response to each inhibitor. To find these parameter sets, we solved a nonlinear constrained optimization problem: maximize the one-week
normalized SOFA score by changing the model parameters, constrained to parameter values that adequately fit the experimental data and that predict reasonable levels of complement proteins. To sample a diversity of possibilities and avoid convergence to local minima, we solved the optimization problem for ten distinct sets of initial parameter values per inhibitor. We found that all but the C5 and C5aR inhibitors increase the post-treatment SOFA score in their worst cases.
By studying the most adverse cases, we discovered two possible scenarios in which inhibitors
worsen disease. In the first scenario, inhibition of one species results in accumulation of another species normally consumed by activation. Target breakthrough eventually occurs, and the free target levels recover before the accumulated species concentration depletes, driving a temporary burst of complement activation. We identified at least one parameter set predicting this behavior (as defined by species accumulation followed by target breakthrough and a rise in the normalized
SOFA score) for all but the C5, C5a, and C5aR inhibitors. The accumulating species may or may
not be in the same pathway as the inhibitor target, indicating that inhibition of one pathway can affect activation in non-targeted pathways. C5 is one of the accumulating species for every inhibitor, indicating a potential weakness of targeting upstream pathways.
In the second scenario, inhibition of a slow pathway that outcompetes a faster pathway for a limiting resource increases overall activation. This scenario was observed for inhibition of Factor B or D of the alternative pathway. In these cases, the slower pathway is the alternative pathway,
and the limiting resource is C3b. The alternative and classical/lectin C3 convertases compete to bind C3b to convert to C5 convertases. Alternative pathway blockade increases C3b's
concentration because the alternative C3 convertase no longer binds up substantial amounts of
C3b. The increased C3b concentration drives an increase in the classical/lectin C5 convertase
concentration, which more than compensates for the loss of the alternative pathway because the classical/lectin C5 convertase has a larger kca and/or smaller KM. Unlike in the first scenario, there is no initial period of drug efficacy; the SOFA score immediately rises in response to the inhibitor.
2.5.5 Combination therapies
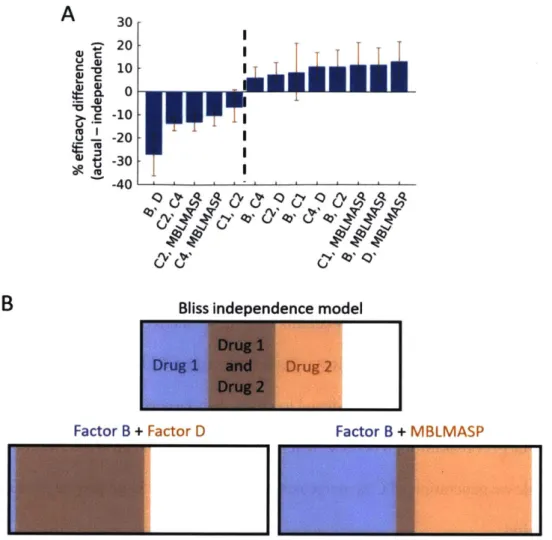
Combination therapies may enable efficacy for inhibitors that elicit a weak response when dosed individually. To find effective combination therapies, we simulated all 45 combinations of two inhibitors across the ensemble. We simulated one pair of doses per ensemble member, randomly selecting each dose from the range of single-inhibitor doses eliciting 10 to 90 percent of the maximum inhibitor response. One set of reasonable pharmacokinetic parameters was used for all simulations. Examining the responses, we found that combinations of inhibitors at high doses targeting separate pathways tend to perform better than expected from independent action, while combinations targeting the same pathway perform worse (see Figure 2.5A). This effect can be explained by the fact that different ensemble members predict different pathways to be active (as shown in Figure 2.8). Targeting different pathways successfully treats different
subpopulations sharing few members, while targeting the same pathway redundantly treats the same subpopulation. This concept is visualized in Figure 2.5B.
A
30 20 G i -0 10 C 0 -10 3 -20 t -30 -40B
- -IBliss independence model
Drug 1
Drug 1 and
Drug 2
Factor B + Factor D Factor B + MBLMASP
Figure 2.5. Statistical benefit of combination therapies targeting different upstream pathways. (A) Difference between the actual and Bliss independence estimate of the fraction of the ensemble responding to combinations of inhibitors at high doses. Inhibitor combinations are shown on the horizontal axis, and the difference between the actual percentage of models predicting efficacy and the independent estimate of the percentage is shown on the vertical axis (with larger values indicating more efficacy than the independent assumption). Combinations to the left of the dashed line target at least one upstream pathway in common and perform worse than expected, while combinations to the right target different upstream pathways and perform better. (B) Visualization of how ensemble member subpopulations can cause differences between the independent estimate and actual values of drug efficacy. Colors indicate the proportion of the ensemble responding to each inhibitor alone, with the overlapped region indicating those ensemble members predicting efficacy for either drug. When two inhibitors target the same pathway (such as Factor B and D inhibitors, shown on the left), the inhibitors show efficacy (and fail to show efficacy in) the same ensemble members, and the combination therapy fails to show much additional effect. When two inhibitors target different upstream pathways (such as Factor B and MBLMASP inhibitors, shown on the right), the inhibitors show efficacy in different ensemble members, and the combined effect shows efficacy in nearly the entire ensemble.
I-To identify other explanations for inhibitor interaction, we searched for pair dose amounts that result in a greater reduction in SOFA score than expected from the separate independent action of the two inhibitors. To perform the search, we performed nonlinear optimization,
searching for the pair of dose amounts that minimizes or maximizes the difference between the observed normalized SOFA score and the independent normalized SOFA score as calculated by the Bliss independence model.
We discovered that many upstream inhibitors show efficacy when paired with C5a inhibitor, even if neither single inhibitor shows efficacy alone. The explanation is that upstream inhibitors slow generation of a downstream target (in this case, C5a) and reduce the amount of the
downstream inhibitor needed to cover its target. In the cases we identified, neither the upstream drug nor C5a inhibitor are sufficiently dosed to cover their targets, and when they are dosed individually, target breakthrough occurs. When dosed together, the upstream inhibitor
temporarily slows generation of C5a, decreasing the amount of C5a generated over the one-week treatment period.
2.6 Conclusions
The hypothetical inhibitor simulations across the uncertainty ensemble predict a diversity of responses of disease to inhibition. The degree of response depends largely on two conditions: (1) the amount of target must be comparable or less than the amount of drug, and (2) the targeted pathway must be active. There are exceptions to these general rules, however, as the worst-case responses demonstrate. Pathway inhibition can cause accumulation of complement proteins that depend on pathway activation for clearance, and the accumulated proteins can cause a burst of complement activation if target breakthrough occurs. Also, inhibition of a slow pathway that outcompetes a faster pathway for a shared resource can increase overall activation.