COMFORTCHOICE: BRINGING VALUE TO THE VALUE CHAIN
by
Rasheed El-Moslimany
M.E. Civil Engineering, Texas A&M University, 1994 B.S. Ocean Engineering, U.S. Naval Academy, 1988 Submitted to the Sloan School of Management and the
Department of Mechanical Engineering
In Partial Fulfillment of the Requirements for the Degrees of Master of Science in Management and
Master of Science in Mechanical Engineering
In conjunction with the Leaders for Manufacturing Program at the Massachusetts Institute of Technology
May 2002
C Massachusetts Institute of Technology, 2002. All rights reserved. Signature of Author
Sloan School of Management Departmppt of Mechanical Engineering May 10, 2002 Certified by
John R. Hauser Kirin Professor of Marketing, Sloan School of Management
Thesis Supervisor
Certified by
iTimothy
G. Gutowski Professor, Mechanical Engineering . Thesis Supervisor Accepted by
Margaret C. Andrews Director of Master's Program Sloan School of Management Accepted by
Ain A. Sonin Chairman, Department Committee on Graduate Students MASSACHUSETTS INSTITUTE Department of Mechanical Engineering
OF TECHNOLOGY
COMFORTCHOICE: BRINGING VALUE TO THE VALUE CHAIN
by
Rasheed El-Moslimany
Submitted to the Sloan School of Management and the Department of Mechanical Engineering on May 10, 2002 In Partial Fulfillment of the Requirements for the Degrees of
Master of Science in Management and Master of Science in Mechanical Engineering
ABSTRACT
The Carrier Electronics division of Carrier Corporation entered the residential electricity demand management market in 2000 with a product called ComfortChoice. Carrier
Electronics' entry into the electricity demand management market is drastically changing the way that Carrier does business with their customers. Carrier is a company that relies on its extensive network of distributors and dealers for sales, installation, and customer service. The new product is changing Carrier's role within the value chain. With previous products, Carrier's primary role ended when the product was shipped from the factory to the
distributor. ComfortChoice is a product developed for a large utility that is installed in thousands of their customers' homes. In order for ComfortChoice to provide value to the utility, it is necessary to ship the product, install it in the utility customer's home, register on a web-enabled database, and ensure it communicates properly in a two -way wireless system. The rollout of this product caused several new challenges for Carrier. It is important to understand the impact of ComfortChoice on Carrier's value chain. It is also critical to understand the utility's value chain and the role that ComfortChoice plays in matching their supply and demand and to determine how Carrier can provide more value to the utility. Carrier needs to determine how the financial and environmental impact of ComfortChoice compares with other sources of distributed power and peak power generation for demand matching. They also need to maximize the product effectiveness through providing greater value to the utility and their customers.
Thesis Supervisors:
John R. Hauser, Kirin Professor of Marketing, Sloan School of Management Timothy G. Gutowski, Professor, Mechanical Engineering
ACKNOWLEDGEMENTS
I would like to acknowledge the gracious and generous assistance and guidance offered by the employees of Carrier Corporation. Special thanks go Ceil Dechaine and Ken Fox.
Additionally, I thank Raymond Archacki and Lauren Kolb, the project sponsors at Carrier, for their unwavering support and guidance, and my academic advisors at MIT, Timothy Gutowski and John Hauser for their outstanding support and technical insights. I would also like to thank Don Rosenfield and the entire LFM staff for allowing m e the opportunity to become a member of the LFM community and for their continued support during the program.
Finally, I would like to thank my wife Waisang, and my kids, Aisha and Amira, for their never-ending support and patience over the past two years.
TABLE OF CONTENTS A B ST R A C T ... 2 ACKNOWLEDGEMENTS... 3 TABLE O F CONTENTS... 4 TABLE O F FIGURES ... 6 1 IN TRO DUCTION ... 7
1.1 POWER CRISIS BACKGROUND ---... 7
1.2 CARRIER BACKGROUND---... ---... 8
1.3 COMFORTCHOICE BACKGROUND... ---... 8
1.3.1 Benefits of ComfortChoice ... 10
1.3.2 Comparison of One-Way and Two-Way Demand Management Systems .1] 1.4 TH-ESIS OBJECTIVE....-....- - - - -... - -... 12
2 CARRIER VALUE CHAIN ANALYSIS ... 14
2.1 COMFORTCH JOICE VALUE CHAIN -.---... -... 15
3 UTILITY INDUSTRY ... 19
3 .1 H IS T O R Y ... . 1 9 3.1.1 Investor O w ned U tilities... 19
3.1.2 M unicip al U tilities ... 21
3.1.3 F ed era l P ow er ... 2 1 3.2 Ct JRRENT 'NDUSTRY STRUCTURE---. .---... 22
3.3 C1 JRRENT INDUSTRY TRENDS.--... . ---...---... 24
3.3.1 Deregulation in the Power Industry ... 24
3. 3.2 Pow er G eneration Capacity ... 29
3.4 MODELING ENERGY SUPPLY~DEMAND CYCLES----... ---...-- - - 30
4 THE ROLE OF COMFORTCHOICE IN THE POWER INDUSTRY... 34
4.1 PEAK GENERATION...---.---..--... 34
4.1.1 ISO New England Load Profile ... 36
4.2 TRANSM ISSION ---... 39
4.3 DISTRIBUTED GENERATION ... ---.--..- - ---... 43
4.4 LOAD MANAGEMENT PEAK SHAVING.--... -... 46
4.5 GREEN POWER ... --....-.-.---..-...--....-... 48
4.5.1 Life Cycle Analysis Background ... 52
4.5.2 C omfortC hoice Impact ... 55
5 POWER SAVINGS FROM COMFORTCHOICE... 60
5.1 MODELING COST SAVINGS FROM NEW ORK -... . . . .-------. 60
6 PRODUCT AND PROCESS DESIGN ... 68
6.1 DESIGNING FOR THE CUSTOMER---... ---... 68
6.1.1 ComfortChoice Designfor the Customer... 70
6.2 QUALITY --- ..- .. - - -- -- - -- --... 75
6.2.1 Carrier's Approach to Installation Quality... 80
6.3 PRODUCT ARCHITECTURE.---... 81
6.3.1 Existing ComfortChoice Product Architecture... 82
6.3.2 M odified Two-Piece Architecture... 85
6.3.3 A ll-In-O ne A rchitecture... 86
7 CONCLUSIONS AND FUTURE WORK... 88
7.1 CONCLUSIONS....---.. ---... 88
7 .2 F , JTU P E W O J ..J ... 89
TABLE OF FIGURES
Figure 1. Typical Carrier Thermostat Value Chain... 14
Figure 2. ComfortChoice Manufacturing and Installation Value Chain ... 15
Figure 3. ComfortChoice Operation System Value Chain ... 18
Figure 4. Current Supply Chain Map of Power Industry ... 23
Figure 5. H istorical Integration M ap ... 25
Figure 6. Integration Trends Map Under Deregulation ... 26
Figure 7. Generation Profile for Typical Summer Loads (the C Three Group) ... 35
Figure 8. 2001 ISO New England Demand Load... 36
Figure 9. ISO New England Demand Load 6 to 9 August 2001 ... 37
Figure 10. ISO New England, Required Generation Hours for Generation Loads ... 38
Figure 11. Effect of Outdoor Temperature on Kilowatt -hour Savings... 61
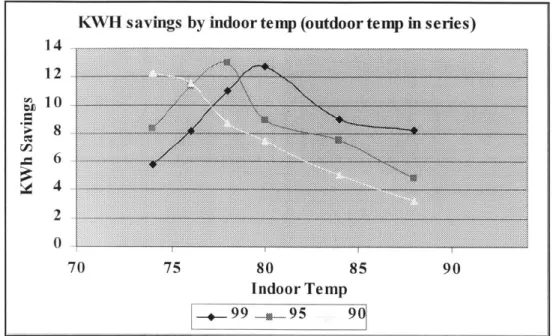
Figure 12. Effect of Outdoor and Indoor Temperature on Kilowatt -hour Savings ... 63
Figure 13. Long Island Summer 2001 Maximum Temperatures ... 64
Figure 14. Frequency of Maximum Temperature, Long Island Summer 2001 ... 65
Figure 15. Predicted Kilowatt-hour saving vs. Days of Curtailment ... 66
Figure 16. Cost Comparison of ComfortChoice vs. Hours of Operation ... 67
Figure 17. ComfortChoice Product Architecture Schematic ... 82
Figure 18. Existing Com fortChoice Architecture ... 83
Figure 19. ComfortChoice Modified Two-Piece Architecture ... 86
INTRODUCTION
1.1 POWER CRISIS BACKGROUND
On August 4, 2000, after running for several days without maintenance in order to meet demand, two plants in Southern California failed. This incident caused a Stage 1 emergency as the power reserves fell below 7%. Businesses were asked to turn off their power and homeowners were asked to conserve electricity to prevent power losses region wide. Power shortages have also recently forced blackouts in Delaware, New York, and Arkansas. Growth, particularly in the Silicon Valley has rapidly increased demand for
electricity, creating a disparity between supply and demand.
In the 1970's large coal and nuclear power plants were added to a highly regulated utility system creating a glut of capacity. State regulators prevented utilities fiom passing off the cost of unused capacity to customers. This acted as a disincentive to utility
companies to construct new plants. Over the next twenty years, construction growth of power plants slowed as demand continued to rapidly increase. After Congress passed the
Energy Policy Act in 1992, with uncertainty of deregulation looming on the horizon, utilities further slowed the construction of new power generation facilities (Roberts 2000). The utility companies did not want to build generation facilities that they would then have to sell off under deregulation. Independent power generators faced the same uncertainty and did not want to risk investing in a plant for an electrical system with
uncertain returns. This has reduced the available reserve capacity from 30 per cent to less than 10 per cent in some regions (Ilic 2000).
1.2 CARRIER BACKGROUND
From the time Willis Carrier invented the basics of modern air conditioning in 1902, Carrier has been the world leader in the manufacture and sale of heating, ventilating, air conditioning (HVAC), systems and products. Carrier is headquartered in Farmington, Connecticut USA, with over 45,000 employees in over 171 countries. Carrier combines its global HVAC and refrigeration expertise with the responsiveness of its local
operations to lead nearly every geographic market. Carrier has a worldwide network of hundreds of distributors and thousands of dealers, who sell, install and service Carrier products in 171 countries. Carrier products are designed in nearly 20 key engineering centers and manufactured in 108 plants spread across six continents. Product lines
include air handling units, compressors, condensers, unitary packaged and split system air conditioners, transport and commercial refrigeration equipment, room air conditioners, packaged terminal air conditioners, central station air conditioners, hermetic absorption and centrifugal water chillers, open drive centrifugal chillers, hermetic screw chillers, reciprocating air and water cooled chillers, dehumidifiers, single packaged and split system heat pumps, electronic control systems and air cleaners. Carrier's climate control systems are trusted to protect the Sistine Chapel, historic documents at the Library of Congress, and the Rock and Roll Hall of Fame & Museum.
1.3 COMFORTCHOICE BACKGROUND
The demand for energy has outpaced supply over the past five years. The delays in building new power plants require that utilities use demand management systems to manage the energy demand. As both the price of and demand for energy contin ue to fluctuate in today's marketplace, the ability to manage energy consumption in real -time
terms has become more critical than ever. ComfortChoice enables energy providers to manage their residential and light commercial customers' energy demands by adj usting thermostat settings wirelessly. These adjustments, usually made during peak demand periods, reduce the frequency of operation for heating and cooling units, thereby reducing energy consumption during that period.
Carrier along with Silicon Energy has developed ComfortChoice. ComfortChoice is an Internet-based demand side management solution for energy providers. The solution allows the energy providers to reduce energy requirements in residential and light commercial businesses. Volatile energy prices are driving the demand for small
customer load management. It is designed for energy providers that want to ensure high system reliability and manage energy purchases against wholesale energy prices.
Comfort Choice is comprised of
. Carrier's EMi (pronounced "emmy", acronym for Energy Management Interface), which consists of a 7-day programmable thermostat, connected to a controller module with integrated 2-way, wireless communications hardware.
. Carrier's remote user interface software, which enables end-user web-based access to the EMi.
. Silicon Energy's Web-based load curtailment software, which allows an energy provider to schedule and initiate curtailments.
Energy providers use ComfortChoice software to communicate over the Internet with Carrier thermostats installed in customer's homes to adjust temperature setting during peak demand periods to reduce energy usage. Customers can also use the web to check the temperature in their home, adjust controls and temperature settings and program the thermostat.
1.3.1 Benefits of ComfortChoice
ComfortChoice provides many benefits for the utility. It provides enhanced homeowner benefits, which lead to greater acceptance and participation in demand management programs. It allows Internet-based control of HVAC equipment, which is the primary
energy-consuming device in homes. The link to the web-based user interface can reside on the energy provider's home page, increasing consumer traffic to the provider's home page. It allows for reduced energy purchases during peak demand with less production requirements and fewer emissions. It permits the deferment of investment in generation, transmission and distribution system capacity upgrades in constrained areas. It provides co-branding opportunities including customized web page. ComfortChoice provides the
utility with built in safeguards that prevent homes from exceeding preset maximum temperatures in the summer and minimum temperatures in the winter.
ComfortChoice also provides several benefits to the homeowner where the unit is installed. Its remote web access allows homeowners to program the thermostat online, check and change thermostat settings, and ensure proper temperature on arrival at home. It provides customers with a programmable thermostat. Programming can lower year
round energy usage by 15-25% from less usage during unoccupied periods. The utility consumers receive a product that can be used year round. They retain the flexibility to override curtailments.
1.3.2 Comparison of One-Way and Two-Way Demand
Management Systems
ComfortChoice is an innovative product in the residential demand management market. The greatest innovation is the low cost two-way communication system, which provides substantial technical benefits over existing one-way systems in the market for the utility company.
1.3.2.1 Existing One-Way Systems
There are several one-way systems that are already in place. The systems are usually attached to the customer's HIVAC control unit and shut down the compressor for the duration of the setback. These units pose several problems for the utility companies. The one-way systems shut the air conditioning or heating without notice to the customers. The utility customers often aren't sure if the power company has shut down the unit or if they have a problem with their HVAC unit. The customers come up with innovative ways to override the system. The antennas are often removed or covered with foil. The utility is never sure of the impact of the energy curtailment efforts. After the initial installation, the utility has no way of knowing if the unit is still functioning. They cannot track damaged units or units that have been altered by customers.
1.3.2.2 ComfortChoice Two-Way System
ComfortChoice offers a two-way system that provides improved feedback and
functionality. ComfortChoice's two-way coverage offers several benefits over one-way coverage. The utility knows the performance of the curtailment based on the response from units to the initial message. The units respond to the curtailment with the current household temperature. The units send a weekly "heartbeat" that allows the utility to
monitor the performance of the system and investigate units that are not performing. The system allows customers to override the curtailment and provides instant feedback to the utility on the override percentage. The utility can get weekly actual run time information from the consumers to more accurately predict the impact of curtailments.
1.4 THESIS OBJECTIVE
The objective of this thesis is to develop an understanding of the value that
ComfortChoice brings to the utility and to develop a structure for improving the value for the utilities. In order to understand the value that ComfortChoice brings, it is essential to understand the utility industry. This thesis provides a thorough review of the power industry and will determine where ComfortChoice fits within the industry structure so that value of ComfortChoice can be better determined. It will look at the growing
distributed generation market, which provides the closest competition to ComfortChoice.
The thesis will also determine the financial impact that ComfortChoice has on the utilities in both direct and indirect costs. It will look at ways that this value can be improved through design, quality, product development and other issues. ComfortChoice has been marketed as an environmentally beneficial product. This thesis will examine the
environmental impacts of implementing ComfortChoice to provide hard data to back up the marketing claims.
The thesis format will first look at the value chains for Carrier and ComfortChoice. Then it will focus on the utility industiy to gain a better understanding of how ComfortChoice fits in the utility market. Then the ComfortChoice product will be examined to determine how additional value can be added to the product through design, quality monitoring,
2 CARRIER VALUE CHAIN ANALYSIS
Since the development of the Air Conditioner by Willis Carrier in 1902, Carrier has been and industry leader in HVAC manufacturing and distribution. In the residential
electronics field, Carrier has relied on its extensive network of distributors and dealers to get thermostats to the market. Figure 1 shows the Carrier Value Chain for residential thermostats.
[
h ta I Design and Components Pam mng Thermostat Manufacturing Distributor E Dealer I CustomerFigure 1. Typical Carrier Thermostat Value Chain
Carrier designs and develops the programs for the thermostat. The thermostat has increasingly included more electronic content including processors and embedded programming. The components also include plastic injection molded parts, relays and
surface mounted electronic devices. The thermostat is manufactured by Carrier and shipped to distributors who work directly with Carrier's independent dealers. Carrier primarily focuses on design manufacturing and distribution. The majority of the
customer contact is through installation and service by the dealer network. With this value chain, Carrier receives the most value from shipping quality products to the distributors.
2.1 COMFORTCHOICE VALUE CHAIN
The ComfortChoice value chain is more complex. There are two value chains. The first is the installation chain. The installation value chain, shown in figure 2, is similar to the value chain for Carrier thermostats. The thermostat requires design, components and
Thermostat Components
User web page Design and
development programming
I
ComfortChoice ManufacturingInsller
Utility
customers
Figure 2. ComfortChoice Manufacturing and Installation Value Chain
programming. The thermostat is also installed in utility customers homes. However there are significant differences. The largest difference is the relationship with the residential customer. With ComfortChoice, the utility customer is now dealing with an installer hired by the utility instead of the customer. The installer is working on a
one-to-many relationship instead of providing a one-to-one focus. The programming becomes more critical as the complexity of the thermostat increases. The product changes are made by programming as much as changing components makes them.
The installer has incentives to please the customer who is paying their bills, and in this case it is the utility. This causes a change in the installer's focus from the residential customer to the utility. The utility may have different goals than their customers. The utility wants to keep their customers happy or else they will not participate in the program. They also need to ensure that their customer service meets levels that are required by the utility regulators. But they also want the installer to maximize the number of installations per day to save them money and to get the full benefits of the system. The utility must adequately balance maintaining their customer's and the utility regulator's satisfaction with keeping the program cost effective.
The components in the ComfortChoice product are more complex than regular
thermostats. ComfortChoice has a communications module that has to be able to speak to the thermostat. This places a much greater emphasis on the programming of the thermostat. Programming is essential to initial thermostat setup and subsequent quality control measures. As this is a new product, the major product improvements are coming from improving the logic embedded in the program. New releases in programs cause conflict between manufacturing and service. Manufacturing, based on their existing value chain and strategy, is focused on getting high quality products to the distributors. ComfortChoice on the other hand wants the products to have improved service
performance. This requires that the programs have the latest programs. It is perfectly understandable that the manufacturing division's values are based on the existing value chain.
ComfortChoice requires a complete change in company values. While each of the individual thermostats may work perfectly, they are part of a larger system, which needs to be considered when manufacturing decisions are made. Increased manufacturing costs may allow for a much lower cost in system operations. The evolution of the value chain demands that the costs are examined from a system perspective. However
manufacturing is making decisions based on the existing value chain.
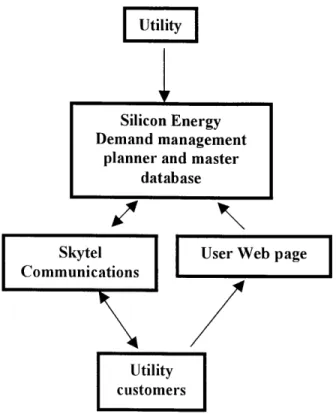
ComfortChoice is an operational system that relies on the communication of data to function properly. The thermostat may work perfectly for the utility's customer but may be useless to the utility if the ComfortChoice system does not work properly. The system requires an understanding of the utility company's controls. For ComfortChoice their partner Silicon Energy provides this link. Silicon Energy Corporation has built their reputation in the utility industry as a provider of enterprise energy management software
solutions, which enable interaction between energy providers and energy users to reduce energy usage, lower energy costs, and optimize energy procurement processes. Silicon Energy provides software modules that integrate multiple, geographically dispersed
Utility
Silicon Energy Demand management
planner and master database
Skytel ser Web page
Communications
I
LIUtility customers
Figure 3. ComfortChoice Operation System Value Chain
energy management systems and equipment into an enterprise-wide network. This allows real-time analysis and intelligent control over enterprise-wide energy usage, as well as comprehensive reporting and monitoring capabilities. Partnering with a company with real world, power management experience is important to gain product credibility within the conservative utility industry.
Skytel provides the two-way communications capability. Skytel Telemetry Services is a division within WorldCom, which works with developers and end users to implement wireless data communications solutions. The device used to monitor and transmit remote data to the customer is the CreataLink2 XT, a generic wireless data transceiver designed with a partnership with Motorola. The two-way interactivity utilizes a licensed broadcast frequency enabling the customer to obtain superior information.
3 UTILITY INDUSTRY
The energy crisis in California left consumers across the nation concerned about the availability and prices of electric power. Significant industry changes are underway, introduced by deregulation measures being undertaken in various degrees by half of the United States. This chapter addresses some key questions being asked by consumers, government regulators, and participants in the electric power generation value chain alike.
* What are the trends in the industry structure?
* How is deregulation affecting the value chain and industry structure? * Who will have power in the emergent value chain?
" How can capacity and the resultant price volatility historically experienced in the
electric power industry be avoided?
3.1 HISTORY
In 1882, Thomas Alva Edison changed modern history when he lit up Pearl Street in New York City serving 85 customers. From those humble beginnings, the power industry has grown into a network of investor owned, public power, and rural cooperative utilities (Kufdahl 2000).
3.1.1 Investor Owned Utilities
The power industry grew rapidly through entrepreneurs investing in Investor Owned Utilities (IOU). Small IOUs were developed scattered across high-density areas serving the immediate neighborhoods. The small size of the utilities created diseconomies of
scale. Electricity was expensive, reliability was low, and the IOUs were losing money. Neighborhoods were crisscrossed with wires from competing utility companies. Lower cost municipal systems grew rapidly. IOUs responded to the threat of competition from municipal utilities by appealing to the federal government for help. In 1907, the
government granted exclusive franchises to the IOUs in exchange for regulation of the rates (Hazan 2000).
Acquiring franchises required a change in thinking and sometimes under-the-table persuasion of decision makers. Sam Insull, Edison's former secretary and financial advisor, was an innovative thinker and one of the best negotiators. While most utilities chose to offer their product at a premium price, he believed that the utilities would succeed by leveraging their monopoly power to offer greater economies of scale and lower prices. He was able to gain a diversity of demand that allowed him to fully use the company's generating assets. Utilities began to consolidate adjacent franchises into larger systems. By the end of the 1920's 16 utility companies controlled 85% of the power in the US (Kufdahl 2000).
As the utilities consolidated, the power supply was still unreliable and planning was limited. There was a strong need to develop consumer confidence in privately owned utilities. Insull's greatest contribution to the power industry came when he recognized that utilities needed to conduct long range planning in order to develop a reliable infrastructure. He proposed that the states begin to regulate the performance standards and set rates to allow for infrastructure development. The state agencies promulgated
strict service standards and required utility companies to reliably meet customer demand by building plants on time. In return, the IOUs were allowed a reasonable rate of return on their investment (Kufdahl 2000).
In California, the Mt. Whitney Power Company developed two hydroelectric power plants, which provided power for the irrigation of the San Joaquin Valley. The Nevada Power & Milling Company constructed hydroelectric plants in Nevada. In 1913, the Pacific Light & Power Company built two hydroelectric power plants. These electric companies eventually became PG&E (Kufdahl 2000).
3.1.2 Municipal Utilities
Municipal utilities have been in existence since the beginning of electrical generation. Many of the utilities started by buying their power from Investor Owned Utilities. Those municipal utilities that generated their own power were isolated from a larger power system because they were afraid that they would be taken over by the IOUs if they became connected. In the 1930's the municipal utilities realized the benefits of combining resources and started to connect into the electrical grid (Kufdahl 2000).
3.1.3 Federal Power
The federal government became an important player in the utility industry through providing low cost loans to municipal utilities, the establishment of the Rural
Electrification Administration, and the construction of power generating utilities. Rural electrification created the massive hydroelectric projects in the Tennessee Valley Authority and Washington's Bonneville Power Administration. These projects were
often located hundreds of miles from the power customers. The federal government and utilities constructed long distance lines to bring the power to the customer. The industry realized that by interconnecting lines they could rely on the differences in variability between systems to allow generators to share the demand risk. The government was instrumental in establishing today's interconnected power grids (Steufen 1999).
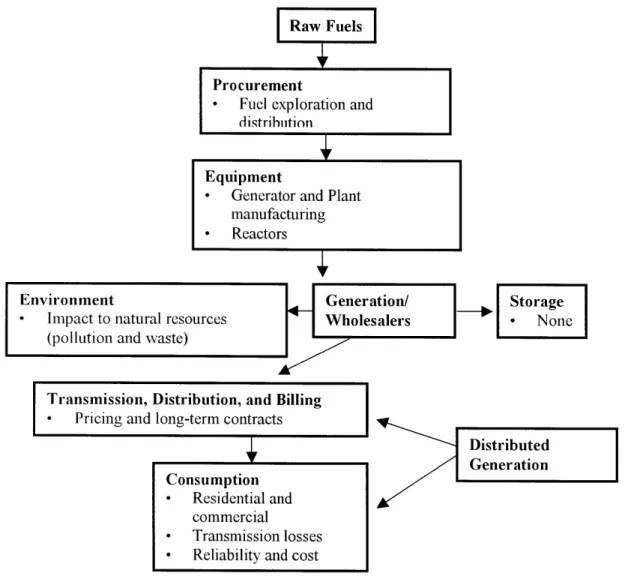
3.2 CURRENT INDUSTRY STRUCTURE
Figure 4 illustrates the supply chain map of the current electric power industry in California. The value chain begins with raw fuels such as oil, coal and natural gas. These fuels must then be harnessed, extracted and distributed to the power generators. Power generation equipment such as gas turbines is another important input in the process. Power generators produce the electricity for distribution to consumers. Wholesalers, who are often also power generators, purchase the power and sell it to utilities and their customers. Utility companies manage the power transmission,
distribution, and billing to industrial and residential consumers. Historically utilities have had long-term contracts with wholesalers, promising to purchase a certain amount of electricity each year. The contracts give the wholesalers sufficient confidence to make the huge capital investments in power generation plants and equipment required to increase capacity.
One of the peripheral items in Figure 4 is the environmental impact of power generation, such as pollution and waste. Another is storage of electricity, for which there is currently no means. Since energy cannot be stored or "kept in inventory" to cover peak usage, power generators must have sufficient generation capacity to meet peak demand and
simply not use this capacity when it is not needed. Finally, distributed generation is included in the value chain. Distributed generation, which will be discussed in detail later in this paper, includes independent power generation at the consumer level and the practice of consumers "selling back" unneeded power to the utilities.
Raw Fuels
|Procurement
Fuel exploration and
distribution
Equipment
- Generator and Plant manufacturing - Reactors
Environment
- Impact to natural resources (pollution and waste)
Transmission, Distribution, and Billing - Pricing and long-term contracts
ration/ Storage
[esalers - None
Distributed Generation
Figure 4. Current Supply Chain Map of Power Industry
Who is extracting rents in this value chain? High fuel prices and control of both the exploration and the distribution system ensure that the providers of fuel make the greatest profits today. A lack of power generation capacity gives some power to wholesalers, but long-term contracts with utilities prevent prices from getting too high. Wholesalers have
Consumption
- Residential and commercial
- Transmission losses - Reliability and cost
raised prices significantly as demand has outstripped supply while consolidating their power generation holdings through acquisitions, securing high profits for themselves. At the same time, utilities are being pressured by consumers and regulated by government agencies to maintain or reduce prices. The government has sometimes stepped in and placed price caps on retail electricity which in the short run correct the pricing problem but create disincentives for further capacity investments. The following sections will discuss the significant changes, the industry is undergoing in both structure and market power. Deregulation and the resultant privatization will impact the industry in the future.
3.3 CURRENT INDUSTRY TRENDS
After more than 50 years with little changes within the industry structure the past three years have seen the rate of change within the power industry skyrocket. New companies like Enron experienced rapid growth with innovative models and rapid failures. Two California utility companies filed for bankruptcy, almost unheard of prior to the deregulation.
3.3.1 Deregulation in the Power Industry
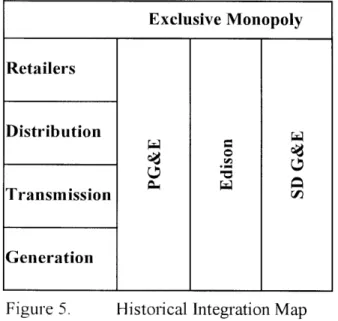
As discussed above, the United States' power system was developed to maintain a fair rate structure for the monopoly power provider. The utility company managed a
vertically integrated value chain from power generation to distribution and billing. Even with oversight fiom public utility commissions, the regulated power industry had a significant disparity between prices from one utility to another. Rates varied by as much as 1000%0 between regions as some utility companies made good economic decisions while others struggled to recoup losses from their investments in failed nuclear power
plants. As the power system has grown, these smaller systems became interconnected into a nation wide grid that allowed the individual power companies to share reserve capacity across long distances (Ilic 2000). Under the regulated utility system, utilities and their regulators were responsible for maintaining a reliable power system. The companies were able to meet their obligations by sharing power resources to maintain a reserve capacity of 25 per cent more than peak demand. This was to cover contingencies including high temperatures, equipment failures, and unscheduled outages.
Exclusive Monopoly
Retailers
Distribution
Transmission
Generation
Figure 5. Historical Integration Map
Deregulation of the power industry was introduced to encourage competition and
ultimately lower rates. The power industry has been deregulated in 15 states and 9 other states have deregulation legislation pending. Deregulated utility companies still sell electricity to customers but are no longer allowed to own certain power plants. As deregulation has been implemented, a new market place has been opened to independent power producers.
Deregulation
Retailers
PG&E Edison SDG&E
Distribution
Transmission CAL ISO
Power CAL ISO
Exchange
Generation PG&E Edison SDG&E Reliant El Paso Figure 6. Integration Trends Map Under Deregulation
Deregulation permits electricity customers to choose their power supplier, requiring electric utilities to transport it. The traditional integrated electric utility is splitting into new autonomous industry affiliates, which may share the same parent, but now have
distinct interests (Griffin, J. 1999). The deregulation is occurring in stages. During the transition period, which ranges from 5 to 10 years, the electricity rates are frozen to allow the utility to recover stranded costs (the difference between the book value and the
market value) (Steufen 1999). Deregulation has forced the utility companies to split into separate functions including wholesale power generation, high voltage transmission, and local distribution and retail. Additionally, deregulation has required the development of a power exchange to provide a marketplace for buyers and sellers (Steufen 1999).
In the generation function, extremely high voltages are generated at central stations and distributed locations. With deregulation and increasing demand, a new industry of independent producers and wholesalers has developed. These producers have been buying plants as deregulated utilities have been forced to sell their power generation
generation on a smaller scale. Smaller gas turbine plants are opening the market to non-utility generators. These smaller plants have shorter construction cycles and reduced capital costs (Griffin 1999). The independent producers compete to sell their generated power through wholesale power trading markets or power exchanges. This system is designed to provide all the advantages and disadvantages of a free market (Roberts 2000). California also obtains power from several other states through the regional grid. For example, utilities in Washington State sell power generated from their hydroelectric facilities to California.
Power exchanges are the newest market players. Exchanges have been set up to provide a market place for generators and wholesalers to sell their power to retail utilities. The development of these power exchanges has paralleled the development of other B2B Internet marketplaces. The California Power Exchange (CalPX) was established by the State of California to manage the purchases between the generators, wholesalers, and retailers. It was designed to charge customers transaction fees to cover operating expenses. In order to provide market transparency, the state required that all electricity purchases be made through CaIPX. Investor Owned Utilities were not allowed to enter into the traditional long-term agreements.
The transmission phase of utility transmits high voltage electricity produced by the generators to the locations of electricity users (Griffin 1999). FERC has proposed that
utilities turn over their transmissions systems to a regional transmission operator. There is still no federal requirement that transmission operators be completely independent of utilities (Roberts 2000). This creates a potential conflict of interest as the transmission
owners could play favorites with wholesalers. Annual investment in transmission
capacity has declined by 15 per cent. When the industry was regulated, transmission and generation capacity were jointly planned. This joint planning reduced the need for additional generation by sharing information on generation, reserve capacity, and maintenance. Under the new deregulated system, sharing this information could be considered collusion under antitrust laws (Griffin 1999). When the industry was regulated, utilities set transmission rates artificially low in order to sell their generation capacity to non-local users (Ilic 2000).
Overcoming transmission constraints are critical to the success of deregulation. The transmission system is the weakest link in the deregulation system. Transmission lines are designed with built-in redundancy to prevent outages if a major line fails. This function needs to be included in any system charges to make the transmission business viable (Ilic 2000). While interregional purchases by investor owned utilities have increased, insufficient transmission capacity is confining wholesale power distribution to a regional level. Transmission lends itself to a regulated monopoly structure (Steufen
1999). California Independent System Operator (ISO) was established by the state to manage the transmission under the deregulated system. The transmission system will be further explored in the next chapter.
The distribution function converts the high voltage electricity to the lower voltages required by retail customers. As in transmission, the requirements of distribution lend itself to a regulated monopoly structure. In California, the utilities control the
purchases wholesale power from the generators through a power exchange. The power is transmitted to the local distribution area where the electricity is supplied to the customer. The retailer is then responsible for billing the customer (Griffin 1999).
3.3.2 Power Generation Capacity
A large driver of the industry's volatility revolves around the issue of capacity. Here, capacity is analyzed only to understand, generally, the forecasts for energy needs, what levels of growth are planned, and how that growth will be achieved. Each of these has implications on the environment and pricing.
Although it accounts for only 4% of the world's population, the US consumes 3,235 billion kilowatt-hours, or approximately a fourth of the total world power needs. The power is delivered through three major grids, specifically the Eastern, Texan, and Western grids. Each has distinct capacity and growth demands and various levels of investment in future capacity. The Western grid, specifically the sub-grid that serves California, has been severely taxed over the last year and serves as an excellent example of the dynamic nature of capacity coupled with regulation, supply chain power, and volatility of a non-diversified fuel base.
Growth in US power supply needs is expected to slow due to slower growth in population and economic activity, market saturation and efficiency gains in some electronic
appliances. One MW of generation capacity powers approximately 1000 homes. Current capacity margins to capacity needs reside at about 15%. The obvious solution to
experience has created painful system dynamic behaviors in how capacity and demand are matched. At a gross level of analysis, we can evaluate what margins or excess capacity is in place to meet demand. Historically, 1978 to 1992, margin capacity hung around 30%. Since deregulation, margins have dipped to about 15%. The slimmer margins leave the industry much more susceptible to fluctuations in demand, supply, price, and long-term planning.
Alongside investment and planning, many consumers and industry partners alike have also stressed the importance of energy conservation. While long touted as a concern only for environmentalists, generators have also reaped the benefit of promoting conservation in leveling demand fluctuations. ISO New England regularly keeps customers abreast of high demand situations through energy watches and warnings. By asking consumers to cut use during peak hours and situations, they have been able to save as much as 300 -600MW of power (Healy 2001).
3.4 MODELING ENERGY SUPPLY-DEMAND CYCLES
The electric power industry in the US has historically experienced cycles of periods with significant shortage followed by periods of equally significant oversupply. A system dynamics study of this capacity volatility by Professor Andrew Ford at Washington State University suggests that long delays in the capital construction of power generation systems are to blame.
System Dynamics is used to determine causes and effects of policies on complex
as the system, and attempts to explain the reasons for the huge upswings and downswings in energy supply in the US.
In general, the demand for energy has grown reasonably consistently in the US as a whole, with volatility in check. So why has the supply, and hence the prices, been so wild? Professor Ford's model suggests that the extraordinarily long lead times for obtaining the proper permits, constructing new facilities and procuring generation equipment leads to overreactions by the power generators as a whole. For example, the current California power crisis has citizens and politicians up in arms about not having enough power to go around. Various government agencies are getting involved, encouraging and subsidizing expansion plans and new power generation facilities.
Independent companies and groups of citizens are purchasing their own sources of power generation so they don't have to be reliant on the power companies. This big capacity bubble will likely come online in roughly the same time period. Concurrently, the crisis has prompted many companies and citizens to invest in low-power consumption
consumer goods and adopt power-saving habits. So, while demand per capita is on the wane, supply is poised to spike dramatically. We can see that these events will lead to an oversupply situation, where power capacity is in glut and energy prices drop.
Why have we seen such large and fast spikes in power generation capacity? The answer lies primarily in investment incentives. When capacity begins to constrain the power system, prices go up in an effort to reduce demand. As prices go up, profits all along the value chain go up. These larger profit margins tend to entice investors to build new
facilities or expand the capacity of existing facilities. Another culprit may be the power generation equipment manufacturing company. Right now, these companies are being pressured to increase production capacity from all sides. Since energy prices are high, power companies are willing to pay a premium for this equipment especially if it can be delivered quickly. The stockholders and executives want to be able to take advantage of this. Government groups are leaning on these companies to get the equipment into the hands of the power generators as quickly as possible. Consumers are demanding power and unwilling to put up with blackouts. In response, these equipment manufacturers add shifts, expand their production facilities if possible, and gear up to produce generation equipment as fast as possible. Once they are geared up for high volumes, they don't want to slow down. They end up meeting the initial demand, and when orders dry up, they begin offering discounts on equipment. The discounts may provide sufficient incentive to push demand up a little further. The resultant over-availability of equipment
contributes to the capacity glut in the power generation industry.
Power companies try to manage the loading on their plants (e.g. minimize variability) on several levels. The first is the short-term loadings, where the efficient loading of the plant is adjusted on a minute-by-minute basis. Short-term management attempts to minimize the number of times generators have to be started up and shut down. The second level is mid-term management, where the companies manage fuel supplies and generator maintenance schedules. This minimizes the probability of a fuel shortage or capacity shortfall due to generator failure. Lastly, and the subject of Professor Ford's work, is the long-term planning of new generator capacity and transmission networks. This is typically done on a 40-year plan, and includes the purchase of new power
generation equipment. This long-term management requires forecasting of consumer power demand long before an accurate forecast could possibly be made.
We know from the "Bullwhip Effect" and inventory management in general, that when lead times are very long, small changes in forecasted demand have huge effects on the amount of inventory a retailer wants to hold. In the power industry, the retailer is the power generation company and the manufacturer is the power generator manufacturer. With planning on a 40-year cycle, the forecast for demand is going to change fairly dramatically as time goes on and actual demand can be more accurately predicted. And with only two major power generator manufacturers in the US, the impacts of this demand volatility will be very difficult to adjust to.
The electric power industry is differentiated from other commodity industries, and similar to service industries on two fronts. The first is the simultaneity of production and
consumption. The second is that there is no inventory to be stored for use at another time. Supply and demand must be matched as closely as possible - customers do not tolerate shortages and oversupply situations do not make efficient use of the companies' capital investments. A key methodology that power companies use to try and match demand with supply is price setting. Therefore, in an oversupply situation we expect prices to fall dramatically. Conversely, prices are highest during shortages (Ford 2000).
4 THE ROLE OF COMFORTCHOICE IN THE POWER INDUSTRY
It is important to understand where ComfortChoice fits within the rapidly changing and complex power industry. On a kilowatt-hour basis, ComfortChoice cannot compete with large power plants or the large combustion turbine peaking plants that are run for over
300 hours per year. However, ComfortChoice can be an important tool for the utility
industry. This chapter will examine the peak generation requirement that utilities face by analyzing real demand numbers from the New England Independent System Operator
(ISO) for the summer of 2001. It will discuss the transmission difficulties that the utility
operators face because of rapidly increasing usage that has resulted because of the 1996 federal order which opened transmission lines to all generator providers. It will also address the role that distributed generation could play in reducing transmission
constraints. The chapter will scrutinize the peak shaving segment of the power industry where ComfortChoice is a direct player. The final section of this chapter covers green power and will use environmental lifecycle analysis to determine what if any
environmental benefit ComfortChoice provides.
4.1 PEAK GENERATION
Power generation requirements are characterized by tremendous variation in demand. This demand varies from season to season. It also varies significantly during the day. The utility meets this complex demand profile through three levels of power plants. Base load plants run all the time and are configured to meet minimum power needs throughout the year. Base load plants are generally extremely large plants that rely on
economies of scale to deliver low cost power. Peaking power plants run to meet needs of the maximum load. Often this maximum load only occurs from 100 to several hundred hours per year. If the summer is cooler than normal, the peaking plants may not be used at all. These plants are mainly combustion turbine plants. Internal combustion plants are also used because of their rapid response. Peaking plants have the ability to respond rapidly to changing load conditions and are the most expensive plants to operate.
Intermediate power plants fall between the two types of power plants. They often include combined cycle generators, which are combustion turbine generators with secondary generators that use the waste heat to provide a more efficient generator (Reaves Rollins et al 2001).
Economic Dispatch Summer Peaking Utility
5 c ... ... ... .. . Most . .. .. 111111111-1.... ExpensivelMWh PURCHASED P WER 4500 25000 - CA 1200 -10 ) _0 N UCLEAR 500 0
Jarn Feb. March Apfit May June July August Sept. Oct. Nov. Dec.
Figure 7. Generation Profile for Typical Summer Loads (the C Three Group) Figure 7 shows the power supply management that the utility uses to match load profiles through the year. The utility uses the hydro, nuclear and coal plants as the base load
plants. The combined cycle covers the intermediate loads while peaking generators and purchased power cover peak power requirements.
4.1.1 ISO New England Load Profile
To gain a better understanding of the variability of the load demand, the New England ISO demand load is shown in Figure 8 for the summer months of 2001. The load ranges from a low of less than 10,000 megawatts to a high of 25,000 megawatts.
Demand Load for ISO New England June to September 2001
26000 24000 22000 S20000 18000 16000 S14000 12000 10000 8000
01-Jun 21-Jun 11-Jul 31-Jul 20-Aug 09-Sep 29-Sep Date
Figure 8. 2001 ISO New England Demand Load
Matching this demand load is very difficult. The figure shows that even though a maximum of 25,000 megawatts need to be available to meet peak demand requirements,
this level of load is only required for very few hours each year. It is costly to maintain generators that will operate only a few hours each year.
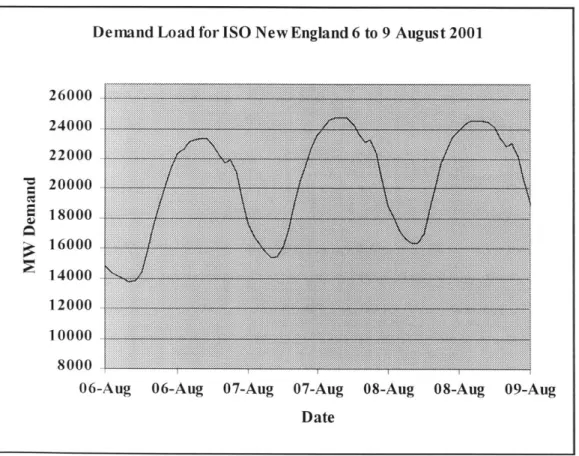
Figure 9 shows the load requirements for the three hottest days of the summer. This shows the variability within each day. The demand load of 24,000 megawatts is exceeded for a total of 28 hours the entire year. However, if there is not enough
generation capacity to match the demand, the whole system could fail. At the very least large blocks of power users will have to endure a power shutdown to prevent a
catastrophic failure of the entire system.
Demand Load for ISO New England 6 to 9 August 2001
26000 24000 22000 S20000 18000 16000 14000 12000-10000 8000
06-Aug 06-Aug 07-Aug 07-Aug 08-Aug 08-Aug 09-Aug Date
ISO New England Demand Load 6 to 9 August 2001 Figure 9.
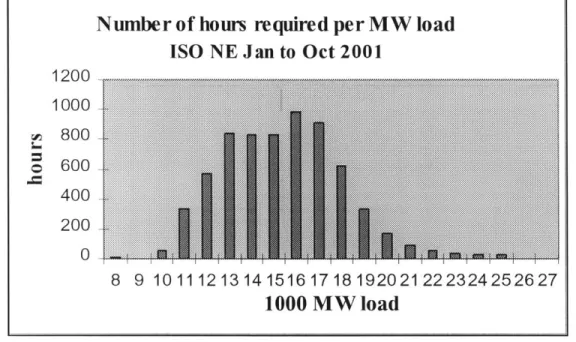
Figure 10 takes the hourly data used in figures 8 and 9 and puts them into demand bins ranging from 8,000 megawatt through 25,000 megawatts. It shows the number of hours required for each level of generation during the year. This figure can be used to design the base load, intermediate load, and peak load requirements for the New England region. It also helps determine the peak generator load requirements needed to meet the load demand requirements. The figure shows that there is very little demand for power above
Number of hours required per MW load
ISO NE Jan to Oct 2001
1200 1000 , 800 o 600 400 200 0 X 8 9 101112131415161718192021222324252627
1000 MW load
Figure 10. ISO New England, Required Generation Hours for Generation Loads 20,000 megawatts. In fact, there were only 407 total hours where the power requirements exceeded 20,000 megawatts. There were only 240 hours where the power requirements exceeded 21,000 megawatts. Peaking generators could be used to meet this short-term demand or the supply imbalance could be met by reducing the demand for these hours. Demand reduction provides "negawatts" to the system by reducing demands on the system during its highest demand days. This occurs through demand management programs run by the utilities in which industrial and commercial customers voluntarily
reduce their power requirements in exchange for a monetary reward. As a residential and light commercial demand management system, ComfortChoice is poised to play an important role in this area
4.2 TRANSMISSION
Much of the recent power crisis has been due to insufficient power generation capability. As the generation capacity is increased there will be sufficient generation supply
available to meet the demand requirements. However, there is an underlying problem that won't let the problem go away. Throughout the power system there are transmission constraints on the system that are preventing adequate power supply from reaching the market.
The utility transmission system can be separated into two components transmission and distribution. The transmission system is the high voltage system used to transport power from the source of generation to the distribution system. The higher voltage allows the power to be transmitted over longer distances with reduced transmission losses.
Depending on the location, the transmission system is primarily owned by federal, investor, or public utilities cooperatives. The distribution system takes the high voltage lines and reduces the voltage to be used by industrial, commercial and residential users. The distribution system is owned by several entities including, public, investor owned utilities, and cooperatives (Smith, June 4 2001). The importance of the transmission system has increased greatly since 1996 when the federal government ordered utilities to open their high voltage transmission lines to other suppliers triggering growth in the long distance transmission of electricity (Stripp 2001). As residential and commercial demand
increases, ensuring adequate generation capacity is not enough. It is essential that attention be focused on transmission capacities as well.
Several trends are causing the grid to reach capacity. Power loads on transmission lines have risen by a factor of 100 since 1975. The 1996 federal order to open up the lines to other suppliers has increased the transmission loads. The average number of megawatts that are moving through transmission lines has risen 22% from 1989 to 1999 and is expected to rise an additional 14% by 2009. At the same time, utility investment in transmission systems has fallen since the late 1970's. While there are substantial problems from inadequate transmission capacity, the problems are not likely to be fixed anytime soon. Since 1975, annual utility investments in the U.S. power transmission system have been cut in half from $4 billion to $2 billion. There is a much lower retum on investment for transmission and distribution systems than there is on generation. The cost of installing wires range from $1.5 million per mile to up $80 million per mile in dense urban areas. It takes up to 10 times longer to recover costs from transmission and distribution versus power generation. Additionally, there is actually a disincentive to invest because the utility is increasing the line capacity, which allows other generators to compete with them. Even if these hurdles are overcome, there is significant local
resistance to any new transmission construction. The local resistance is not likely to subside any time soon. In California, the term NIMBY (not in my back yard) has evolved into BANANA (build absolutely nothing anywhere near anything) (Smith, June 4, 2001). The cost of expanding the transmission system to meet peak demands is estimated at $50 billion over the next 10 years. Deregulation is driving the planned
addition of 190,000 megawatts of generation power to the system. This will take care of capacity margin deficits. However, there is no complementary plan to upgrade the transmission system. If the supply cannot reach the market, there is no supply (Stripp 2001). Given the difficulties in increasing the capacity, grid operators will be forced to operate the grid near capacity over the next several years.
Transmission problems are caused when there is a supply demand imbalance between two regions. One region relies on the other region's excess generation capacity to supply them with their power demand. This is accomplished by moving the power through transmission lines. An example of this is when the weather in one region is cool on one side of the transmission interface and hot in another region on the other side of the interface. There is an imbalance of power demand and capacity matching. The cool side has excess available power while the hot side needs to import power to cover the
additional load requirements. The excess power flows to the area of greater demand. It makes it economically attractive to move power from the cool side to the hot side but there is a practical limit of how much power can be transferred. (Levesque 2001). As more power flows through the lines to meet the capacity of the hotter region, the lines become heavily loaded. As the load increases, the lines begin to heat up. This heat build-up causes the lines to expand and sag. Wires drooping onto branches are a major cause of voltage sags and power outages (Smith, June 4, 2001). Periods of high heat especially during the summer time place greater demands on already taxed infrastructure. During heat waves, energy demand can sky rocket due to increased use of air
rise exponentially above the average of 9 percent as the cables and wires reach their maximum usage and become overheated. Power vendors who don't own wires can actually gain from this congestion. They stand to gain huge profits when peak line congestion pushes wholesale power prices higher (Smith, June 4, 2001).
Nearly 95% of power quality and reliability problems are due to lack of investment in transmission and distribution (Smith, August 29, 2001). The problems can be as severe as an outage or as minor as a brief dip or sag in the voltage. The power reliability problems are extremely costly to the utility's customers. The voltage dip may be small enough so that it is unnoticed by residents, but small voltage sags can cause hundreds of factory computers controlling factory machines to crash. For example, power quality problems can cause computers monitoring the thickness of steel stock at rolling mills to fail. This requires the steel to be scrapped or started through the process again at a cost of over $250,000. Annual U.S. losses from power quality losses range from $50 billion to $100 billion dollars (Lewis 2001). The average cost of downtime ranges from $41,000 per hour for cellular communications up to $6.48 million per hour for brokerage
operations.
There are two ways that the transmission congestion can be reduced. The first option is to increase the transmission capacity. For the reasons discussed above this is a long-term solution at best. The second option is source the power generation closer to the demand source through a series of distributed generators. ComfortChoice's role in this area is through its contribution of negawatts to the system. ComfortChoice can be used to
reduce power requirements, which frees up additional transmission capacity during critical load periods.
4.3 DISTRIBUTED GENERATION
Distributed generation is not a new phenomenon. Edison's first utility installation was actually the first occurrence of distributed generation. As power reliability has become increasingly more important to manufacturing processes, distributed generation has become more important. Distributed generation refers to small, dispersed generator units ranging from 20 kilowatts to 2 megawatts. This includes onsite generation for major industrial customers, small retail customers, and small-scale generators located near substations that are used by utilities to reduce grid loads. These generators have been used in several ways. The generators have been used to gain independence from the local utility. They have also been used to provide back-up power to maintain power quality for the site. Another use is for peak shaving. The generators are powered when the price of grid power exceeds a certain threshold (Stuebi 2000).
There are primarily three types of generating devices that are being used for distributed generation. Internal combustion engines have been the standard for distributed
generation. These engines are a proven technology and cost between $400-600 dollars per kilowatt to install. They are relatively inexpensive, very reliable and fairly efficient, but they can be noisy and dirty, and require substantial periodic maintenance. The second type of generating device is the micro turbine. Combustion turbines cost approximately $800 per kilowatt to install. As combustion turbine andjet engine