HAL Id: hal-03145575
https://hal.archives-ouvertes.fr/hal-03145575
Submitted on 18 Feb 2021
HAL is a multi-disciplinary open access
archive for the deposit and dissemination of sci-entific research documents, whether they are pub-lished or not. The documents may come from teaching and research institutions in France or abroad, or from public or private research centers.
L’archive ouverte pluridisciplinaire HAL, est destinée au dépôt et à la diffusion de documents scientifiques de niveau recherche, publiés ou non, émanant des établissements d’enseignement et de recherche français ou étrangers, des laboratoires publics ou privés.
A simple ATAC-seq protocol for population epigenetics
Ronaldo de Carvalho Augusto, Olivier Rey, Céline Cosseau, Cristian
Chaparro, Jérémie Vidal-Dupiol, Jean-François Allienne, David Duval, Silvain
Pinaud, Sina Tönges, Ranja Andriantsoa, et al.
To cite this version:
Ronaldo de Carvalho Augusto, Olivier Rey, Céline Cosseau, Cristian Chaparro, Jérémie Vidal-Dupiol, et al.. A simple ATAC-seq protocol for population epigenetics. Wellcome Open Research, F1000Research, 2021, 5, pp.121. �10.12688/wellcomeopenres.15552.2�. �hal-03145575�
Information Classification: General
A simple ATAC-seq protocol for population epigenetics
Ronaldo de Carvalho AUGUSTOab, Oliver REYa, Céline COSSEAUa, Cristian CHAPARROa,
Jérémie VIDAL-DUPIOLa, Jean-François ALLIENNEa, David DUVALa, Silvain
PINAUDa*, Sina TÖNGESd, Ranja ANDRIANTSOAd, Emilien LUQUETe, Fabien
AUBRETf, Mamadou Dia SOWg, Patrice DAVIDh, Vicki THOMSONi, Dominique JOLYj,
Mariana GOMES LIMAk, Déborah FEDERICOl, Etienne DANCHINl, Aki MINODAm,
Christoph GRUNAUa,1
a IHPE, Univ. Montpellier, CNRS, Ifremer, Univ. Perpignan Via Domitia, Perpignan, France.
b Univ Lyon, ENS de Lyon, Université Claude Bernard Lyon 1, Laboratoire de Biologie et Modélisation
de la Cellule, CNRS, UMR 5239, INSERM, U1210, Lyon, 69007, France.
d Division of Epigenetics, DKFZ‑ZMBH Alliance, German Cancer Research Center, Im Neuenheimer Feld
580, 69120 Heidelberg, Germany
e Univ Lyon, Université Claude Bernard Lyon 1, CNRS, ENTPE, UMR5023 LEHNA, F-69622,
Villeurbanne, France
f CNRS, Station d'Ecologie Théorique et Expérimentale, UMR 5321 CNRS – Université Paul Sabatier,
09200 Moulis, France/ School of Molecular and Life Sciences, Curtin University, Brand Drive, Bentley, WA 6102, Australia
g LBLGC, INRA, Université d’Orléans, EA1207 USC 1328, Orléans, France
h CEFE, 1919 route de Mende, 34293 Montpellier, France
i School of Biological Sciences, University of Adelaide, Adelaide, South Australia 5005, Australia.
j Laboratoire Evolution, Génomes Comportement, Ecologie, CNRS Université Paris Sud UMR 9191, IRD
UMR 247, Avenue de la Terrasse, 91198 Gif sur Yvette, France
k Laboratório de Malacologia, Instituto Oswaldo Cruz/Fiocruz, Pavilhão Adolpho Lutz, Av. Brasil 4365,
040-900 Rio de Janeiro, RJ, Brasil
l Laboratoire Évolution & Diversité Biologique (EDB UMR 5174), Université Fédérale de Toulouse;
CNRS, IRD. 118 route de Narbonne, Bât 4R1. 31062 Toulouse Cedex 9. France
m RIKEN Center for Integrative Medical Sciences, Epigenome Technology Exploration Unit, 1-7-22
Suehiro, Tsurumi, Yokohama, Kanagawa 230-0045, Japan.
* present address: Cancer Research UK, Cambridge Institute, University of Cambridge, Cambridge, UK
1 Correspondence: [email protected]
Abstract
We describe here a protocol for the generation of sequence-ready libraries for population epigenomics studies, and the analysis of alignment results. We show that the protocol can be used to monitor chromatin structure changes in populations when exposed to environmental cues. The protocol is a streamlined version of the Assay for transposase accessible chromatin with high-throughput sequencing (ATAC-seq) that provides a positive display of accessible, presumably euchromatic regions. The protocol is straightforward and can be used with small individuals such as daphnia and schistosome worms, and probably many other biological samples of comparable size (~10,000 cells), and it requires little molecular biology handling expertise.
Information Classification: General
Keywords: epigenetics, epigenomics, ATAC-seq, Daphnia pulex, Schistosoma mansoni
Introduction
Understanding the dynamic cross-talk between epigenetic mechanisms and environmental cues of animal populations is of fundamental importance for ecologists and evolutionary biologists (Shi et al., 2019). The
dynamics of chromatin has long been of interest as a source of phenotypic variance within and among
animal populations (Hu and Barrett, 2017; Zhang et al., 2018) and can affect their ecological performance (Augusto et al. 2019; Hawes et al., 2018). In eukaryotic cells, chromatin is a dynamic structure that provides epigenetic information to control cell and gene function (Chen & Dent 2014). The physical organization of the chromatin landscape modulates accessibility of genomic regions and dynamically response to both external and internal stimuli. In general, accessible genomic regions are enriched in regulatory elements important for gene activity while inaccessible regions restrict binding of transcriptional regulators resulting in gene silencing (Stergachis et al., 2013). Assay for transposase accessible chromatin with high throughput sequencing (ATAC-Seq) is a technique used to assess genome-wide chromatin accessibility. ATAC-seq works similarly as DNase-seq (DNase I hypersensitive sites with high-throughput sequencing) (Song & Crawford 2010), and determines which genomic regions are accessible to Tn5 transposase (i.e. open chromatin regions), presumably the regulatory regions. Tn5 transposase inserts Illumina adapter sequences upon accessing the chromatin, which removes the need for additional steps to make the sequencing libraries later. This simple and efficient protocol reduces the starting material required, compared to DNase-seq. It also avoids many other steps such as the interaction with antibodies (e.g. ChIP-seq) or chemical treatment (e.g. FAIRE-seq, WGBS) that might introduce bias. Deep sequencing of the PCR amplified Tn5 accessible regions provides a high-resolution map of accessible chromatin regions in the genome. We reasoned that this technique can not only be used to establish functional links between chromatin structure and gene function, but also to quantify epigenetic diversity in populations. This would require generation of ATAC-seq chromatin maps in single individuals. In addition, the technique should be sufficiently robust to be used by scientists who are experts in the field of population (epi)genetics and ecology, but having potentially received little training in molecular biology.
Here, we describe a streamlined and robust method for ATAC-Seq of individuals of the crustacea Daphnia
pulex and for the trematode Schistosoma mansoni. Our procedure is based on the protocol from Corces et
al. (2016), Buenrostro et al. (2015) and Nextera DNA Library Preparation Kit (2017). Besides their ecological and epidemiological importance, both abovementioned organisms show high phenotypic plasticity in response to environmental cues (e.g. the presence of predator for Daphnia) or during their development (schistosomes). There is a rich literature that has documented the amazing property of
Daphnia to modify their phenotypes at the morphological, physiological, behavioral and more recently at
the molecular levels in response to a large panel of environmental stressors including diet, pollution, heavy metals, and predator kairomones (reviewed in (Riessen 2011, Harris et al. 2012)). Schistosomes also deal with a multitude of signals from the water environment as well as cues that come from their hosts, shaping morphology, metabolism, and infection success in the short-term and also their full development later in life (Roquis et al. 2017, 2018, Augusto et al 2017, 2019). We and others have characterized many aspects of epigenetic mechanisms behind the phenotypic plasticity of schistosomes and their cross-talk with environmental cues. Epigenetics of D. pulex phenotype plasticity is still poorly understood. To validate the robustness of the method, we were experimenters with different levels of expertise in molecular biology to
Information Classification: General
run the experimental procedure independently using D. pulex and S. mansoni. We show here that our procedure provides robust results with individual D. pulex and with single adult worms of S. mansoni, but other organisms of similar cell number can probably also be used.
Materials and Methods
Animal sampling
A batch of ~300 commercial Daphnia pulex was obtained from a commercial supplier (Aqualiment:
http://www.aqualiment.eu/). For schistosomes, fresh adult worms were collected from female Swiss OF1 mice (weight mean 18g) supplied by Charles River, L’Arbresle, France. Mice had been infected by peritoneal injection with 150 mixed sexes cercaria. Water and food were given ad libitum, 12h light/dark cycle, 25°C. Housing, feeding and animal care followed the national ethical standards established in the writ of 1 February 2013 (NOR: AGRG1238753A) setting the conditions for approval, planning and operation of establishments, breeders and suppliers of animals used for scientific purposes and controls. The French Ministère de l’Agriculture et de la Pêche and French Ministère de l’Éducation Nationale de la Recherche et de la Technologie provided permit A66040 to our laboratory for experiments on animals and certificate for animal experimentation (authorization 007083, decree 87–848) for the experimenters. Hepatic perfusions were performed with lethal injection of 1mg per kg body weight of sodium pertobartial solution (Dolehal, Vetoquinol, Lure, France) after 65 days post infection. Living adult male worm was individually transferred to a 1.5mL Eppendorf tube and immediately processed for ATAC-seq library preparation.
Environmental cues
At their arrival, D. pulex were immediately split into two sets of equal size (~ 150 x 2) and placed in two independent experimental tanks (i.e. initial density of 75 ind/L), hereafter called the ‘stress’ and the ‘control’ tanks. Each experimental tank consisted in a 2-L plastic aquaria (L x l x h = 18 x12 x 11 cm) supplied with clean water, inside of which a floating plastic fish breeding isolation box (L x l x h = 12.5 x 8 x7 cm) was placed. These isolation boxes are transparent with a series of 1 mm cracks on the bottom wall to allow water connection between the tanks and inside the isolation box. D. pulex were acclimated in their respective experimental tanks out of the isolation box for 20 days prior to starting the experiment. This lag time before the experiment also allowed the production of new D. pulex offspring born in our experimental setup. During this acclimating period, only negligible mortality was observed and newly hatched D. pulex were observed in the two experimental tanks. After this 20-day acclimating period, a predator (i.e. a guppy fish previously trained to eat D. pulex) was introduced into the isolation box of one experimental tank during 15 days (i.e. hereafter called the ‘stress treatment’, compared to the ‘control treatment’) (Figure
1A). During the experiment the fish was fed every other day with 10 D. pulex collected alternatively from
the stress and the control tank (i) to avoid subsequent biases in density between the experimental treatments and (ii) to account for a possible effect of D. pulex sampling on congeners‘ responses. D. pulex sampling for fish feeding was achieved using a sterile 3-ml plastic transfer pipet. This experimental setup allowed the D. pulex of the stress treatment to experience an indirect predation pressure (i.e. without predation risk) through a direct visual contact with the predator and an olfactory contact with environmental cues released by the predator. Over the experiment, the D. pulex and the predator were maintained at room temperature
Information Classification: General
following the natural photoperiod and the former were fed ad libitum with clean phytoplancton (i.e.
Chlorella sp.) reared in our lab facilities. Living D. pulex were sampled by pipetting through a 1 mL
automatic pipette with enlarged openings of the pipetting tips. To avoid experimenter bias, 13 different persons sampled at least one individual each. Finally, each specimen was then individually transferred to a 1.5 mL Eppendorf tube and was immediately processed for ATAC-seq library preparation as follows. Controls were done without organisms as input.
For schistosomes, treatment of vertebrate infective larvae (cercariae) and recovery of adult worms was done as described in Augusto et al. 2017. Briefly, E. milii var. hislopii latex was collected at Ilha do Governador
district (22°48´09´´S/43°12´35´´W), Rio de Janeiro, Brazil lyophilized at -52°C on 8 x10⁻¹ mBar for three
12-hour cycles in a Modulyo 4K Freeze Dryer with an acrylic chamber (Edwards High Vacuum Int., UK). The dose of the powdered lyophilized latex used to expose cercariae was 1.4 mg/L, described by Augusto
et al. 2017 as LC50 for the intermediate host Biomphalaria glabrata. Cercariae were collected from infected
host B. glabrata and split into two groups as follows: one group described as ‘Control treatment’ (Figure
1B) was kept in a tank of water for one hour while other group described as ‘Latex treatment’ was exposed
to a solution of E. milii lyophilized latex in distilled water (1.4 mg/L), both for one hour. We infected 10 female mice (4 weeks-old Swiss-Webster mice, weight mean 18g) with 150 exposed cercariae per mouse and another 10 mice were infected with 150 mock treated cercariae per mouse, all using standard percutaneous inoculation and mixed sexes. Finally, parasites couples were recovered at 65 days post-infection by perfusion. (Figure 1B). Males were manually separated from females and only male worms were used.
Counting of nuclei
Individual male S.mansoni worms and individual D.pulex were transferred into 1.5 ml Eppendorf tubes and all excess liquid was removed. Animals were resuspended in 20 – 100 µL of Nuclei EZ lysis buffer (Sigma N3408-200ml) and grinded with disposable polypropylene pestles. Two µL were applied on microscope glass slides and 2 µL ProLong Diamond Antifade mountant with DAPI (Invitrogen P36966) were added to stain nuclei. Nuclei in the total volume were counted under a Zeiss fluorescence microscope.
Transposase mixture
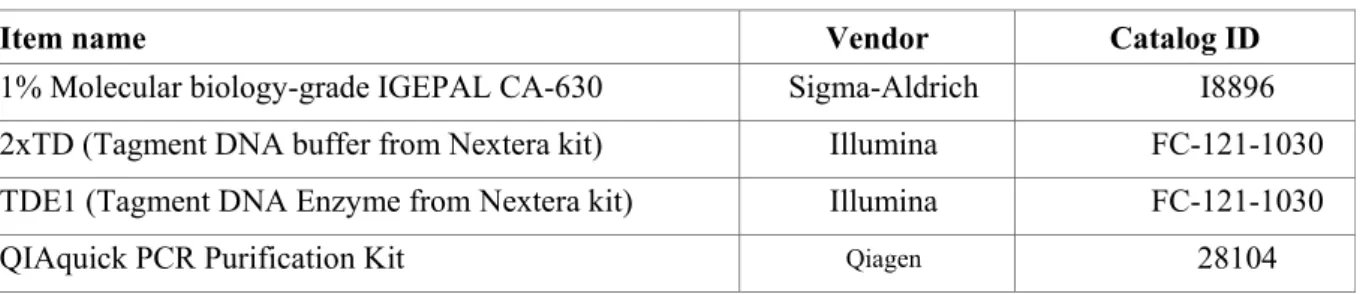
The necessary material is listed in tables 1 and 2 and must be prepared in advance. In addition, nuclease-free water, high fidelity DNA polymerase for PCR and corresponding buffers, freshly prepared 80% ethanol, refrigerated centrifuge, 0.2 ml PCR tubes, 1.5 ml tubes, ThermoMixer with agitation, PCR thermal cycler, qPCR instrument, magnetic rack, 1 mL pipette, 100 μL pipette, and 10 μL pipette are needed.
Table 1. Externally sourced materials.
Item name Vendor Catalog ID
1% Molecular biology-grade IGEPAL CA-630 Sigma-Aldrich I8896
2xTD (Tagment DNA buffer from Nextera kit) Illumina FC-121-1030
TDE1 (Tagment DNA Enzyme from Nextera kit) Illumina FC-121-1030
Information Classification: General
AMPure XP beads Agencourt A63880
Bioanalyzer High-Sensitivity DNA Analysis kit Agilent 5067-4627
10,000X SYBR I Invitrogen S-7563
Table 2. Reagents produced in the laboratory.
Phosphate buffered saline (PBS) 137mM NaCl; 27mM KCl; 100mM Na2HPO4; 18mM
KH2PO4
2× Tagmentation buffer (2× TD buffer) 20 mM Tris(hydroxymethyl)aminomethane; 10 mM
MgCl2; 20% (vol/vol) dimethylformamide (Wang et al
2013)
An Eppendorf ThermoMixer was then set with agitation to 37°C and the following steps performed. For D. pulex remove all water by pipetting with 100 µL tip;
or
Perfuse S. mansoni worms and take single worm as dry as possible with forceps
Wash once with 50 μL of cold 1x PBS buffer and remove all supernatant by pipetting, being careful not to remove your sample;
Add to each sample
o 25 μL 2× TD buffer o 2.5 μL TDE1 o 0.5 μL 1% IGEPAL o 22 µL Nuclease-free water
This gives 50 µL of transposase mixture for each sample. The samples are pipetted up and down 10 times to disrupt cells. In our hands, the addition of IGEPAL directly into the tagmentation reaction, and the agitation eliminated the need for a separate cell lysis step and streamlined the protocol.
Chromatin tagmentation
This step uses the Nextera Tn5 transposome to ‘tagment’ the chromatin, which is a process that fragments the chromatin and tags the DNA with adapter sequences in a single step.
Tagmentation reactions are incubated at 37°C for 30 min in an Eppendorf ThermoMixer with agitation at 300 rpm.
Tagmented chromatin is immediately purified using a QIAGEN MinElute Reaction Cleanup kit or a QIAquick PCR Purification Kit , and purified DNA is eluted into 20 μL of elution buffer (10 mM Tris-HCl, pH 8).
Library amplification
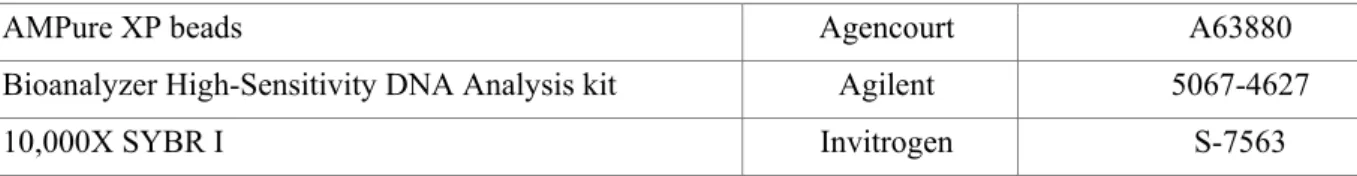
This step amplifies the tagmented DNA using a limited-cycle PCR program. PCR is carried out with a universal index Ad1 and an index (barcode) primer Ad2, as described in Table 3 (Buenrostro et al 2015). Two library amplification methods were tested and validated in our hands as follows:
Information Classification: General
Option 1 (for Promega GoTag G2). Combine the following in a PCR tube for each sample: 9.5 μL
Nuclease-free MilliQ water; 20 μL Purified transposed DNA; 10 μL 5x GoTaq G2 buffer; 4 μL MgCl2;
2.5 μL Universal Ad1_noMX primer (25 µM); 2.5 μL Specific Index primer Ad2.*, different for each sample (25 µM); 1 μL dNTPs (10 mM); 0.5μL GoTaq G2.
Or
Option 2 (for NEB mix, more convenient but more expensive). Combine the following in a PCR tube for
each sample: 20 μL purified transposed DNA; 2.5 μL Universal Ad1_noMX primer (25µM); 2.5 μL Specific Index primer Ad2.*, different for each sample (25µM); 25 μL NEBNext High-Fidelity 2X PCR Master Mix
Table 3. PCR Primer ID and sequence.
Index ID Sequence Ad1_noMX: AATGATACGGCGACCACCGAGATCTACACTCGTCGGCAGCGTCAGATGTG Ad2.1_TAAGGCGA CAAGCAGAAGACGGCATACGAGATTCGCCTTAGTCTCGTGGGCTCGGAGATGT Ad2.2_CGTACTAG CAAGCAGAAGACGGCATACGAGATCTAGTACGGTCTCGTGGGCTCGGAGATGT Ad2.3_AGGCAGAA CAAGCAGAAGACGGCATACGAGATTTCTGCCTGTCTCGTGGGCTCGGAGATGT Ad2.4_TCCTGAGC CAAGCAGAAGACGGCATACGAGATGCTCAGGAGTCTCGTGGGCTCGGAGATGT Ad2.5_GGACTCCT CAAGCAGAAGACGGCATACGAGATAGGAGTCCGTCTCGTGGGCTCGGAGATGT Ad2.6_TAGGCATG CAAGCAGAAGACGGCATACGAGATCATGCCTAGTCTCGTGGGCTCGGAGATGT Ad2.7_CTCTCTAC CAAGCAGAAGACGGCATACGAGATGTAGAGAGGTCTCGTGGGCTCGGAGATGT Ad2.8_CAGAGAGG CAAGCAGAAGACGGCATACGAGATCCTCTCTGGTCTCGTGGGCTCGGAGATGT Ad2.9_GCTACGCT CAAGCAGAAGACGGCATACGAGATAGCGTAGCGTCTCGTGGGCTCGGAGATGT Ad2.10_CGAGGCTG CAAGCAGAAGACGGCATACGAGATCAGCCTCGGTCTCGTGGGCTCGGAGATGT Ad2.11_AAGAGGCA CAAGCAGAAGACGGCATACGAGATTGCCTCTTGTCTCGTGGGCTCGGAGATGT Ad2.12_GTAGAGGA CAAGCAGAAGACGGCATACGAGATTCCTCTACGTCTCGTGGGCTCGGAGATGT Ad2.13_GTCGTGAT CAAGCAGAAGACGGCATACGAGATATCACGACGTCTCGTGGGCTCGGAGATGT Ad2.14_ACCACTGT CAAGCAGAAGACGGCATACGAGATACAGTGGTGTCTCGTGGGCTCGGAGATGT Ad2.15_TGGATCTG CAAGCAGAAGACGGCATACGAGATCAGATCCAGTCTCGTGGGCTCGGAGATGT Ad2.16_CCGTTTGT CAAGCAGAAGACGGCATACGAGATACAAACGGGTCTCGTGGGCTCGGAGATGT Ad2.17_TGCTGGGT CAAGCAGAAGACGGCATACGAGATACCCAGCAGTCTCGTGGGCTCGGAGATGT Ad2.18_GAGGGGTT CAAGCAGAAGACGGCATACGAGATAACCCCTCGTCTCGTGGGCTCGGAGATGT Ad2.19_AGGTTGGG CAAGCAGAAGACGGCATACGAGATCCCAACCTGTCTCGTGGGCTCGGAGATGT Ad2.20_GTGTGGTG CAAGCAGAAGACGGCATACGAGATCACCACACGTCTCGTGGGCTCGGAGATGT
Information Classification: General
Ad2.21_TGGGTTTC CAAGCAGAAGACGGCATACGAGATGAAACCCAGTCTCGTGGGCTCGGAGATGT
Ad2.22_TGGTCACA CAAGCAGAAGACGGCATACGAGATTGTGACCAGTCTCGTGGGCTCGGAGATGT
Ad2.23_TTGACCCT CAAGCAGAAGACGGCATACGAGATAGGGTCAAGTCTCGTGGGCTCGGAGATGT
Ad2.24_CCACTCCT CAAGCAGAAGACGGCATACGAGATAGGAGTGGGTCTCGTGGGCTCGGAGATGT
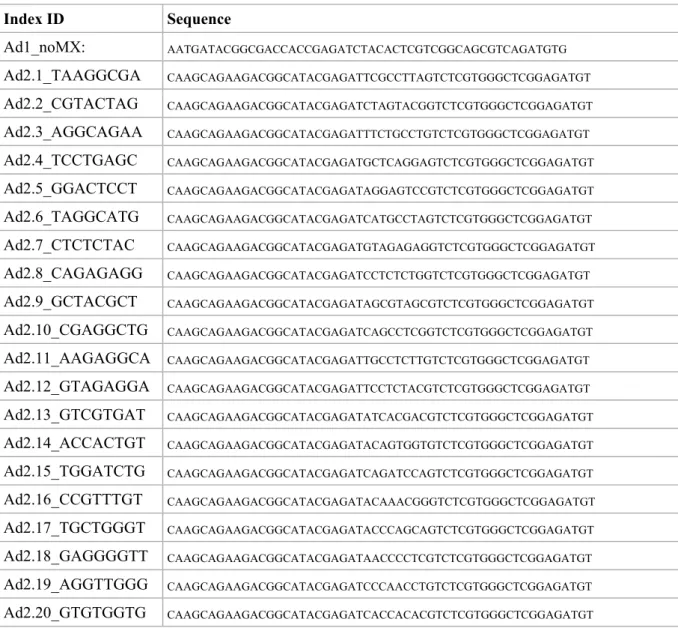
In both options the final volume is 50 µL. The samples are pre-amplified using a PCR machine with the program described in Table 4.
Table 4. PCR program for library pre-amplification.
In order to reduce GC and size bias in the subsequent PCR, the PCR dynamics is monitored using qPCR to stop amplification prior to saturation. To run a qPCR side reaction, we combined the following depending on the option that had been chosen previously:
Option 1: 5μl PCR product of the initial pre-amplification reaction (keep the remaining 45µL at 4°C); 2.5μl
5x GoTaq G2 buffer; 0.1 μL GoTaq 2; 3.14μl Nuclease-free MilliQ water; 0.25 μL Universal Ad1_noMX
primer (25µM); 0.25 μL Ad2.* indexing primer (25µM) ;1 μL MgCl2; 0.25 μL dNTPs; 0.1μL 100X SYBR
I or
Option 2: 5μl PCR product of the initial pre-amplification reaction (keep the remaining 45 µL at 4°C);
4.41 μL Nuclease-free MilliQ water; 0.25 μL Ad1_noMX primer (25 μM); 0.25 μL Ad2.* indexing primer (25 μM); 0.09 μL 100X SYBR I; 5 μL NEBNext High-Fidelity 2X PCR MasterMix
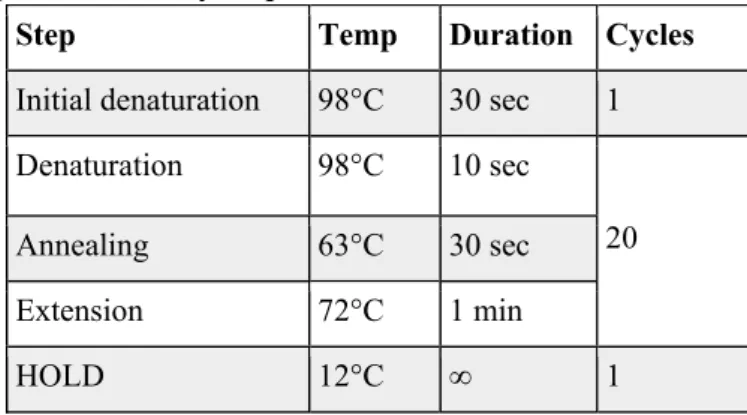
The samples are amplified in a qPCR machine with the program set out in Table 5.
Step Temp Duration Cycles
Pre-Warming 72°C 5 min 1
Initial denaturation 98°C 30 sec 1
Denaturation 98°C 10 sec
5
Annealing 63°C 30 sec
Extension 72°C 1 min
Information Classification: General
Table 5. PCR program for library amplification.
To calculate the optimal additional number of cycles needed for the remaining 45 μL PCR, relative fluorescence is plotted against cycle number and the cycle number that corresponds to one-third of the maximum fluorescent intensity is determined (Figure 2). In our experience, the total number of amplification cycles must not exceed 21 (Augusto et al. 2019).
The remaining 45 μL PCR reaction is run with the additional number of cycles and purified with a QIAGEN MinElute Reaction Cleanup kit or a QIAquick PCR Purification Kit, or similar, and eluted into a total of 45 μL of elution buffer (10 mM Tris-HCl, pH 8). Elution can be done in two rounds.
Fragments are separated by electrophoresis through a 1.5% agarose gel or on a Bioanalyzer chip. A ladder that corresponds to the nucleosome-free region and multiple nucleosome-size fragments should be seen (one nucleosome = about 150 bp). A single band at around 150 bp indicates sample degradation or over-fragmentation. Ideally, five bands should be obtained, three bands are acceptable (Figure 3A).
AMPure XP beads double-side purification
This step enriches for the nucleosome-free (~300 bp) as well as di and tri-nucleosome fragments. Removing small fragments (primer dimers) is important for optimal sequencing. First transfer 45 µL to an Eppendorf tube (or use PCR tube directly), add 22.5 μL (0.5X original volume, to remove large fragments) AMPure XP beads, pipet up and down 10 times to mix thoroughly. Incubate at room temperature for 10 minutes and place tubes in magnetic rack for 5 minutes. Transfer supernatant to new tube and add 58.5 μL (1.3X original volume, to remove small fragments) AMPure XP beads, pipet up and down 10 times to mix thoroughly. Incubate at room temperature for 10 minutes, place tubes in magnetic rack for 5 minutes and discard supernatant. Wash beads with 200 μL 80% ethanol (freshly made), pipet ethanol over beads 10 times, then discard ethanol. Ensure all ethanol is removed. Leave tube on magnetic rack with cap open for 3 to maximum 10 minutes depending on ambient humidity. The beads should be ‘glowing’ but not wet. Be careful not to over-dry them, which will decrease elution efficiency. Resuspend beads in 20 μL nuclease-free water, pipet up and down 10 times to mix thoroughly, place tube in magnetic rack for 1-5 minutes and transfer supernatant to new tube. This step can be replaced by Diagenode IP-Star, size selection 320 bp. We have not systematically investigated if different purification procedures influence on the result. Purified libraries should be stored at -20˚C and can be used for sequencing after up to 4 months.
Step Temp Duration Cycles
Initial denaturation 98°C 30 sec 1
Denaturation 98°C 10 sec
20
Annealing 63°C 30 sec
Extension 72°C 1 min
Information Classification: General
Libraries check
Size profiling can be performed using an Agilent Bioanalyzer High Sensitivity DNA Assay. Expected profiles are shown in Figure 3B. Bioanalyzer profiles or KAPA library quantification kit were used to quantify libraries and proceed to sequencing. We present here data sequenced on a NextSeq550 High Output Flowcell as paired-end and 75 bp.
Detection of chromatin structure differences
Sequence quality was checked with FastQC (http://www.bioinformatics.babraham.ac.uk/projects/fastqc/).
For D. pulex, reference genome was downloaded from ftp://ftp.ensemblgenomes.org/pub/metazoa/release-40/fasta/daphnia_pulex/dna/Daphnia_pulex.V1.0.dna.toplevel.fa.gz , corresponding to GenBank assembly accession GCA_000187875.1. For S. mansoni, v5 reference genome was downloaded from
ftp://ftp.sanger.ac.uk/pub/pathogens/Schistosoma/mansoni/genome/Assembly-v5/ . For both, alignment was done with Bowtie2 evoking the following parameters: bowtie2-align-s basic-0 -p 6 -x genome -N 1 -L 32 -i S,1,1.15 --n-ceil L,0,0.15 --dpad 15 --gbar 4 --end-to-end --score-min L,-0.6,-0.6. Uniquely aligned reads were retained by filtering the tag “XS:i:” that is absent in their alignement annotations.
For visualisation of ATAC profiles, all BAM files from D. pulex or S. mansoni were merged, converted to header-free SAM, and downsampled with a custom script that draws random lines to the condition with the lowest number of aligned reads (409,000 aligned reads for D. pulex and 15,000,000 reads for S. mansoni). For both, PCR duplicates were removed with SamTools RmDup. Bedgraph files were generated with MACS2 and/or ChromstaR, lower fold bound of 5, upper fold bound 50, band width 300 bp, minimum FDR for peak detection of 0.05 and without calling broad regions. Bedgraphs were loaded into IGV for visual inspection. For analysis of individual D. pulex or S. mansoni, background correction was done with MACS bdgcmp and linear scale fold enrichment (--method FE). Bedgraph was converted into BigWig. The DeepTools suite was used for representation of metagene profiles based on the forward strand for both
organisms. For Daphnia, gene annotation files were downloaded from
ftp://ftp.ensemblgenomes.org/pub/metazoa/release-40/fasta/daphnia_pulex/cds/Daphnia_pulex.V1.0.cds.all.fa.gz. More information is available at
https://metazoa.ensembl.org/Daphnia_pulex/Info/Annotation/. For S. mansoni, gene annotation was
downloaded from ftp://ftp.sanger.ac.uk/pub/pathogens/Schistosoma/mansoni/genome/Assembly-v5/ and
modified to contain only genes and pseudogenes (sma_v5.2_2015.01.06_genes_pseudogenes_rnas.gff3). Two different approaches were used for further data analysis. One uses a combination of peakcalling with MACS2, extraction of read coverage in peaks with BEDtools intersect intervals with A-File the MACS peaks and B-File the uniquely aligned BAM, and DESeq2 for differential analysis. To detect all peak regions for all conditions, For Daphnia, BAM files of control and stress conditions were merged and peakcalling was performed with MACS2 as described above. The number of reads overlapping peak regions was extracted with bedtools intersect -a peakfile.bed -b individual_bam_files.bam -header -wa -c, Columns 4 and 11, corresponding to peak-names and number of overlapping features, i.e. coverage were used as input for DESeq2. All analyses were done at the galaxy instance of the Labex CeMEB/IHPE (http://bioinfo.univ-perp.fr).
The second approach was based on Hidden-Markow-Models (HMM) implemented in ChromstaR (v.1.2.0) for genome-wide characterization of open chromatin landscape. On this approach control and stress condition were processed in two steps: (1) we fitted a univariate HMM over each ATAC-seq samples
Information Classification: General
individually and (2) we performed a multivariate HMM over the combined ATAC-seq samples in each condition. For that, BAM files were processed under the differential mode, with a false discovery rate (FDR) cutoff of 0.05 and bin size of 500.
Results
The method can be used by scientists with low expert level in molecular biology
The protocol described in the methods section was tested by 13 experimenters with molecular biology expert level ranging from untrained to over several 10 years of experience, or some who had retired from active wet-bench work several years ago. In only two cases ATAC-seq library production did not succeed.
ATAC-Seq can be used on individual Daphnia and individual Schistosoma adults
Our ATAC-seq procedure delivered reproducible chromatin profiles for individual D. pulex and adult S.
mansoni. Projection of ATAC-seq reads on a metagene profile indicated that Tn5 accessible and thus
presumably open chromatin structure occurs at the TSS and in gene bodies (Figure 4). Individual daphnia contain 8,500-10,000 nuclei and adult male schistosomes 18,000 – 20,000 nuclei.
Exposure to predator cues leads to morphological differences in Daphnia
Our results show that on average, the (LL-SL)/SL ratio calculated for D. pulex from the stress treatment (N = 14; Mean = 0.24 ± 0.072) was significantly higher than that from the control treatment (N = 12; Mean =
0.15 ± 0.039;Mann-Whitney U Test, U = 19, Z = -3.32, P < 0.001) (Figure 5). This result confirms the
expected induction of anti-predatory morphs in the stress treatment. It is noteworthy that the quantified morphological response to predation pressure observed in the stress treatment most likely reflects a more general response of stressed D. pulex including morphological, physiological and behavioural changes
(Boersma et al. 1999) Our first intention in comparing D. pulex from the two experimental treatmentswas
to confirm that we effectively induced a global response in stressed individuals, these responses having been otherwise much better documented previously (Riessen 1999).
Exposure to predator cues leads to differences in chromatin structure between exposed (stressed) and unexposed (control) Daphnia pulex
Using the DESeq2 procedure described above for ‘start’ vs. ‘control’ we identified 66,194 differences between ‘control’ and ‘stressed’. This is by far too many, and indeed, shifts in MA plots (not shown) indicated that the assumption that is underlying the algorythm used in DESeq2 and the requires that most sites do not change, was violated. Metagene profiles, using the same number of aligned reads over the entire genome, lend further support to the finding that ‘stressed’ samples had on average fewer reads over genes than ‘control’ samples indicating major changes in chromatin structure (Figure 6).
This also means that there is a large number of regions for which no reads could be recovered in the stressed samples. This is not due to a general lower accessibility of Tn5 to the cells and nuclei because of a thicker cuticle or a similar phenotypic trait because the insert size distribution of start, control and stressed populations are similar (Supplementary file 1). If DNA was more inaccessible in the stressed population we would expect longer fragments. To cope with the general decrease of ATAC-Seq reads in the stressed population, we resorted to ChromstaR, a HMM based software that was developed for ChIP-Seq analysis but that in principle can also be used for ATAC-Seq and is probably less sensitive to zero values. Under the
Information Classification: General
constraints of numerous instances of an ‘absence of data’ (Tn5 inaccessible), ChromstaR identified 87 regions that are different between start and control, and stress. All were visually inspected using MACS2 average profiles, normalised by the same number of aligned reads over the genome. Among these 87 regions, ATAC signal was down in stressed samples compared to ‘control and start’ in 45 regions (52%), down in ‘stress and control’ compared to ‘start’ in 16 (18%), up in ‘stress and control’ in 3 (3.4%), and down in ‘control’ in only 1 (1.1%). Seven regions showed a heterogenous pattern on ATAC signals. In 15 regions differences were considered too weak (17%) suggesting that fine tuning of ChromstaR parameters might be necessary in the future. These results are in line with a general decrease in ATAC signal in the stressed samples, i.e. chromatin becomes less accessible and/or less heterogenous. It is interesting to note that for 20 regions adjacent ATAC signals (less than 2kb apart) were detected, lending further support to the idea that chromatin structure changes occur in a controlled fashion. Clustering of the samples clearly regroups control and stressed samples (Figure 7).
Exposure to Latex leads to differences in chromatin structure between schistosoma adults that developed from exposed (stressed) and unexposed (control) cercaria
With DESeq2 we found 296 differences between schistosoma adults that developed from latex exposed cercaria and controls with adjusted p-value ≤0.05. MA plots were symmetric around 0 (Figure 8A), and PCA plots (Figure 8B) indicated clear segregation of both sample groups. We used in this small study only four worms to demonstrate the feasibility of the method.
Discussion
Phenotypically, plasticity plays an important role in development and evolution. The relative contribution of genetic and epigenetic components to heritable plasticity is a matter of lively scientific debate (Hu and Barrett, 2017, Roquis et al. 2018). One of the caveats of analyzing epigenetic information is that it is stored in several, very different bearers of information (e.g. DNA methylation, modification of histones, non-coding RNA and topological position in the interphase nucleus). Nevertheless, these types of information converge towards a change in chromatin structure which can be approximated by DNA accessibility. We reasoned that a straightforward ATAC-seq method to map the chromatin accessibility status in populations with high phenotypic plasticity would facilitate further investigations of the role of epigenetics in plasticity. This study field is also of particular importance to field ecologists. We therefore set-out to establish a robust, easy to use protocol that can be used with little molecular biology training. Our protocol was successfully used in the framework of a summer school ‘Epigénétique en Ecologie et Evolution’ by participants with different levels of expertise in molecular biology using D. pulex. We also used single adult S. mansoni worms as biological material in a small pilot study. We believe that our protocol is suitable for fast epigenotyping of other organisms as well. From our experience, the only parameter that might be necessary to optimize is Tn5 to chromatin ratio if over- or under-fragmentation occurs. A potential issue is contamination with microorganisms whose DNA might be present in the libraries.
Data availability
Protocols.io “A simple ATAC-seq protocol for population epigenetics”
Information Classification: General
A step-by-step protocol for the ATAC-seq procedure
Zenodo: Supporting data for “A simple ATAC-seq protocol for population epigenetics”. http://doi.org/10.5281/zenodo.3828600 (Augusto et al., 2020).
This project contains the following underlying data:
Agarose picture (TIF). (Example of electrophoresis fragment separation.) Agarose profile (PNG) (Example of fragment separation on a BioAnalyser chip.) BioAnalyser, BioAnalyser 2–4 (PDF). (BioAnalyser profiles generated in this study.) qPCR cycles (XLSX). (Quantification of qPCR cycles for each daphnia.)
qPCR plot (JPG). (qPCR amplification cycles plot.) NCBI SRA:
https://www.ncbi.nlm.nih.gov/bioproject/587385
BioProject Accession PRJNA587385
Data are available under the terms of the Creative Commons Attribution 4.0 International license (CC-BY 4.0).
Grant information
This work was performed with the support of LabEx CeMEB, an ANR “Investissements d’avenir” program (ANR-10-LABX-04-01) and the RTP Epigenetics in Ecology and Evolution (RTP3E). R.A. and C.G. were supported by the Wellcome Trust Strategic award 107475/Z/15/Z. C.G. and A.M. received support from JSPS grant S17087.
Author contributions
A.M. and C.G. designed research, A.M. initially optimized the method. All authors performed research, R.A., A.M. and C.G. wrote the paper.
The authors declare no conflict of interest.
Acknowledgments
We thank J.F. Allienne at the Bio-environment platform (University Perpignan Via Domitia) for support in NGS library preparation and sequencing, and the Environmental Epigenomics platform for support with ATAC-Seq procedure. This study is set within the framework of the "Laboratoires d'Excellences (LABEX)" TULIP (ANR‐10‐LABX‐41).
References
Augusto R., Duval D., Grunau C. (2019). Effects of the environment on developmental plasticity and infection success of Schistosoma parasites - an epigenetic perspective . Frontiers in Microbiology,
section Microbial Immunology, 10 : 1475
Augusto R, Minoda A, Grunau C. (2020) Supporting data for "A simple ATAC-seq protocol for population epigenetics” https://zenodo.org/deposit/3828600 (10.5281/zenodo.3828600).
Information Classification: General
Buenrostro JD, Wu B, Chang HY, Greenleaf WJ. (2015). ATAC-seq: A Method for Assaying Chromatin Accessibility Genome-Wide. Curr. Protoc. Mol. Biol. 109:21.29.1- 21.29.9. doi:
10.1002/0471142727.mb2129s109
Chen T, Dent SY. (2014) Chromatin modifiers and remodellers: regulators of cellular differentiation. Nat Rev Genet. ;15(2):93–106. doi: 10.1038/nrg3607
Corces MR, Buenrostro JD, Wu B, Greenside PG, Chan SM, Koenig JL, Snyder MP, Pritchard JK, Kundaje A, Greenleaf WJ, Majeti R, Chang HY. (2015). Lineage-specific and single-cell chromatin accessibility charts human hematopoiesis and leukemia evolution. Nat Genet; 48(10): 1193-203. doi: 10.1038/ng.3646. Epub 2016 Aug 15.
Hawes, N., Fidler, A., Tremblay, L., Pochon, X., Dumphy, B., and Smith, K. (2018). Understanding the role of DNA methylation in successful biological invasions: a review. Biol. Invasions 20, 2285– 2300. doi: 10.1007/s10530-018-1703-6
Harris KD, Bartlett NJ, Lloyd VK (2012) Daphnia as an emerging epigenetic model organism. Genet
Res Int, 147892.
Hu J, Barrett R. (2017). Epigenetics in natural animal populations. J Evol Biol. 30(9):1612–1632 Stergachis AB, Neph S, Reynolds A, Humbert R, Miller B, Paige SL, et al. (2013) Developmental fate
and cellular maturity encoded in human regulatory DNA landscapes. Cell. 154(4):888–903. doi: 10.1016/j.cell.2013.07.020
Riessen H (2011) Predator-induced life history shifts in Daphnia: A synthesis of studies using meta-analysis. Canadian Journal of Fisheries and Aquatic Sciences, 56, 2487–2494.
Roquis, D., Taudt, A., Geyer, K. K., Padalino, G., Hoffmann, K. F., Holroyd, N., et al. (2018). Histone methylation changes are required for life cycle progression in the human parasite Schistosoma mansoni. PLoS Pathog. 14:e1007066. doi: 10.1371/journal.ppat.1007066
Shi W, Chen X, Gao L, Xu C-Y, Ou X, Bossdorf O, Yang J and Geng Y (2019) Transient Stability of Epigenetic Population Differentiation in a Clonal Invader. Front. Plant Sci. 9:1851. doi:
10.3389/fpls.2018.01851
Song L, Crawford GE (2010) DNase-seq: a high-resolution technique for mapping active gene regulatory elements across the genome from mammalian cells. Cold Spring Harb Protoc, 2010, pdb.prot5384.
Zhang, Y. Y., Latzel, V., Fischer, M., and Bossdorf, O. (2018). Understanding the evolutionary potential of epigenetic variation: a comparison of heritable phenotypic variation in epiRILs, RILs, and natural ecotypes of Arabidopsis thaliana. Heredity 121, 257–265. doi: 10.1038/s41437-018-0095-9
Wang Q, Gu L, Adey A, Radlwimmer B, Wang W, Hovestadt V, Bähr M, Wolf S, Shendure J, Eils R, Plass C, Weichenhan D: Tagmentation-based whole-genome bisulfite sequencing. (2013) Nat
Protoc, 8:2022-2032.
Nextera XT DNA Library Prep Kit - Reference Guide
https://support.illumina.com/content/dam/illumina- support/documents/documentation/chemistry_documentation/samplepreps_nextera/nextera-xt/nextera-xt-library-prep-reference-guide-15031942-03.pdf
Figure legends
Figure 1. Schematic representation of experimental design. (A) Daphnia were put into a water tank and
allowed to acclimate (start population). Then, two experimental tanks were set up following strictly the same design. The only difference was the presence of a predator (a guppy trained to eat daphnia) in the floating plastic fish breeding isolation box in the stress treatment. (B) S.mansoni infected snails were used
Information Classification: General
to produce cercariae that were separated into two populations, one treated with Latex in well water, the other without treatment. After one hour cercaria were used to infect mice. Adult worms were recovered at 65 days post-infection by perfusion and used for ATAC-Seq.
Figure 2. Example qPCR amplification profile for four samples. (X-axis) Number of PCR cycles.
(Y-axis) Fluorescence intensity. One-third of the maximum fluorescent intensity is shown by the orange line and the optimal number of additional cycles to perform are indicated for three example ATAC-seq libraries.
Figure 3. Examples of fragmentation profiles of ATAC-seq libraries before (A) and after size selection (B). X-axis: Base pairs. Y-axis: Fluorescence intensity. (A) Peaks correspond to nucleosome-free region,
mono- to tetra-nucleosome fractions. Bottom lane: too strong fragmentation, thus Tn5 quantity needs to be decreased. (B) Examples of BioAnalyser profiles of ATAC-seq libraries after size selection. Fragment size should be between 150 and 800 bp. Peaks at 35 bp and 10380 bp are spiked-in marker peaks for the BioAnalyser.
Figure 4. Superposed metagene ATAC profiles of four individuals after sequencing and analysis.
X-axis in base-pairs. TSS = Transcription start site, TES = transcription end site. Y-X-axis average enrichment of ATAC-seq reads over genes and upstream and downstream regions. Enrichment of accessible chromatin occurs along the entire length of the genes. The metagene profiles are almost identical for Daphnia (A), while there is more heterogeneity of the profiles in schistosomes (B). Nevertheless, the profiles are in both cases very reproducible indicating the robustness of the ATAC-seq procedure.
Figure 5. (A) Schematic representation of the measures taken on daphnia. SL = short length, LL =
Long length. (B) Boxplot of morphometric ratios of (LL-SL)/SL in control and stressed daphnia
populations (control: n = 12; stress: n = 14).
Figure 6. Combined metagene ATAC profiles of stressed and control daphnia populations. X-axis in
base-pairs. TSS = Transcription start site, TES = transcription end site. Y-axis average enrichment of ATAC-seq reads over genes and upstream and downstream regions.
Figure 7. Clustering of individual daphnia based on their ATAC-Seq profiles. Heat map indicating
similarity in the HMM ChromstaR results. Generally, samples from the stressed and the control populations each cluster together.
Figure 8. (A) MA-Plot and (B) Principal component analysis of individual schistosoma based on their ATAC-Seq profiles. MA-plots are symmetric. Red dots indicate significantly different ATAC regions in
control vs “Latex” population. On the PCA every point represents an individual male adult schistosome. Populations are colour coded. Samples from the control (blue) and “Latex” population (red) are well separated.
B. Con rol rea men
C. S re
rea men
A. S ar ing pop la ion
A. Sporocyst starting population
B. Control treatment
C. Latex treatment
Infection
Adults (“Latex”))
Adults (“Control”)
1/3
Instrument Name:
DE72901295
Firmware:
Serial#:
Assay Information:
C.01.069
DE72901295
Instrument Information:
Assay Origin Path:
C:\Program Files (x86)\Agilent\2100 bioanalyzer\2100
expert\assays\dsDNA\High Sensitivity DNA.xsy
Assay Class:
Version:
Assay Comments:
High Sensitivity DNA Assay
1.03
Copyright © 2003-2010 Agilent Technologies
Chip Information:
Chip Comments:
Type:
G2939A
Chip Lot #:
Reagent Kit Lot #:
GITR-6400
GITR-280-wo
GITR-280-c
ILC-1050
ILC-210-wo
ILC-210-c
Naive-5000
Naive-25000
GITR-5000
GITR-25000
2100 Expert (B.02.08.SI648)
© Copyright 2003 - 2009 Agilent Technologies, Inc.
Printed:
9/7/2017 11:51:39 AM
2100 expert_High Sensitivity DNA Assay_DE72901295_2017-09-07_11-02-56.xad
Page
1
of
12
Created:
Modified:
9/7/2017 11:02:55 AM
9/7/2017 11:41:23 AM
Data Path:
High Sensitivity DNA Assay
C:\...gh Sensitivity DNA Assay_DE72901295_2017-09-07_11-02-56.xad
Assay Class:
Electrophoresis File Run Summary
Instrument Name:
DE72901295
Firmware:
Serial#:
Assay Information:
C.01.069
DE72901295
Instrument Information:
Assay Origin Path:
C:\Program Files (x86)\Agilent\2100 bioanalyzer\2100
expert\assays\dsDNA\High Sensitivity DNA.xsy
Assay Class:
Version:
Assay Comments:
High Sensitivity DNA Assay
1.03
Copyright © 2003-2010 Agilent Technologies
Chip Information:
Chip Comments:
Type:
G2939A
Chip Lot #:
Reagent Kit Lot #:
GITR-6400
GITR-280-wo
GITR-280-c
ILC-1050
ILC-210-wo
ILC-210-c
Naive-5000
Naive-25000
GITR-5000
GITR-25000
2100 Expert (B.02.08.SI648)
© Copyright 2003 - 2009 Agilent Technologies, Inc.
Printed:
9/7/2017 11:51:39 AM
Created:
Modified:
9/7/2017 11:02:55 AM
9/7/2017 11:41:23 AM
Data Path:
High Sensitivity DNA Assay
C:\...gh Sensitivity DNA Assay_DE72901295_2017-09-07_11-02-56.xad
Assay Class:
Electrophoresis File Run Summary
150 300 450 600 750 bp
Instrument Name: DE13805677 Firmware:
Serial#:
Assay Information:
C.01.069 DE13805677
Instrument Information:
Assay Origin Path: C:\Program Files (x86)\Agilent\2100 bioanalyzer\2100
expert\assays\dsDNA\High Sensitivity DNA.xsy Assay Class:
Version:
Assay Comments:
High Sensitivity DNA Assay 1.03
Copyright © 2003-2010 Agilent Technologies
Chip Information:
Chip Comments:
Type: G2939A
Chip Lot #:
Reagent Kit Lot #:
L4 L5 L6
L7 L8 male1
male2 fem1 fem2
cer1 cer2
2100 Expert (B.02.08.SI648)
© Copyright 2003 - 2009 Agilent Technologies, Inc.
Printed:
20/06/2019 11:28:29
CG_Ro_2_High Sensitivity DNA Assay_DE13805677_2019-06-20_10-12-12.xad
Page
1
of
22
Created:
Modified:
20/06/2019 10:12:12
20/06/2019 11:17:47
Data Path:
High Sensitivity DNA Assay
C:\...gh Sensitivity DNA Assay_DE13805677_2019-06-20_10-12-12.xad
Assay Class:
Electrophoresis File Run Summary
Instrument Name: DE13805677 Firmware: Serial#:
Assay Information:
C.01.069 DE13805677
Instrument Information:
Assay Origin Path: C:\Program Files (x86)\Agilent\2100 bioanalyzer\2100 expert\assays\dsDNA\High Sensitivity DNA.xsy
Assay Class: Version:
Assay Comments:
High Sensitivity DNA Assay 1.03
Copyright © 2003-2010 Agilent Technologies
Chip Information:
Chip Comments:
Type: G2939A
Chip Lot #:
Reagent Kit Lot #:
3Ra12 3Ra13 3ra14
3Ra15 3ra16 3Ra17
3Ra18 3Ra19 3Ra20
3Ra21 3ra22
2100 Expert (B.02.08.SI648)
© Copyright 2003 - 2009 Agilent Technologies, Inc.
Printed:
30/09/2019 14:44:16
Rahim_3_3_High Sensitivity DNA Assay_DE13805677_2019-09-30_13-31-32.xad
Page
1
of
22
Created:
Modified:
30/09/2019 13:31:32
30/09/2019 14:32:40
Data Path:
High Sensitivity DNA Assay
C:\...gh Sensitivity DNA Assay_DE13805677_2019-09-30_13-31-32.xad
Assay Class:
Electrophoresis File Run Summary
Figure 3
D.pulex
S.mansoni
S.mansoni
D.pulex
D.pulex
D.pulex
A
B
-1.0
TSS
TES
1.0Kb
0.5
1.0
1.5
ATAC 3
ATAC 4
ATAC 2
ATAC 1
A
B
Daphnia pulex
-1.0
T66
TE6
1.0.E
0.2
0.4
0.6
0.8
genes
ATAC 68 fe_0
ATAC 63 fe_1
ATAC 61 fe_2
ATAC 611 fe_3
-1.0
TSS
TES
1.0Kb
0.4
0.5
0.6
Control 2
Latex 1
Latex 2
Control 1
-1.0 TSS TES 1.0Kb 0.0
0.2 0.4