Comprehensive Security Strategy for All-Optical Networks
Antonia Lynn Feffer
B.S. Electrical Engineering
United States Military Academy (2013)
Submitted to the Department of Electrical Engineering and Computer Science in partial fulfillment of the requirements for the degree of
Master of Science in
Electrical Engineering and Computer Science at the
MASSACHUSETTS INSTITUTE OF TECHNOLOGY
June 2015
2015 Massachusetts Institute of Technology. All rights reserved.
Author. Certified By ... Accepted By ...
ARCHIVES
MASSACHUSETTS INSTITUTE OF YECHNOLOLGYJUL 0
7
2015
LIBRARIES
Signature redacted
,. z
....
...
Department of Electrical Engineering and Computer Science May 20. 2015
Signature redacted
...
Vincent W.S. Chan Joan and Irwin Jacobs Professor of Electrical Engineering and Computer Science Thesis Supervisor
Signature redacted
...
0
(.
Leslie A. Kolodziejski Chair, Department Committee on Graduate StudentsThe views expressed in this work are those of the author and do not reflect the official policy or position of the United States Army, Department of Defense, or the United States Government.
Comprehensive Security Strategy for All-Optical Networks
by
Antonia Lynn Feffer
Submitted to the Department of Electrical Engineering and Computer Science on May 20, 2015 in partial fulfillment of the requirements for the degree of Master of Science in Electrical
Engineering and Computer Science
Abstract
Optical networking is a powerful means of communication in modem times of high bandwidth demands and high data speeds. While developments in optical networking continue to progress, however, the security implications they create have not yet caught up.
In this thesis, we characterize a selection of damaging attacks against optical networks. By providing a detailed description of the attacks, we are also able to better understand their effects across the different layers of the network model. We also propose the current best practices for sensing and detection of these attacks when they occur, as well as mitigation techniques to limit the damage they incur. The attacks are not fully eliminated, however, and so we also identify remaining vulnerabilities these attacks can exploit.
After characterizing the attacks, we propose a method for diagnosing attacks as they occur within a network given the analysis we have conducted. We also propose an algorithm for diagnosing attacks, as well as a monitoring system framework that relies on the establishment of autonomous zones of the network in order to efficiently limit damage and quarantine problem areas from the rest of the healthy network. This framework can be applied to a wide variety of network set-ups and topologies, with the ability to customize it to fit the needs of the system.
Thesis Supervisor: Vincent W.S. Chan
Acknowledgments
First and foremost, I would like to thank Professor Chan for taking me into his research group, and for all the learning opportunities and mentoring he has provided me during my time at MIT. I would also like to thank the National GEM Consortium, as well as the United States Army, the MIT EECS Department and MIT's Office for Diversity Graduate Education for providing me with financial support and the opportunity to pursue an advanced degree.
I am very grateful to all the instructors and mentors I had at West Point for providing me
with the skills and academic preparation needed to be successful at MIT. I am incredibly thankful to the NSBE Excel Scholars program and the West Point Scholarship Program for pushing me to apply to graduate school and helping me achieve that goal.
I could not have asked for a better research group to have been a part of, so I would like to
thank my fellow members of the "Chan Clan" for being supportive and making my time here very enjoyable. I am incredibly fortunate to have met so many great people during my time in Cambridge, and I am thankful to all my friends here for making this an unforgettable experience.
Finally, and most importantly, I would like to thank my family for being a constant source of support and encouragement, especially when I most needed it. I definitely would not be here today without all the love and reassurance you all have given me. I would also like to thank "the kids," especially my sister, Jianna, for pushing me to excel so that I could set a good example for all of you. In particular, I would like to thank Sam, Nana, and my mother, Eraina for believing in me and pushing me to reach my full potential.
Contents
1
Introduction... 191.1 Security Strategy Developm ent ... 20
1.1.1 Practical Security Applications ... 20
1.1.2 Com ponents of Security Planning... 21
1.2 Thesis Organization ... 24
2 Description of Attacks ... 27
2.1 Cutting/Bending/Tapping Fibers ... 28
2.2 Out-of-Band Crosstalk ... 31
2.3 In-Band Crosstalk ... 32
2.4 Repeat-Back Jamm ing ... 34
2.5 Gain Competition/Out-of-Band Jam m ing... 37
2.6 Power Transients... 39
2.7 Control Plane/Looping Attack ... 42
2.8 SNM P M odification... 43
2.9 Link State Protocol (LSP) False Advertising... 44
2.10 Sum m ary for Chapter 2... 46
3.1 Cutting/Bending/Tapping Fibers ... 49
3.2 Repeat-Back Jamming ... 58
3.3 Out-of-Band Crosstalk ... 64
3.4 In-Band Crosstalk ... 65
3.5 Gain Competition/Out-of-Band Jamming... 67
3.6 Power Transients... 70
3.7 Control Plane Attack (Looping Attack)... 75
3.8 Simple Network Management Protocol (SNMP) Modification ... 78
3.9 Link State Protocol (LSP) False Advertising... 80
3.10 Summary of Chapter 3 ... 81
4 Security Strategy Formulation ... 83
4.1 Attack Diagnosis Framework ... 83
4.1.1 Diagnoses M odel... 84
4.1.2 Algorithm for Effective Attack Response... 85
4.2 M onitoring System Implementation ... 86
4.3 Network Quarantine and Recovery Process ... 89
4.3.1 Determining Quarantine Area ... 90
4.3.2 Segmentation via Autonomous Zones... 91
4.3.3 Introduction of the Network M anagement Hub ... 91
4.4 Sum m ary of Chapter 4... 96
5 Conclusion ... 97
5.1 Sum m ary of Contributions... 97
5.2 Future W ork and Challenges ... 98
A C hapter 3 Equation D erivations... 101
D erivation of Equation 3.1... 101
D erivation of Equation 3.3... 102
D erivation of Equation 3.7... 103
B List of R eferences for Figure 1.1 ... 105
List of Figures
1.1 Attack Research by Country
Graph depicting the number of groups working on research concerning each of the optical attacks with respect to all-optical networks, categorized by country.
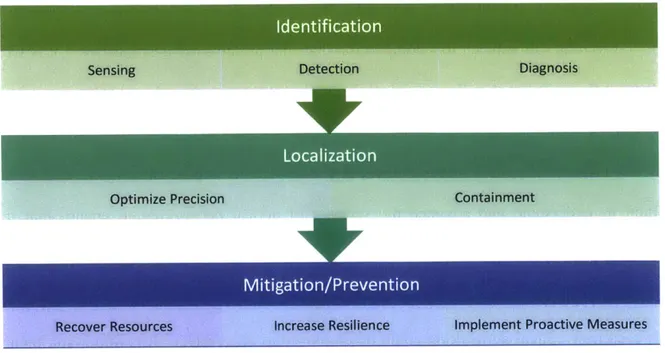
1.2 Steps in Security Development
Flowchart depicting the essential steps to follow in developing an effective security plan
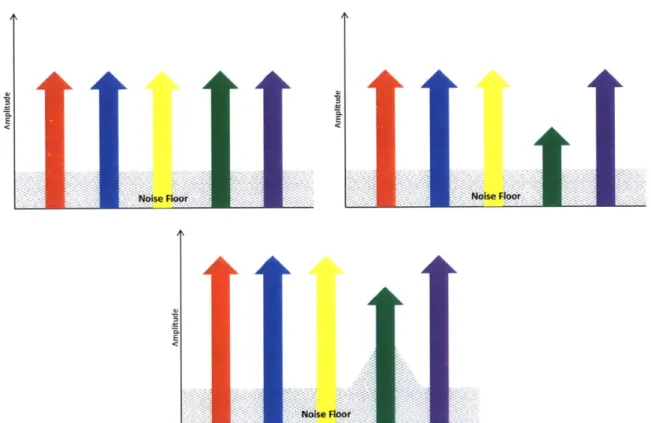
2.1 Signal Power After Power Reduction Attack
Diagrams illustrating the effects of an attack that induces a loss of power. (a) Signal strengths of a collection of wavelengths in a lightpath. (b) Signal strengths of the same wavelengths after 1green has experienced an unanticipated loss of power. (c) Signal strengths of the wavelengths shown in (b) after passing through an optical amplifier.
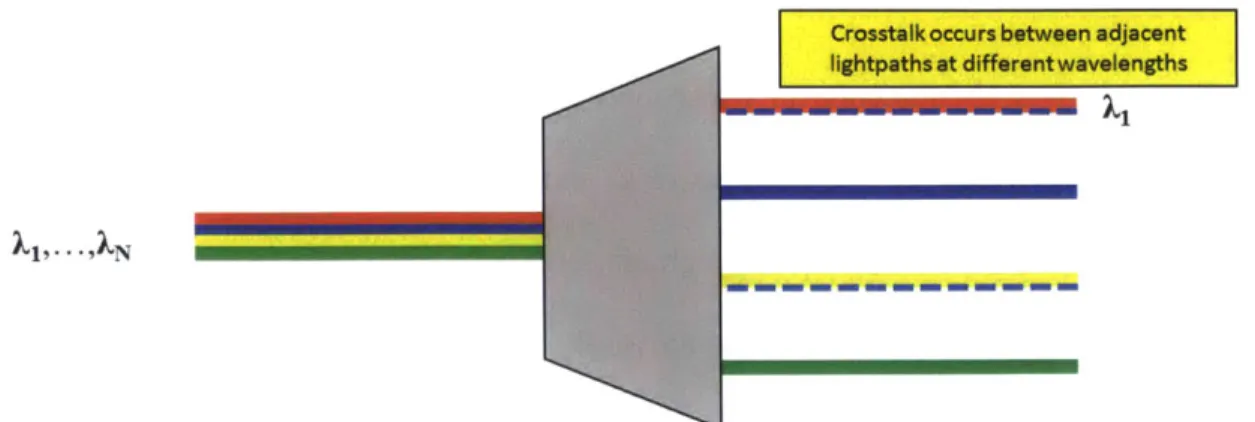
2.2 Out-of-Band Crosstalk
Figure depicting how out-of-band crosstalk can occur. Signals (commonly of a high power level) "bleed" into adjacent signals of different wavelengths, causing components
of the signals to mix.
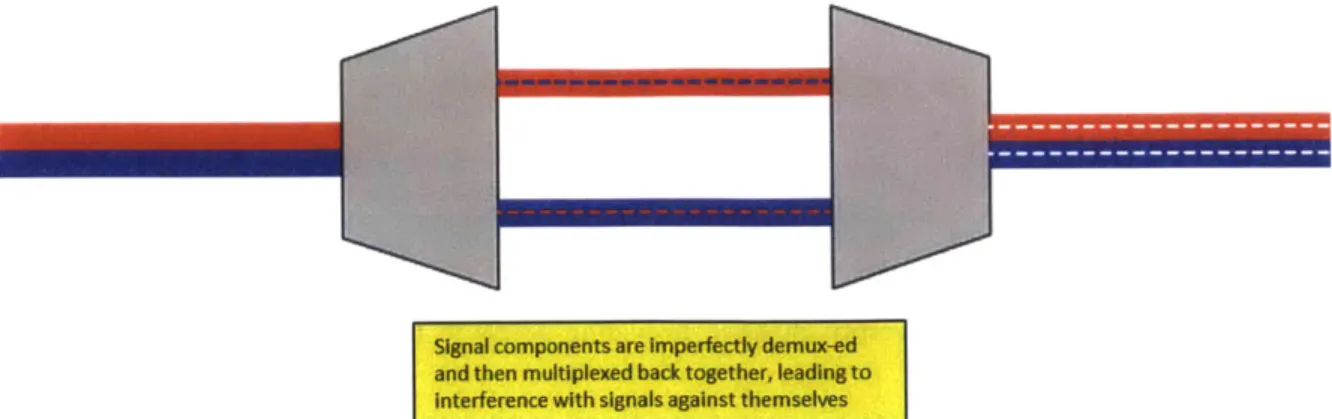
2.3 In-Band Crosstalk Attack
Figure depicting how in-band crosstalk can occur. A lightpath is separated into its component wavelengths imperfectly, resulting in fragments of the wavelengths to appear on other ports for different wavelengths. When the constituent wavelengths are recombined, the fragments destructively interfere with their original wavelength signals.
2.4 In-Band Crosstalk Eavesdropping Attack
Figure depicting how an eavesdropping attack via in-band crosstalk can occur. An attacker exploits the crosstalk over an empty switch channel to tap the traversing signal. The attacker may also inject a signal to have crosstalk imprinted on via this method.
2.5 Repeat-Back Jamming Attack
Figure depicting how a repeat-back jamming attack can occur. A signal is tapped from the channel and reinserted (reintroduced signal shown as a dotted line) back into the channel with the original signal, leading to destructive interference.
2.6 Repeat-Back Jamming Analysis
Graph showing the effects of a repeat-back jamming attack at different phase shifts (translating into delay times). The x-axis gives the amount of the original signal that is tapped away (-1 dB is equivalent to a loss of -80% of the signal), with the resulting power of the recombined signal shown on the y-axis.
2.7 Gain Competition Attack
Figure depicting how a gain competition attack can occur. A high-powered signal is injected into the channel prior to it passing through an optical amplifier. Due to the proportional nature of EDFA power allocation, the high-powered signal deprives the
other signals of upper-level photons [5], resulting in weaker gain for the other signals.
2.8 Attack via Power Transients
Figure depicting how an attack using power transients can occur. A malicious user abruptly activates a lightpath, resulting in a power transient that corrupts all other currently transmitting frames.
2.9 Power Transients Analysis
Graphs depicting effects of power transients [28]. Graph (a) depicts signal power as lightpath is activated/deactivated. Graph (b) shows the effect of a power transient as a function of varying adiabatic switching times. Graph (c) shows overshoot and undershoot of various lightpath configurations.
2.10 Control Plane/Looping Attack
Figure depicting how a control plane attack can occur. The attacker tampers with the control plane software, allowing them to alter traffic flows and network configurations. The yellow route shown is caused by malicious rerouting via the control plane.
2.11 Attack via SNMP Modification
Figure depicting how an attack via SNMP modification can occur. The attacker infiltrates the SNMP protocol and generates false status information for network components, which is then passed along to other nodes.
2.12 Attack via LSP Modification
Figure depicting how an attack via LSP false advertising can occur. The attacker tampers with the LSP protocol and generates false status advertisements, which are then propagated throughout the network via LSP.
3.1
Power Level Monitoring Localization without Redundancy
Diagram showing the spatial layout of power level monitors spaced at their maximum operational range (max range is 2 link in this scenario). When an attack occurs (denoted by red X), the precision is limited to the localization range of the device, and thus the attack is localized to an area of 2 links.
3.2 Power Level Monitoring Localization with Redundancy
Diagram showing the spatial layout of power level monitors where the monitoring span overlaps with one another, creating an effective localization range of 1 link. When an attack occurs (denoted by red X), it can thus be localize to an area of one link.
3.3 Arrival Rate Analysis for X = 50 tps
Graph showing the relationship between a value p and the probability of observing an arrival rate outside of k kp, where k is the anticipated arrival rate. It is established that the likelihood of seeing a value outside of the specified interval decreases as p increases.
4.1 Retrofitting of Autonomous Zones onto Existing Network
Figure illustrating how autonomous zones could be retrofitted over a preexisting network architecture. The red circles represent established autonomous zones, which are manually designated to ensure they meet all the qualifications for a true autonomous zone.
4.2 Depiction of Autonomous Zone (AD) Network with Network
Management Hubs (NMHs)
Figure depicting an example network comprised of communicating autonomous zones (denoted by red circle), with network management hubs (denoted by yellow boxes) that constitute a separate diagnostic network (denoted by green links).
4.3 Example of Quarantine Recovery Process Event Flow
Figure depicts the series of events generated by the quarantine recovery process in an example situation. After the first quarantine, the cost increases exponentially during the probationary period. As another quarantine is triggered during the probationary period,
the cost again increases exponentially. After the resulting probationary period, the cost reverts to the previous value until it eventually returns to its original cost.
List of Tables
2.1 Description of Select Fiber Tapping Attacks
Table compares a selection of fiber tapping attacks based upon the amount of power loss the attacked signal incurs, the ease of applying the method in a real-world setting, and the
attack's ability to be detected by network monitoring.
2.2 Classification of Common Attack Effects
Table lists common symptoms of various attacks, separated by layer. The classification of these symptoms is a combination of the layer designator (the number/letter found in parentheses next to the layer name) and the letter assignment in the left-hand column.
2.3 Comparison of Multilayer Attack Effects
Table lists the originating layer of each attack, as well as the effects the attack has across the other network layers. Uses Table 2.2 to give more detailed description of attack effects.
4.1 Diagnosis Framework for Potential Attacks
Table lists the most prominent symptoms for each attack, which is then used to develop the diagnosis scheme for identifying and treating the various attacks listed.
4.2 Diagnosis Algorithm
Table lists the steps that the algorithm uses in order to accurately diagnose an attack based on observed system operation and identified faults. Algorithm follows the attack-symptom matching found in Table 4.1.
4.3 Monitoring System Applications
Table lists the different attacks analyzed and gives the recommended sensing methods for detecting the known symptoms the attacks generate (as described in Table 4.1).
4.4 Localization Range for Optical Attacks
Table lists the smallest localization range for each attack based upon analysis done in Chapter 3 and the recommended sensing methods described by Table 4.3.
Chapter 1
Introduction
With the introduction of fiber optic technology as a replacement for copper cables in the 1970s, optical networking has been a strong source of innovation and engineering in the telecommunications industry. As demands for network capacities reach higher and higher levels as it has with the ubiquity of streaming video and other capacity-consuming applications, the use of all-optical networks becomes more and more justified.
All-optical networks (AONs) provide a tremendous amount of bandwidth, with a single cable capable of achieving a data rate of 30THz [24]. The ability to support very high data transmission rates also allows it to be relatively cost efficient, in comparison to electronic packet switching networks of the same size. AONs also eliminate the need for the regeneration of signals during transmission, as networks rely on the propagation of lightpaths from end to end.
For all the benefits of optical networking, however, there are still significant flaws in their implementation. Optical devices that are required to establish and maintain a broad, diverse network, such as optical amplifiers, switches, and cross-connects, are susceptible to a wide array of attacks that can have a crippling effect on network throughput and quality of service. The rapid growth of optical networking research and transition into the real world has outpaced the creation of defensive and protective measures to ensure that the communications are robust against attack. In this work, we seek to help close that knowledge gap and create a more secure optical networking environment.
1.1 Security Strategy Development
An essential aspect in increasing network robustness is the development of defensive and preventative measures that are effective in thwarting attack. To do this, we must first develop a security strategy, which outlines the process in which attacks are handled on either a proactive or reactive basis.
1.1.1 Practical Security Applications
The subject of optical network attacks and defense is relatively under-researched in comparison to their counterparts in electronics-based communications, the pool of knowledge is steadily increasing. The following chart, Figure 1.1, shows which attacks are being researched and where, giving a sense of who is interested in the subject and which attacks have been more
Attack Research by Country
10 4A 8 0. S6 4 E z 2 0
USA Croatia Brazil Cyprus Malaysia Tunisia Germany China UK
" Repeat Back Jamming a Gain Competition Power I ransients low-Power QoS " Out-of-Band XT N In-Band Jamming U In-Band XT N Control Plane " SNMP Mod U LSP False Ad
Figure 1.1 - Attack Research by Country. Graph displays the number of groups publishing optical network attack/security research, categorized by country.
extensively explored (full listing in Appendix B). Although the list attempts to identify all groups researching this subject, this compilation does not promise to be exhaustive - it is likely that there are groups not reflected on this graph, and there are almost certainly groups researching the topic that have not yet published findings to be catalogued. As more research is conducted, undoubtedly more vulnerabilities and exploitations will be discovered, and so it is important to understand and advance the security of optical networking to ensure that it is keeping pace.
From high-speed in home fiber connections to high-capacity military networks, it is readily seen how optical networking could be employed to great effect. It is important, then, to ensure that these networks are adequately defended against any acts of malice that would diminish the performance benefits and cause the network to fail to meet the service expectations of its users.
1.1.2 Components of Security Planning
The first step in a defensive security plan is the identification of an attack when it arises. This is achieved through monitoring of the network and checking for known signs of attacks or any other abnormalities in standard network operation. Sensing is the observation of the quality of service, processes, and actions of the network in order to characterize its behavior. Detection is the discovery of an abnormal process or action, and is usually achieved through sensing, making sensing and detection a joint concept in this context.
Another critical component of an effective security strategy is the ability to localize an attack once identified. Localization is the ability to pinpoint the origin of the event with a reasonable degree of certainty. Finding a precise point of origin for an attack can be a very challenging task
Figure 1.2 - Steps in Security Development
without exhaustive, constant monitoring of the network, but the ability to localize the origin to a limited area through the use of multiple sensors can be just as effective as a single sensor of the same small resolution. For all-optical networks, lightpaths have a long span (as much as across the continent) and attacks can be thousands of miles away and thus increases the difficulty of localization. Resolution in this case refers to the minimum size at which an event can be accurately measured or observed. Thus, as the resolution size becomes smaller, the precision in which an event can be localized increases.
At several points in this work, we use proposed methods for sensing and detection to also localize an attack. Intuitively, it can be seen that if a sensing device registers an abnormality indicative of an attack, then it can be reasonably concluded that the attack originated at some point along the span over which the device measures. This span, thus, is referred to as the localization range of the device. Using the minimum number of devices possible to fully monitor the network, the smallest area to which an attack could be pinpointed would be
In a heterogeneous network, different sensing devices may be used in conjunction with one another, leading to varying localization ranges. Introducing redundancy so that multiple devices cover the same areas can also decrease the uncertainty for where precisely an attack originated, effectively decreasing the localization range. The network resolution is defined as the greatest operational localization range at which an event can be localized in the network. As a result, the network resolution is limited by the least precise localization method in place in the network.
Once the attack has been localized to the most precise level possible, then the attack must be contained to prevent it from spreading to other areas of the network. In this work, we refer to containment of the attack to a region as a quarantine of the attack area. By quarantining the area, the attack can no longer propagate its effects outside of the containment area, thus limiting the damage it can inflict upon the network. While quarantining attack areas may impact network performance by potentially shutting down healthy areas as well, we believe the benefits are much greater in that the attack threat is eliminated from the network while under quarantine, and its damage restricted.
The final aspect of an effective security plan is having effective mitigation tactics in place to further limit the amount of damage an attack may inflict, as well as to create a more robust network that can continue to function properly despite attack. Resilience is a critical component for any mitigation strategy, both in terms of recovering from an attack and continuing on despite attack. As previously discussed, containing the problem to a limited area may be an effective solution for a time, but it should not last indefinitely; eventually, the affected area should be returned to a functional state and reintroduced into the network, restoring network resources and
bringing it back to its full operational capacity. The faster a network can recover from an attack, the better its performance and service quality.
Resiliency can also be attained through increasing the robustness of the system, making it more difficult to be completely disabled by an attack. The use of forward error correcting code is a classic example of one such method, allowing messages to still be transmitted and received correctly despite events that would otherwise hinder performance and reduce throughput.
Finally, anticipating attacks and preparing proactive automated defenses against them is an important element of attack mitigation, as it prevents issues from arising before they even begin, making it more difficult for adversaries to damage the network and even serving as a deterrent for future attacks.
1.2 Thesis Organization
The rest of the thesis is organized as follows:
In Chapter 2, we introduce the attacks this work focuses on through detailed descriptions of their mechanics. We also examine where the attacks originate and the effects that they generate across multiple layers of the network.
In Chapter 3, we delve into the aspects of the attacks required for effective security planning. First, we examine the various methods of sensing and detection that could be used for each attack. We then discuss the limitations on localizing the origin point of the attack, which is critical to efficiently eliminating the threat. Next, we cover a variation of ways in which the attacks can be mitigated and protective measures that can be put in place to proactively guard against them. Finally, we outline the remaining vulnerabilities that could be exploited by an attacker, despite the defensive measures taken to protect the network.
In Chapter 4, we propose a methodology for attack diagnosis which relies on the analysis done in the previous sections. We then define a methodology for implementing a monitoring system to best fit the requirements of an arbitrary network, allowing for flexibility and customization in application. Finally, we develop a preventative quarantine system for networks under attack that incorporates the use of autonomous zones to minimize performance loss and eliminate the threat of attack.
Finally, in Chapter 5, we conclude the thesis with a summary of our contributions and discussions of promising future areas of research.
Chapter 2
Description of Attacks
The first step in creating a successful security strategy is understanding the applicable set of challenges. The following chapter describes the known and other feasible attacks against all-optical networks (AONs) and serves as a starting point for developing an effective defense against adversarial attacks. The attacks can affect any layers of the networks, from the physical to the application layer, and even the network management and control planes. In most of the attacks known, entry at a given network layer almost always affects the performance of other layers, although those consequential effects are not often registered and/or discussed. Ultimately, the network performance the application layer sees is the correct performance metric, as the end-user experience is what is critical to acceptable network performance. The following is a list of
attacks we have considered.
1) Cutting/Bending/Tapping Fibers 2) Out-of-Band Crosstalk
3) In-Band Crosstalk 4) Repeat-Back Jamming
5) Gain Competition/Out-of-Band Jamming 6) Power Transients
7) Control Plane/Looping Attack
9) Link State Protocol (LSP) False Advertising
While the list is rather comprehensive, there is no evidence that it is anything close to exhaustive. We will discuss the techniques to identify, localize, and mitigate these attacks in Chapter 3.
2.1
Cutting/Bending/Tapping Fibers
Both cutting and bending of the fiber are attacks that originate purely in the physical layer. With cutting, an attacker cuts or nicks the fiber to create a surface imperfection, resulting in light loss with resulting performance degradations. The result of such an attack could range from degradation of service via signal power reduction to total denial of service if a fiber is irrecoverably damaged or severed.
In a bending attack, a malicious user bends the optical fiber to a point at which the angle of the light travelling through the fiber surpasses the critical angle for total internal reflection, resulting in the light radiating out of the fiber and dissipating into its surroundings. The result would be a degradation of Quality of Service (QoS), as the signal power is reduced. A malicious user could also exploit the light radiating from a fiber to use as part of a tapping scheme, intercepting user data. Table 2.1 outlines a variety of attacks mentioned in [27], classifying them
Table 2.1 -Description of Select Fiber Tapping Attacks. Attack methods are classified based upon power loss incurred by the attacked signal, the ability to perform the method in a practical setting, and the ease in which it can be detected by sensing methods.
based upon the optical power loss incurred through the. application of the method, as well as the ease of actually conducting the attack in a real-world setting, and the degree of ease to which it can be detected by sensing devices
Fiber bending is the physical bending of the optical fiber in order to radiate light out of it, as previously described. Optical splitting literally splits a signal into two identical signals via splicing of the fiber onto either end of the splitter, which is an intrusive task [27]. Evanescent coupling is similar in nature to the optical splitting method, although it achieves the tap by polishing the cladding of both the target and a capture fiber close to the core to a point at which some light could be coupled out through the adjacently-placed capture fiber, which is very difficult to achieve without the use of sophisticated equipment, although it has the advantage over optical splitting in that it does not induce service disruption [27]. V-groove cutting involves making a precision-shaped cut into the fiber cladding, which would allow light to be coupled out through the side of the fiber, resulting in very little loss, but a painstakingly complicated implementation process [27]. Finally, scattering involved the employment of an Excimer UV laser to etch a Bragg Grating onto the fiber, allowing the light to be tapped out - although being the most advanced and hardest to detect, it is also the hardest to practically execute and requires a significant amount of instrumentation [27]. For this range of tapping attacks, it is apparent that the ease of performing the attack shares a close correlation with the difficulty of detection, with the more subtle attacks being the hardest to implement.
Naturally, with a clear cutting attack, the user would see a total denial of service as the physical medium has been irrecoverably halted. A bending or tapping attack, however, would be less obvious. If a portion of the signal were radiated or tapped out, the user would see an overall decrease in power that could result in a lower signal to noise ratio, with the amount of power lost
directly affecting the packet loss rate and/or the decoded bit error rate after the error correcting code. As the lightpath continues to propagate through the network, this power reduction could become more problematic as devices like optical amplifiers will intensify the problem, as shown
in Figure 2.1. Depending on how much the quality is degraded, the signal is open to being incorrectly routed and/or triggering the transport layer protocol to slow down transmission. In the Transmission Control Protocol (TCP) for example, poor message quality could lead to erroneous packets being discarded, requiring retransmission. This, in turn, could trigger TCP to begin to decrease the window size due to perceived congestion, which substantially throttles back transmission rate, reducing throughput by as much as two orders of magnitude. Thus, the initial problem of diminished signal power is exacerbated across subsequent layers with a multiplier effect.
Noise toor Nose 4oo
Noise FtOot
Figure 2.1 - Signal Power During Power Reduction Attack; (a) Signal power levels across multiple wavelengths during normal network operation; (b) Signal power levels after reen experiences a decrease in power; (c) Signal power levels after lightpath passes through optical amplifier, amplifying noise as well as signal
2.2 Out-of-Band Crosstalk
Crosstalk is a phenomenon in which one transmitted signal undesirably affects another signal, a process which is well-known and extensively researched in electronics-based communication systems. In the optical domain, crosstalk can occur in a number of different ways, one of which is through out-of-band crosstalk. Out-of-band crosstalk occurs when a signal from one wavelength being transmitted in a channel has a detrimental effect on a neighboring signal of a different wavelength. Out-of-band crosstalk is more prevalent when high signal powers are involved [18], which is fairly unlikely in all-optical networks where signals are propagated long distances.
One of the main sources of this type of optical crosstalk is through the nonideal response of system multiplexers and/or demultiplexers [6]. Figure 2.2 illustrates how crosstalk occurs during demultiplexing - as the signal is separated into its component wavelengths, it is possible that the process is not perfectly executed, and thus the data of one wavelength can "bleed" into that of adjacent wavelengths, creating crosstalk.
Another main cause of optical crosstalk is via coupling within an optical switch. In this scenario, the switch output ports are imperfectly isolated from one another, and thus it is possible for the wavelength signals to mix and create crosstalk [18].
Although demultiplexers can be the source of crosstalk, they can also serve to decrease or eliminate it by serving as a filter and removing the elements of the attacking signal as they divide the lightpath. Optical filters can also be used to achieve the same effect, only allowing specific wavelengths to pass and consequently reducing or eliminating the attacking signal components.
Crosstalk occurs between adjacent lightpathsat different wavelengths
Figure 2.2 - Out-of-Band Crosstalk Attack. In this example, the blue and green wavelengths create crosstalk on adjacent lightpaths, denoted by the dashed lines.
While crosstalk can occur during normal system operation, the malicious induction of crosstalk could be very damaging to the network. Out-of-band crosstalk can be generated through the insertion of a high-powered signal, which is more likely to produce the phenomenon. The resulting crosstalk can lead to corrupted packets being received due to the merging of the signals, which in turn could complicate routing as the destination information becomes undecipherable, as well as lead to retransmission requests that prompt the transport layer to start decreasing its window size as a protective measure. This results in reduced throughput and an underutilization of network resources, with the resulting reduction in capacity possibly felt by the end-users.
2.3
In-Band Crosstalk
Another form of crosstalk is known as in-band crosstalk, in which a signal of the same wavelength detrimentally affects another signal. Due to the fact that the crosstalk occurs on the same wavelength throughout the attack, it can be much more damaging than out-of-band crosstalk, as the attacking signal is indistinguishable spectrally from the benign signal.
A main source of this type of crosstalk also stems from multiplexing/demultiplexing. An example of this is shown in Figure 2.3. Due to the poor isolation of the ports of the device, a
Signal components are Imperfectly demux-ed and then multiplexed back together, leadingto
Interference with signals against themselves
Figure 2.3 - In-Band Crosstalk Attack. In this example, components of other lightpaths are not fully separated, creating destructive interference when recombined (denoted by dashed white lines).
small fragment of each wavelength signal can leak onto the ports reserved for other wavelengths during demultiplexing; when eventually multiplexed back together, those small signal fragments will be combined with everything else in the unified channel, resulting in crosstalk effects on a wavelength from delayed (phase shifted) components of itself [4]. The poor isolation of switch ports can also cause in-band crosstalk in the same manner as out-of-band crosstalk.
The resulting crosstalk can lead to destructive interference of the signal against itself, as the juxtaposed components are recombined. This could, in turn, diminish the signal quality to a point where the messages are no longer readable by the receiver, causing network and transport layer issues like those in an out-of-band jamming attack, and causing network throughput to suffer. Crosstalk in general is an attack that can propagate with relative ease, as most times it can be initiated by a comparatively high signal power, and thus it is important to cut off the attack before its effects are disseminated through the network.
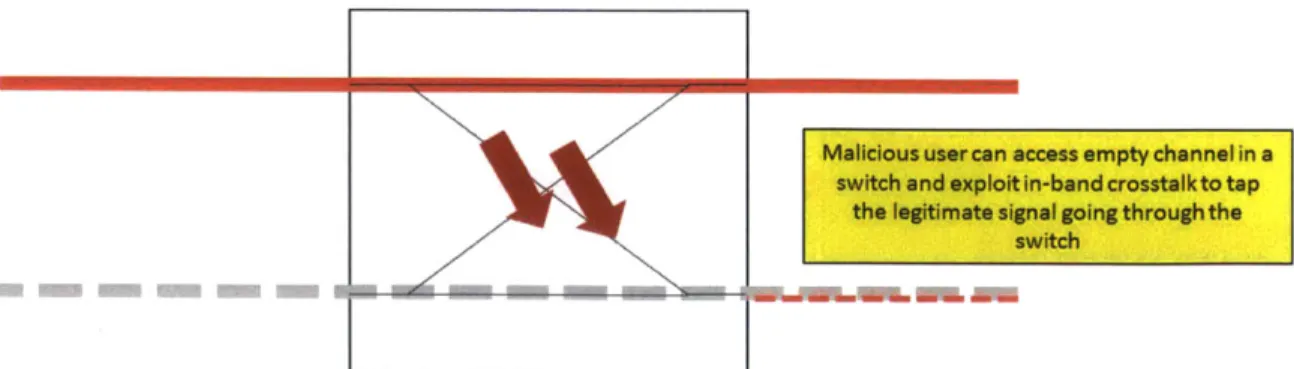
An attacker may also exploit naturally-occurring crosstalk to "eavesdrop" on signal transmissions passing through a switch, as illustrated in Figure 2.4. By accessing an empty channel, a malicious user can effectively tap a signal, picking up a portion of the signal
I I
Malicious user can access empty channel in a switch and exploitin-band crosstalkto tap
the legitimate signal going throughthe
switch
Figure 2.4 - In-Band Crosstalk Eavesdropping Attack. In this example, natural crosstalk from the
red signal is picked up on the empty channel, providing access to the signal information via an
artificial tap.
traversing the switch through innate crosstalk (the causes of which have been previously described) [4].
With access to the signal, and perhaps the data, being transmitted, the malicious user can learn more about the network, or even use the signal for other nefarious purposes, such as repeat-back jamming, described in the next section.
2.4
Repeat-Back Jamming
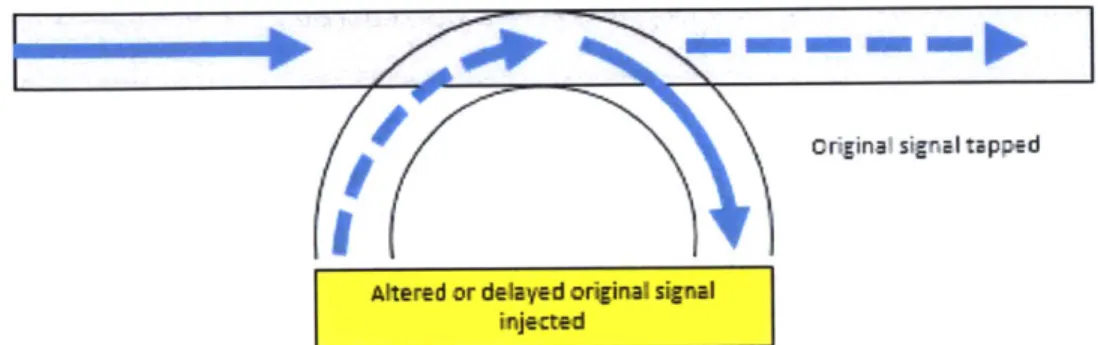
In a repeat-back jamming attack, a malicious user taps a portion of a signal from a fiber and re-inserts it into the fiber after some delay. The resulting signal is thus a coherent combination of the original signal and the reintroduced signal, as shown in Figure 2.5. Although mentioned in [4] and [5], this attack has not been described in detail or characterized before.
In such an attack, the signal deteriorates due to the mismatched phases of the original signal and the reintroduced, delayed signal, leading to destructive interference and quality degradations. This type of attack is especially difficult to detect due to the use of interference that looks like the signal against itself. When done at a level slightly higher than the level of acceptable signal quality, it seems as if the signal has naturally deteriorated. Attack propagation for long haul optical lightpaths is another concern from this attack, as a small signal deterioration can be exacerbated as the signal travels through optical amplifiers and other various components,
original signal tapped
Altered or delayed original signal
injected
Figure 2.5 - Repeat-Back Jamming Attack. In this example, a portion of the blue signal is tapped out and reintroduced after some delay, incurring a phase shift (denoted by dashed line). The signals then recombine, causing destructive interference.
making the point of origin of the attack extremely difficult to locate. In particular, the signal to noise ratio of the attacked wavelength is diminished, particularly after picking up more ASE noise of subsequent amplifiers, and even after equalization, the signal to noise ratio will not recover.
Repeat-back jamming makes the signal vulnerable to destructive interference of the delayed signal against the original signal. The amount of phase shift incurred is a function of the delay introduced into the system, most easily accomplished through the rerouting of a signal through an arbitrary path before reintroducing it. This phase shift can be calculated using the
following equation, where d is the length of the path and A is the wavelength of the light.
O = 2rd (2.1)
Depending on their relative strengths and the amount of phase difference between them, the signal could be dramatically diminished. The following equations give the resulting signal strength, S, and magnitude of phase change,
en,
after a repeat-back jamming attack with AO representing the overall phase shift (modulo 2a) between the original and delayed signals, and S,Sn = S'2 + Sdz + 2SoS cos(AO) (2.2)
61 = sin-, (2.2)
so + S', cos(AO)
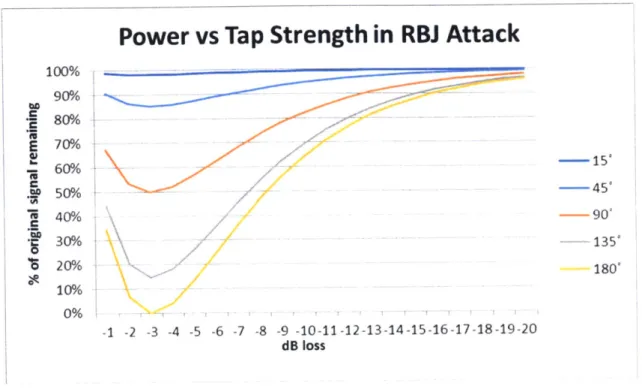
The effectiveness of a repeat-back jamming attack is a function of both the tap strength and the added delay (in the form of a phase shift) induced by the attacker. Figure 2.6 shows this effectiveness by comparing phase shifts of the reintroduced signal across different tap strengths (with the tap strength being the strength of the reintroduced signal), and the resulting effect on the continuing signal.
The most detrimental effects amongst any amount of delay are when -3dB of the original signal is tapped, which is approximately 50% - the amount of the remaining original signal is approximately equal to the amount that is tapped and then reintroduced. For a smaller tap percentage, an optical amplifier can be used to boost the small amount of tap signal to the same strength of the pass-through signal. Overall, the most devastating phase shift is when the two signals are 1800 out of phase, which intuitively makes sense. It is hard for the attacker to determine exactly what fiber delay constitutes a 180 degree phase shift, but all that has to be done is to either modulate the delay fiber length (as in using a stretcher) or an electronic phase shifter that can be varied over 27c phase shifts, creating deep fades often enough to completely disrupt network operations.
Although repeat-back jamming seems benign in appearance, the effects of the attack are readily seen across many network layers. Even without seeing the intrusion of the malicious user
into the network, the introduction of a moderate to extreme phase shift has very visible effects
-'Although correct in magnitude, the quadrant in which the phase is located depends upon the originating quadrants of the original and delayed signal phases.
Power vs Tap Strength in RBJ Attack
100% 90%/ . 80% E 70% 60% -15 50% -45# 40% -90' 135' r 20% 180' 10% 0% -1 -2 -3 -4 -5 -6 -7 -8 -9 -10-11-12-13-14-15-16-17-18-19-20 dB lossFigure 2.6 - Power vs Tap Strength in Repeat-Back Jamming Attack. Graph shows amount of original signal power lost according to the amount of power tapped out and reintroduced, for a range of different phase shift amounts
the phase shift results in a decrease in signal power that is characterized above. Similar to the effects of a tapping attack, this decrease in signal power can lead to incorrectly received messages that cannot be recovered in the data-link layer. This can lead to routing issues in the network layer and trigger a response in the transport layer after an excessive amount of retransmission requests, once again amplifying the link layer problem and substantially reducing the overall transmission rate (by as much as 20dB).
2.5
Gain Competition/Out-of-Band Jamming
In a gain competition attack, also known as out-of-band jamming, a malicious user exploits the physical properties of an EDFA amplifier to degrade the performance of the overall
channel. To do this, an attacker gains access to a single wavelength channel and injects a high-powered signal into the stream, as illustrated in Figure 2.7.
An EDFA amplifier works by allotting its amplification power proportionally to the incoming signals within its wavelength range, and thus when a sudden, significantly higher-power signal is introduced while the other legitimate signals stay at the same magnitude, it is allotted a much higher proportion of the power, and thus the power of all other legitimate signals is reduced. This can lead to attenuation of the legitimate signals, and thus a higher bit error rate and service degradation. With a single gain competition attack, a malicious user can affect many wavelengths at once. The disproportionate power across different wavelengths will also propagate if allowed to go unchecked, causing greater signal deterioration as it passes through more amplifiers, each of which causes a more dramatic gain competition attack.
Similar to previous attacks covered, the damage from gain competition essentially comes from diminished signal power. The difference, however, is that in the case of gain competition, the signal itself is not tampered with; instead, the signal is weakened as it is robbed of the full amplification it requires to continue to efficiently propagate. As the signal becomes weaker, it runs into the same issues that an attenuated signal would face - messages possibly being
Gain is proportional to input power, so malicious signal
becomes dominant High-power signal
inserted
Figure 2.7 - Gain Competition Attack. In this example, the high-powered green signal enters the EDFA amplifier, leading to disproportional power allotment and weakening the output power of the legitimate signals.
received incorrectly and undecodable by the data link layer, resulting in routing issues and triggering of window-closing of the transport layer protocol. Gain competition affects many wavelengths at once, as every lightpath but the offending one suffers, and thus network throttling and diminished performance can occur very quickly, as many lightpaths are generating retransmission requests and causing the TCP windows to rapidly decrease and reduce throughput to essentially one packet per roundtrip time. From the end-user perspective, it will appear as if
something is wrong with the channel itself, as transmission rates are suddenly throttled back drastically and virtually all lightpaths are affected.
2.6
Power Transients
During benign system operation, small power spikes can occur as lightpaths in a channel abruptly become active. This momentary pulse, if unchecked, will unfortunately corrupt any data frame that is also being transmitted at that time, which could cause the need for retransmission of that frame [29]. Figure 2.8 illustrates this phenomenon, which outwardly appears very similar to gain competition. A key difference is that power transients are very abrupt and are only momentarily present, whereas in gain competition, the offending signal is free to persist as long as desired.
is R a M 6 M M a 2 a M a 6 0 a a a a ag
signal isbruptly Abnupt change create power transients inserted in all wavelengths seved by the same
Figure 2.8 - Attack via Power Transients. In this example, the green signal injects an abrupt power transient, caused by turn-on of the lightpath, resulting in the data frames of all other lightpaths to be
Figure 2.9(a) is a graphical representation of the physical event of a wavelength lightpath being activated, or "added," and subsequently "removed" in the form of a step function. The momentary spike in power when the lightpath is added is referred to as the overshoot, and the sudden, dramatic lapse in signal power as the lightpath is removed is to referred to as the undershoot. The amount of overshoot (and conversely, the undershoot) is a function of the actual process of activating the lightpath, as well. Figure 2.9(b) shows this relationship between the overshoot amount and the switching time, which is the time it takes to switch the lightpath on
- the faster the switching time, the greater the overshoot. For a legitimate user, the proper technique to use during turn-on to avoid affecting the other users is called adiabatic switching, which uses a gradual switching process to induce turn-on slowly, over a period of -5
milliseconds, instead of abruptly. However, an attacker would not be as cooperative and can inflict the maximum damage by turning on as a step function or even as close to an impulse as possible.
The presence of gentle power transients due to adiabatic switching are expected during normal system operation and are not indicative of any sort of attack, but the injection of malicious, large power transients can have a devastating effect on network performance. An attacker may force power transients to occur through access to a physical lightpath, turning on and off as desired. Thus, the attacker can exploit power transients to corrupt frames at will on other lightpaths and at multiple times, leading to issues in higher layers of the network.
This attack can vary from moderate to severe depending on the frequency at which these power transients are introduced. Although originating in the physical layer, this attack hits the data-link and upper layers hard as it damages all simultaneously transmitted frames, necessitating retransmission if they are beyond recovery. The affected frames also create
. . . 24.0 .. . . . Overshoot -24.5 -10 -Add X E E -25.0 -12, ON W-14 -- 25.5-0 0 --16 -26.0 Switching Time -0.01 ms -26.5 - 0.1 ms - Ims -20 -27.0- 6 ms -22 *Remove X - 10 ms , .. .1 -27.5 400 500 600 700 800 900 10 15 20 25 30 35 Time(ms) Time (ms) 1.6
-- Start 2 Add 1 Overshoot
1.4 I- Start 2 Add 1 Undershoot
--- Start 4 Drop 1 Overshoot
12-- Start 4 Drop 1 Undershoot
0
0.4
0
-0.2
10 10 10 10
Switching Time (ins)
Figure 2.9 - Graphs Depicting Effects of Power Transients 1281: (a) depicts signal power as lightpath is activated/deactivated, (b) shows the effect of a power transient as a function of varying adiabatic switching times, (c) overshoot and undershoot of various lightpath configurations
network layer routing issues if they are not discemnable, and the rapid influx of retransmission requests could prompt the transport layer protocol to decrease the window size, potentially severely curbing network transmission capabilities, and even causing the network to oscillate. Due to the momentary nature of these transients, from the end user perspective, it would
just
appear as if packets were arbitrarily being corrupted and dropped, and network performance was consequently diminished.
2.7
Control Plane/Looping Attack
In an all-optical network, the control plane functions as the entity which manages and directs all the network devices in the area. Thus, network settings and configurations and the establishment of connections for traffic are ultimately regulated by the control plane. It is clear, then, to see how a malicious user having access to this plane can be devastating for the network. In the "looping" attack, this malicious user gains access to the control plane and configures it to unnecessarily reroute an incoming signal to a previous point or even some other point not in the original lightpath before continuing forward to its intended destination, as shown in Figure 2.10.
If the signal is not able to continue on the same path, due to being placed in an infinite loop or simply discarded, it results in a complete denial of service as the signal becomes trapped or lost. Even if the signal is able to get out of the loop and continue on the designated lightpath, a new set of issues may arise due to the potentially significant delay and extra amplified spontaneous emission (ASE) noise incurred - reception issues could be caused by the excessive travel time, resulting in dropped or delayed packets. This attack is especially difficult to handle, as it looks like legitimate network operation with the control plane handling scheduling and traffic flows, or even appearing to be diagnostics running during normal network operation. Another critical aspect of this attack is that the control plane can, and often does, oversee the entire network, meaning that a nefarious user only needs to gain access at a single point to inflict
Sgnal traverses nodes normally until it reaches malidous node, where it Is m-routed to a predetermined location
signal is essentialtv "looped" as it reaches previous node and then continues on its intended path, resulting in a potentially significant delay
Figure 2.10 - Control Plane Attack. In this example, the routing of the red node is modified to redirect to a previous point, deviating from its intended path.
damage anywhere within the network itself Localization, thus, is a daunting task, with no real clues as to the true origin point of the attack. It is possible that the detection scheme must be done at the cyber level where the control plane is being attacked electronically.
A control plane attack originates at the network management and control layer, but its effects are able to trickle down significantly into lower layers. Looping, for instance, interferes with established routing in the network, generating paths that are not efficient or possibly not even valid. Looping and other significant delays caused by this attack will also trigger a response by the transport layer protocol, causing it to perceive congestion in the network and decrease the TCP window size to preserve communication. This, of course, exacerbates the problem, causing transmission to be throttled in an otherwise healthy network.
2.8
Simple Network Management Protocol (SNMP) Modification
The Simple Network Management Protocol (SNMP) serves as a common management protocol for network devices (i.e.: status updates, configuration data, etc) [17]. By hacking into and tampering with the SNMP protocol, a malicious user can circumvent normal network operation and cause data transmission to deviate from intended routes via switches and other devices under SNMP control. Figure 2.11 illustrates one such attack via SNMP modification.
The attacker thus has the ability to generate false status updates and consequently modify routes, even making some legitimate routes invalid. The result could be anything from significant time delays to outright denial of service. There is no glaring outside indication that SNMP has been modified or abused, so this type of attack is very challenging to detect. Newer version of SNMP, such as SNMPv3, attempt to fill in some of the security gaps of its predecessors through additional protection measures such as authentication [17], but most
SNPAP protocol is modified to circumvent normal operation and deviate from intended routers and/or switches
Figure 2.11 - Attack via SNMP Modification. In this example, the status of the blue node is falsely updated to unavailable via SNMP, resulting in suboptimal network performance.
existing networks continue to use older versions of SNMP, as there is not much perceived push to make the potentially costly and cumbersome switch.
SNMP modification attack is a particular subset of a control plane attack, with network
management being manipulated through this application layer-based protocol. Through this application layer access, an attacker can trigger the same routing and transport layer issues as in the aforementioned control plane layer attack through the propagation of false SNMP information. It may not be as fast as a control plane attack due to this required processing and subsequent propagation time, but the potential for inflicted damage on the network is still great.
2.9
Link State Protocol (LSP) False Advertising
The Link State Protocol (LSP) is an active network routing protocol that relies on nodes propagating their and others' statuses in order to give every node an idea of what the network looks like and which routes are available and efficient. By accessing and tampering with the
LSP, a malicious user can generate and subsequently propagate false status updates, which are trusted by the other benign nodes. For example, an attacker may falsely claim that a node is down or a route invalid, leading to delays and possible congestion. It can also advertise a superior-performing node, causing routing to that compromised node for any of the attacks noted above. In the example in Figure 2.12, LSP false advertising has lead the nodes adjacent to the blue node to believe that it is no longer viable for routing purposes, even though it is operating
normally.
Conversely, the attack could be designed to claim that an invalid route is actually valid, leading to packet loss and denial of service. Not only does this type of attack create congestion and impede communication, but it also diverts valuable resources as the network tries to alleviate the situation.
Although originating in the network layer, this attack is very similar in operation to an attack via SNMP modification. The false information in this case is propagated through the link
state protocol, and results in the same triggering of network and transport layer responses.
LSP
Advertisements
Links and/or nodes u famsel advertised as being unavailable or ate higher cost through Link State Protocol. Can also cause looping via false advertisements of low cost
links.
Figure 2.12 - Attack via LSP False Advertising. In this example, the LSP is modified to generate and propagate false unavailability advertisements for the blue node, leading to suboptimal network performance.
2.10 Summary for Chapter 2
From the attack descriptions, it is apparent that these attacks have far-reaching effects that transcend the attack's origin layer. Table 2.2, below, outlines some of the common issues that arise within the different layers of the network due to attacks like those described above. Table 2.3 lists the originating layer for each of these attacks and uses the classification system from Table 2.2 to illustrate how far-reaching the effects of these attacks actually are. The attack effects in Table 2.2 are classified by their origin layer (the layer number is found in parentheses in the top-most row of the table) and by the corresponding letter in the left-most column of the table. An effect of signal attenuation, thus, is classified as lB. Table 2.3 utilizes this classification system to make it easier to compare the multilayer effects of each attack.
The fact that attacks like these span several layers is often overlooked in in attack defense analysis, resulting in security solutions that only partially solve the issues arising from these attacks. An effective security solution needs to take a multi-layer approach to the problem in order to best protect the network. The following chapter expands upon these attacks, using their properties to determine the best way to detect and sense them, as well as localize the attacks within the network and mitigate the damage caused.
Physical (1) Data-Link (2) Network (3) Transport Application Network
(4) (7) Management
& Control
(N)
Total loss Incorrectly Indecipherable Triggering Protocol Deviation of fiber received messages of TCP operation from A medium messages creating window deviation, normal,
requiring routing issues closure less efficient
retransmission efficient operation
Signal Messages B attenuation routed incorrectly, potentially lost C Crosstalk occurs D Destructive interference
Table 2.2 -Common Issues Across Network Layers. Common results of network attacks, categorized by layer (noted in parentheses) are presented, with identifying letter designators in the left-hand column.
Attacks
Cutting/Bending/Tapping Origin Cutting or bending of the
fiber
Effects lA/lB 2A 3A 4A
(multiple) Gain Competition Origin Insertion of
high-powered
signal
Effects
LB
(multiple) 2A 3A 4APower Transients Origin Maliciously generated
power transients
Effects IB (multiple) 2A 3A 4A
Out-of-Band Crosstalk Origin High-powered signal insertion
Effects 1C 2A 3A 4A
In-Band Crosstalk Origin High-powered
signal insertion
Effects 1C 2A 3A 4A
In-Band Crosstalk - Origin Exploitation of Eavesdropping empty channel
Effects 1B, 1C 2A 3A 4A
Repeat-Back Jamming Origin Tapping and reinsertion of delayed signal
portion
Effects ID 2A 3A 4A
Control Plane Attack Origin Control
plane exploited Effects 3B 4A NA SNMP Modification Origin SNMP exploited Effects 3B 4A 7A NA
LSP False Advertising Origin LSP
exploited
j Effects j j 3B 4A NA
Table 2.3 -Attack Effects by Layer. The table lists the originating layer for each attack, as well as the effects experienced across the various network layers as a result. Table relies on common network issues experienced
Chapter 3
Sensing, Detection, Localization, & Mitigation
With a working knowledge of what the outlined attacks are, this chapter focuses on what can be done to prevent them from bringing down a network. The key to an effective security solution against any attack is being able to sense its effects and detect its presence, localizing it to pinpoint where the attack is originating from, and mitigating the damage that it can inflict while subsequently eliminating, or at least isolating, the threat.
While none of these attacks are fully addressed, and methods for mitigation fully developed, we present the current best practices for combating these attacks, as well as an idea of what remaining vulnerabilities exist that could still be exploited.
3.1
Cutting/Bending/Tapping Fibers
Sensing and Detection Capabilities
i. Power Level Monitoring
Although an attack that outright severs the fiber would be easy to identify, lesser symptoms of an attack are more difficult to identify. With power level monitoring implemented in the network as a diagnostic tool, it is possible to determine if a significant portion (above a user-specified threshold) of light in a fiber or from the channel is being radiated or dissipated through either bending or tapping schemes. Power level monitoring can be performed by a variety of devices, including power meters, optical loss test sets