Publisher’s version / Version de l'éditeur:
Philosophical Magazine, 36, 6, pp. 1385-1404, 1977
READ THESE TERMS AND CONDITIONS CAREFULLY BEFORE USING THIS WEBSITE. https://nrc-publications.canada.ca/eng/copyright
Vous avez des questions? Nous pouvons vous aider. Pour communiquer directement avec un auteur, consultez la première page de la revue dans laquelle son article a été publié afin de trouver ses coordonnées. Si vous n’arrivez pas à les repérer, communiquez avec nous à [email protected].
Questions? Contact the NRC Publications Archive team at
[email protected]. If you wish to email the authors directly, please see the first page of the publication for their contact information.
Archives des publications du CNRC
This publication could be one of several versions: author’s original, accepted manuscript or the publisher’s version. / La version de cette publication peut être l’une des suivantes : la version prépublication de l’auteur, la version acceptée du manuscrit ou la version de l’éditeur.
Access and use of this website and the material on it are subject to the Terms and Conditions set forth at
Dislocations in ice as revealed by etching
Sinha, N. K.
https://publications-cnrc.canada.ca/fra/droits
L’accès à ce site Web et l’utilisation de son contenu sont assujettis aux conditions présentées dans le site LISEZ CES CONDITIONS ATTENTIVEMENT AVANT D’UTILISER CE SITE WEB.
NRC Publications Record / Notice d'Archives des publications de CNRC:
https://nrc-publications.canada.ca/eng/view/object/?id=31be5dc2-cd3c-4491-b86b-c9ab27295991 https://publications-cnrc.canada.ca/fra/voir/objet/?id=31be5dc2-cd3c-4491-b86b-c9ab27295991o.+
.
"
National Research
Conseil national
\ ICouncil Canada
de
recherches Canada
Sctr,
-
DISLOCATIONS IN ICE
AS REVEALED BY ETCHING
Reprinted, from Philosophical Magazine Vol. 36, No. 6, 1977 p. 1385-
1404 DBR Paper No. 762Division of Building Research
peut Btre appliqu6 pour fins particuli'eres en pr6parant l a s u r f a c e
2
l'aide d'un microtome et en faisant v a r i e r l a concentration e t l16paisseur du corrosif caustique, l a t e m p e r a t u r e et le temps de sbchage. I1 a kt6 possible de r e p r o d u i r e l e s figures de corrosion sous f o r m e de s t r i e s pour l e s dislocations s u r l e s plans de b a s e et a u t r e s , dtablissant a i n s i directement le r a p p o r t e n t r e l e s figures de c o r r o s i o n e t l e s d6fauts de ligne. Cette technique a s e r v i ?I 6tudier l e mouvement d e s disloca- tions a u t r e s que s u r l e plan de b a s e dans d e s champs de contraintes unifor mes e t non uniformes. Cette m6thode p e r m e t de d6celer l e s d6fauts inherents e t l e s disloca- tions a u t r e s que s u r le plan de base.Dislocations in ice as revealed
by
etching
BY N. K. SINHAGeotechnical Section, Division of Building Research, National Research Council of Canada, Ottawa, Canada
[Received 28 June 19771
The process of etching and replicating ice surfaces has been investigated. It has been shown that the process can be made selective for specific ~ u r p o s e s by preparing the surface with a microtome and by varying the concentration of the etchant, thickness of the etchant, temperature and drying time. Replication of etch-pits in the form of whiskers was possible for both basal and non-basal dis- locations, thereby directly establishing the correspondence of etch-pits to line defects. The technique was used to study the movement of non-basal dislocations under uniform and non-uniform stress fields. Grown-in defects and non-basal dislocations could be revealed by the method.
The etching of crystal surfaces is widely accepted as a powerful method of observing lattice defects and their behaviour. In recent years this has been extended to ice. The problems encountered in ice, however, are different from those in other materials, mainly because the working temperatures are so close to its melting-point.
The present investigation was carried out to develop a better appreciation of the processes involved in etching of ice. I t was hoped that a technique could be developed that would allow dislocations to be identified without ambiguity. The technique would be of great value for the interpretation of the role of dislocations in the processes of deformation and fracture of single as well as polycrystalline ice. This report covers mainly the development of an etching and replicating technique and its application to the study of non-basal dislocations and etch-pits on the (0001) plane. The application of the tech- nique to the study of glide dislocations and etch-pits on the first prismatic faces (lOTO), second prismatic faces (1120) and other faces is mentioned briefly.
1.1. Review of literatare
Higuchi (1957, 1958) presented a technique of developing etch-pits on the surface of ice by applying a dilute solution (1
%)
of polyvinyl formar (Formvar) in ethylene dichloride and allowing the plastic film to dry. Kuroiwa and Hamilton (1963) showed that the etch-pits produced by Higuchi's method hadI no direct correlation with crystal imperfections but were produced by evapora-
tion through tiny holes in the film. The shape of the evaporation pits depends
on crystallographic orientation of the etched surface; the method has been widely used for petrographic analysis.
Kuroiwa and Hamilton (1963) also showed that a more concentrated solution of Formvar (5 to 6% in ethylene dichloride) was a suitable etchant for de- veloping etch-pits on the basal plane corresponding to the emergence of non- basal dislocations on this surface. Dislocation etch-pits on the (0001) lane servations of Muguruma ( 1961).
1
were found to be hexagonal pyramidal, in agreement with the earlief ob- The earlier investigators' conclusions on the association of etch-pits with dislocations were based on indirect though convincing evidence, whereas later work provided direct evidence by the movement of dislocations under stress. Some of these observations were later confirmed by Levi, De Achaval and Suraski (1965). Further progress was made by Kuroiwa (1969), who looked a t Formvar replicas with a scanning electron microscope with the resolution and depth of field required for investigating the three-dimensional topography of etched surfaces of ice.
A review of the literature shows that there are still many unanswered questions. For example, the dimensions of the etch-pits were reported by Muguruma (1961) to be 0.2 to 6 p, whereas the corresponding sizes obtained by Kuroiwa and Hamilton (1963) were 50 to 100 p, and the diameters of the pits presented in the photographs of Levi et al. (1965) varied from 10 to 15 p.
Muguruma (1961) observed many stepped and spiralling etch-pits, whereas the others did not. Etch channels have been observed by Kuroiwa and Hamilton (1963), Muguruma and Higashi (1963), and Levi et al. (1965). The length of the channels varied from a fraction of a micron to several microns, and both tapered and non-tapered channels have been observed. NO ex- planation is yet available on the geometric features of these channels in ice.
Glide dislocations in the basal plane are considered to take the dominating role in the viscoelastic flow of ice. These dislocations emerge on the prism planes of the crystal, and etch-pits ascribed to them have been indistinct. They have been observed only by X-ray techniques (Fukuda and Higashi 1973, Jones and Gilra 1973) in carefully prepared single crystals of ice of low dislocation density. These techniques cannot be applied readily to ordinary polycrystalline ice because of the limitations imposed by the resolution of the method and other inherent difficulties. It was realized that the etching technique would require further development in order t o be used to reveal glide dislocations in the basal plane.
5
2. ANALYSIS OF THE ETCHING PROCESSThe preferential dissolution of water molecules from ice to the surrounding medium is the basic factor that controls the etching process. This preferential removal is governed by the difference in free energy between the undisturbed surface and the site of an imperfection. The surface free energy, as a measure of the difference between the energy of an atom a t the surface and one in the interior, is a function of temperature and of the medium to which the surface is exposed.
Theoretical analysis of the phenomena of preferred dissolution a t dislocation emergence sites in solids has been discussed by Cabrera (1956). He came to the conclusion that the success of forming good etch-pits a t the sites of im- perfections would depend on how much the surface energy was decreased near
Dislocatzans in ice by etching 1387 hhe defects by the imposed conditions of etching. The analysis bears close resemblance of the description of crystal growth and preferred evaporation by a dislocation mechanism given by Frank (1952). This description appears to be reasonable for the case of thermal etching of ice under saturated conditions as can be appreciated from a study by Krausz and Gold (1967).
The difference in free energy between the point of emergence of individual dislocation lines and the surface is small in comparison with differemes as- sociated with grain boundaries, well-developed slip planes, and relatively small-angle boundaries containing numerous dislocations (Weertman and Weertman 1964). Saturating the environment surrounding the ice specimen appears to have controlled. the surface energy to a sufficient degree as to allow Krausz and Gold (1967) to observe etch features corresponding to large linear imperfections a t - 1O0C, but not dislocations. Observations made by the present author a t - 30°C suggested that dislocation bundles and grown- in dislocations could be revealed by this method. It was apparent that the thermal etching of ice in air depends on both relative humidity and temperature. The specific free energy for the ice-water interface, y,, (30 erg/cm2), is less than one-third of the ice-vapour interface, y,, (109 erg/cm2) a t 0°C
(Ketchum and Hobbs 1969, Hesstvedt 1964, Fletcher 1975). There is, therefore, a possibility of using water as the medium for etching. The method is not practical for most cases, but the possibility was demonstrated by the fact that Truby (1955) observed etch-pits on the basal plane of growing ice surfaces. Drost-Hansen (1967) considered such pits to be due to dislocations.
Surface-water molecules in ice dissociate in ethylene dichloride. Formvar dissolved in it should act as the retarding agent and the concentration of the solution should affect the rate of dissociation. I n practice, etch-pits are obtained by pouring a thin layer of the solution on the surface and allowing the solvent to evaporate under the ambient conditions of a cold room. The process not only etches the surface but makes a Formvar replica a t the same time; this is a great advantage and explains its continued use. This dual use for the etchant, however, complicates the process of dissociation. The rate of removal of water molecules from the ice surface to the solution depends upon the concentration of water already in the solution. This concentration changes during etching owing to the evaporation of the solvent.
The lack of understanding of this dual etching and replicating process seems to have misled previous workers and indirectly retarded development and application of this powerful method. A few examples will be cited here for clarification. Truby (1955) claimed to have developed a procedure of etching ice surface by a blast of cold and dry air a t - 15°C for 20 min. He demonstrated his etching technique by replicating the surface with 1% Form- var solution and observing the replica with a transmission electron microscope. Muguruma (1961) also made a similar claim of developing thermal etch-pits by allowing a surface with a mirror finish obtained by the Higuchi method to evaporate slowly for a few minutes a t - 25°C and then replicating the surface with a 0.5% Formvar solution. The two procedures used by these authors do not act in the way that was attributed to them. Observation by the present author of an ice surface with a mirror finish under a high-resolution optical microscope indicated that neither of the procedures for etching in air was successful in developing pits corresponding to micro-defects. Both
investigators, however, replicated the surface wjth a Formvar solution. The present author has found that pits developed within 20 to 30 sec after pouring such a solution on the surface. I n another experiment, Ketchum and Hobbs (1969) measured equilibrium grain-boundary groove angles after maintaining the ice a t - 3°C for a period of two days, by making a replica of the grain boundary with 5% Formvar solution. It is possible that the replicating process could have transformed the equilibrium state into a metastable con- dition and changed the groove angles. This possibility was apparent from the work of Suzuki and Kuroiwa (1972) in which measurable differences were demonstrated between the grain-boundary groove angles measured by replica and metallic foil methods.
The foregoing discussion suggests that more information can be obtained by the Formvar etching and replicating process than has been obtained to date by manipulating the conditions of the process, such as the concentration of the solution, the temperature and humidity of the surrounding environment, the thickness of the etchant poured on the surface, and the drying time.
2.1. Role of surface preparation
Another factor that has hindered progress in the application of the etching technique to ice has been surface preparation prior to etching. Muguruma (1961) could use his method only on very small areas, less than 0.5 mm in diameter, a t the bottom of evaporation etch-pits developed by the Higuchi method. He showed that for lake ice the densities of etch-pits in these small areas (6.5 x
lo6
were an order of magnitude less than the densities (6.5 x lo7 on the oliginal surface prepared by polishing with emery paper. It was considered by Muguruma (1961) that polishing generated many dis- locations. He used this assumption, in fact, as an argument for the cor- respondence of etch-pits to dislocations. The increase in dislocation density by mechanical polishing was the reason that led Kuroiwa and Hamilton (1963), Levi et al. (1965) and Kuroiwa (1969) to limit their experiments to dendritic crystals, fresh cleavage and fracture surfaces, and surfaces produced by evaporation etch-pits. Krausz and Gold (1967) prepared their surfaces by melting briefly on a brass plate kept a t a temperature slightly above O°C, followed by polishing with soft leather or by chemical dissolution using alcohol.. The surface melting method, however, cannot be used for the detection of dislocations produced in previously deformed ice if the ice is to be maintained a t a constant temperature. Moreover, surface melting could introduce certain undesirable morphological changes (Krausz and Gold 1967).$ 3 . EXPERIMENTAL PROCEDURE
The following surface preparation, etching and replicating techniques were found to successfully reproduce dislocations and other imperfections a t an ice surface. Their flexibility of application will be illustrated by a few specific examples.
3.1. Preparation of the surface
Thick sections (up to 2 cm) of required orientations were cut with a band saw. Each was mounted on a clear glass plate by freezing a few drops of water a t the edge, making certain that no water entered the space between
Dislocations i n ice by etching 1389 the glass and the specimen. The latter condition can be obtained by using water precooled to just above 0°C. The exposed surface of the section was then microtomed to a mirror finish in three stages. First 1500p (1.5 mm) was removed from the surface, 10 p a t a time. This was followed by removal of the next 500 p in 5 p layers, cleaning the microtome blade with a soft tissue paper after every pass. The final step was to finish the surface by removing another 100 p in 1 to 2 p layers, ensuring that the blade was clean before each pass. The quality of the surface was examined visually, using reflected light from a distant source, and also with an optical microscope. This procedure was used to prepare surface areas up to 8 x 12 cm with a mirror finish. On several occasions both surfaces were finished in this way to provide a thin section 0.4 mm thick for analysis with transmitted polarized light. I n these cases the initial thickness was 5 mm. After preparing the first surface, a specimen was removed from the glass plate by careful cutting of the bonding ice with a sharp razor blade. It was then remounted on another clean glass plate with the prepared surfaces facing the glass, and microtomed until the second surface had a mirror finish.
3.2. Etching and replicating procedure
A freshly prepared specimen was kept in a horizontal position inside a transparent plastic or glass box containing crushed ice. Formvar solution was placed slowly on the prepared surface with an eye dropper and the surface coated with the desired thickness of etchant. The overflowing of the solution was prevented by building a wall of ice with water around the edges of the specimen.
The vapour pressure inside the box was controlled qualitatively by varying the degree of closure of the top of the box and providing a gentle flow of air around the box. Transparency of the box allowed the specimen to be observed externally with an optical microscope without disturbing the en- vironment inside the chamber. For the observations reported in this paper, concentrations of the etchant were varied from 0.05 to lo%, temperatures from - 5 to - 40°C, the thickness of solution was up to 5 mm and the humidity varied to obtain a period of drying from a few minutes to several days.
Replicas were removed by t h e e different methods:
( a ) peeling, when the replica was to be examined immediately to evaluate
a particular etching procedure;
(b) melting of the ice in water just above the melting-point and allowing the film to float; and
(c) allowing the ice to sublimate.
The last procedure was time-consuming and took up to 15 days when the temperature was below - 35"C, but i t did provide undamaged replicas.
3.3. Method of observation
The replicas were carefully mounted on large glass slides with the replicated surface facing upwards, and observed with a good quality optical microscope. Selected areas were then prepared for examination with a scanning electron microscope by vacuum deposition of a layer of carbon followed by a plating of gold.
§ 4. EXPERIMENTAL RESULTS AND APPLICATIONS
4.1. Quality of the prepared surface
The success of the microtoming procedure depends on how effective it is in producing a flat and smooth surface without introducing undesirable effects, particularly a modification of the density of dislocations. Examination of non-basal dislocations was carried out in the following manner. Evaporation pits were produced on a microtomed (0001) plane of laboratory-grown ice by applying a thin layer of 1% Formvar solution and exposing it to the low humidity (about 15%) atmosphere of the cold room a t - 10°C. This caused
the film to dry within 15 min. Large hexagonal evaporation pits developed subsequently after the film was dry. The evaporation pits were allowed to grow to about 0.5 mm in diameter. The plastic film was then removed by peeling and the surface recoated with a 2% solution, and the specimen placed in a box closed with an air-tight cover. This retarded the evaporation rate of the solvent and provided an opportunity for etch-pits to develop over the entire surface to the desired degree. The box was then opened and the solution allowed to dry quickly.
An optical photomicrograph of the large hexagonal evaporation pits and numerous minute dislocation etch-pits are shown in fig. 1 ( a ) . A scanning electron micrograph of the same area is presented in fig. 1 (b). The distribution of etch-pits on the original microtomed surface (A) and a t the bottom of Dhe evaporation pit (B), about 60 y below the microtomed surface, are shown in figs. 1 (c) and 1 (d) respectively. The corresponding densities of dislocations, after correction for the tilt of the SEM stage, were found to be 4.04 x l o 6 ~ m - ~ and 3.37 x 10⁶ ~ m - ~ respectively. Whether the difference in the two densities was due to inhomogeneity in the existing density or was introduced by the microtoming process was difficult to ascertain. The measurement indicates, however, that the process of microtoming did not appreciably affect the density of dislocations that originally existed in the ice crystal in non-basal planes.
Dislocations in ice by etching
Fig. 1 (continued)
(a) Optical micrograph of a replica of hexagonal evaporation etch-pits on basal plane.
(b) Scanning electron micrograph of the same area as shown in (a). (c) Dis- location etch-pits on the original microtomed surface, marked (A) in (b). (d) Dislocation etch-pits at the bottom of evaporation pit, marked (B) in (b).
The above results compare well with the dislocation density of 6.5 x
lo6
~ m - ~ found by Muguruma (1961) a t the bottom of large evaporation etch-pits insimilar ice.
The success of microtoming depends upon the condition of the micr~t~oming blade and the care with which the surface is prepared. Slight damage to the blade can cause the formation of rows of dislocations in the microtoming direction. The procedures used were found to be more critical for the pre- paration of prism surfaces for etching of basal plane dislocations.
4.2. Pits on basal plane
An example of etch-pits on the (0001) plane of a laboratory-grown large single crystal is shown in fig. 2. The replica was made a t - 10°C with a thick layer of 5% solution. The sizes of the pits vary from 20 t o 100 p i n diameter and the average density was determined to be 2.1 x l o 4 ~ m - ~ . Distribution of these pits was more or less homogeneous over the surface. Similar pits were also obtained for a large single crystal, about 8 cm in diameter and 40 cm long (obtained from a pond frozen under calm conditions) with a [0001] axis parallel to the growth direction. There was a noticeable difference, however, in the distribution of these pits in natural ice. The density of the pits varied greatly
(lo4
to l o 5 ~ m - ~ ) , with local concentrations around inclusions. Many sub-boundaries were also observed. The nature of pits in natural ice seemed to bear a close resemblance to that observed by Kuroiwa and Hamilton (1963) for pits on the surface of freshly frozen dendritic crystals. They used essentially the same process for preparing their pits.It was felt that the foregoing conditions of etching would make visible only major defects having relatively large free energies. According to the principles stated earlier, it might be possible to successfully etch minor defects with free energy close to that of the free surface by using a more dilute solution
Fig. 2
Optical micrograph of a replica of large etch-pits on basal plane, made a t - 10°C with 5% Formvar solution under ambient conditions of the cold room.
Fig. 3
Two types of etch-pit "11 t l ~ c b s;trllc. specimen used in fig. 2 , h u t etched and replicated a t - 30°C with 3% Formvar solution under sub-saturated condition.
Dislocations in ice by etching 1393
and carrying out the etching a t lower temperatures. I n order to test this hypothesis on the same specimens, the temperature of the cold room was decreased to - 30°C over a period of 24 hours (to avoid excessive thermal stresses), and the corresponding surfaces were microtomed again. The etching- replicating process was repeated with a 3% solution under sub-saturated conditions. The results for the laboratory-grown single crystal are shown in fig. 3. Two distinct type* of etch-pits are now visible. The majority of etch-pits were small, 1 to 4 p in diameter, with a pointed bottom. I n addition, there were a number of large pits varying in diameter from 20 to 100 p which had some sub-structure (i.e. step-like features). The average density of these large pits was determined to be 2-0 x
lo4
em-2 in the laboratory-grown single crystal and was similar, therefore, to the density of the pits formed a t the higher temperature. The density of the small pits, determined from a SEM micrograph, was found to be 3.2 xlo6
cmp2, of the same order as those given in § 4.1. Scanning electron micrography revealed (figs. 4 ( a ) , (b)) that the large pits consisted of well-defined concentric as well as apparently spiralling steps of regular hexagonal, six-sided star and segmented shapes. The bound- aries of these steps were observed to be parallel to (1010) and (1120) directions, thereby forming angles of 30, 60, 90, 120 and 150 degrees. Step heights were found to be less than 0 . 3 ~ in most cases. Pits with similax characteristics were also observed on natural ice surfaces.A stepped layer formation a t etch-pits was also observed by Truby (1955) in replicas of the (0001) surface of ice. Observations by Muguruma (1961) also indicate such stepped structures, which he thought developed a t screw dislocations. From the reports of these investigators it was noticed that both replicated the surface a t -20°C or lower and both used dilute solutions of 0.5 to 0.7% concentration consistent, therefore, with our observations on the action of the etchant on the ice surface. Repeating the experiments described
Fig. 4
(a) ( b )
Stepped and spiralling sub-structures associated with large etch-pits of fig. 3: ( a )
showing concentric steps and spirals with irregular boundaries, ( b ) illustrates the symmetrical steps and star-shaped spirals.
in
5
4.1 confirmed that both of these types of dislocations could be obtained a t higher temperatures if the etching is carried out under enclosed conditions. Stepped structures wele visible, but only a t high magnification, otherwise the pits were indistingnishable as shown in figs. 1 ( c ) , ( d ) .Comparison between the distribution of large pits in laboratory-grown and natural ice and the association of a stepped structure with these pits prompted the thought that the large pits correspond to grown-in dislocations and the small pits to dislocations introduced by post-freezing processes, and to thermal stress and mechanical loading during handling and storage. This possibility will be explored further in the next section.
4 . 3 . Glide direction of non-basal dislocations 4.3.1. General
Deformation processes in ice are often explained on the basis of the mobility of glide dislocations in (0001) plane. Non-basal glide has also been shown to be possible and etch-tracks caused by the movement of non-basal dislocations have been formed on the basal plane. Gilra ( 1 9 7 4 ) discussed this glide from the viewpoint of splitting of ( 1 1 2 0 ) dislocations into ( 1 0 1 0 ) partials in the basal plane. The present study was undertaken to determine more about the etch-tracks corresponding to this glide and explain their development.
It is known from investigations on metals (e.g. Gilman and Johnstcn 1957)
that well-developed, point-bottomed etch-pits form a t stationary dislocations, but flat-bottomed pits are formed if the dislocations move some time after the first application of the etchant. Grooves or tracks are expected to form if the dislocations move slowly during the etching process. Since the etchant is also used for making the replica in the case of ice, the conditions influencing the etching rate and drying time also determine the quality of the etch-tracks. Thus any explanation of the nature of etch-tracks in ice should take into account the factors governing this dual prbcess of etching and replicating.
Observations were made first on the time required for the development of etch-pits under various conditions of solution concentration, humidity, tem- perature and thickness of the applied film. This was done by observing the surface with a high-resolution opt,ical microscope during the etching process.
It was observed, for example, that 20 s were required to develop etch-pits of about 3 p diameter for a layer of 0.5% Formvar solution about 0.5 mm thick exposed directly to the cold room atmosphere a t
-
10°C. The cor- responding time was about 120 sec for a 5% solution. The former film dried in 10 min, whereas the latter took 2 hours.If a moving dislocation is to result in a track 3 p wide under the action of the first etchant condition, then its speed must be about 3 p in 20 s, j.e. a velocity of 1.5 x cmls. Moreover, if i t travels a t constant velocity, then the travel path will be about 90 p in the 10 min drying time, neglecting the decrease in etching rate as the film dries. The corresponding velocity required for the 5% solution is 2.5 x 10⁻⁶ cm/s and the track length 180 p. The former velocity is a realistic velocity for basal plane dislocations under a resolved shear stress in the range of 0.2 to 0.5 kg/cm2, and the latter corresponds to stresses in the range of 0.05 to 0.07 kg/cm2 (Fukuda and Higashi 1973, Jones and Gilra 1973). The stress dependence of the velocities of non-basal dislocations
Dislocations i n ice by etching 1395
is not known, but the foregoing discussion indicates that the etching technique can be used only for studies of dislocation movements under low stresses. It also demonstrates that changing the concentration of the etchant from 0.5 to 5% corresponds to a decrease of about one order of magnitude in capability of detecting moving dislocations.
Further generalizations can be made from the above observation. The higher the stress, the narrower the track for a given etching process. If the stress is sufficiently large there will be no track. The tracks will be tapered if the velocity changes during the etching process. The tracks may be tapered if the etching action decreases, owing to the drying of the film. If a dislocation moves during a portion of the etching time and then stops, the track will end in a well-developed etch-pit. If the dislocation starts moving from a stationary position, then the track will have a flat-bottomed pit a t the starting-point. Thus the characteristics of the tracks can provide information on the nature of the movements.
4.3.2. Etch-tracks under non-uniform stress Jicld
Examples of etch-tracks in a specimen under non-uniform stress are given in fig. 5. These etch-patterns were developed when one side of the glass plate holding the specimen was kept in a slightly bent position during the etching process. All the tracks were observed to be tapered. Clear areas were pro- duced by the movement of dislocations too rapid to leave any visible tracks. The visible tracks were found to be along (10TO) as in fig. 5 ( c ) or along (1120)
Scanning electron micrograph (a) and optical micrograph (b), exhibiting etched tracks caused under non-uniform stress field. Scanning electron micrography show the running directions to be (10i0) and (1120) respectively in (c) and (d).
as in fig. 5 (d), indicating the predominant slip directions. Serrated tracks were also observed, which could indicate the presence of obstacles in the path of the dislocations.
4.3.3. Etch-tracks under uniform stress Jield
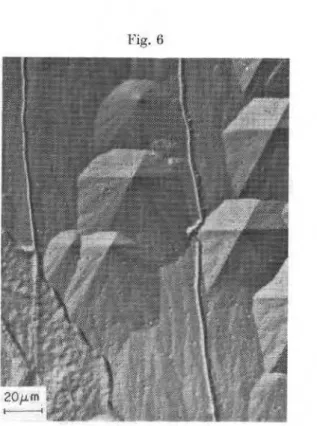
In another experiment, the specimen was subjected to a uniform thermal stress. The specimen chosen was the laboratory-grown single crystal thick section that had been etched earlier. Prior to the reapplication of the etchant, the surface was remicrotomed a t - 10°C and the edges of the specimen were frozen uniformly to a glass plate, taking care to allow no water between the glass and the bottom surface of ice. The specimen was transferred quickly to a chamber kept a t - 30°C and the surface was coated immediately with an etchant. The thermal stress generated in the specimen could be estimated using thermoelastic stress theory and the boundary condition of constraint a t the edges (Johns 1965, Carslaw and Jaeger 1959). The transient stress was large in the early period, but disappeared gradually, owing tio removal of the thermal gradient as the specimen attained the temperature of the chamber. Thus the major stress in the later part of the etching process was due to the edge constraint and the differential thermal expansion of glass and ice. It is expected to decrease with time, owing to the relaxation processes associa,ted with the dislocation movements. The drying time for the film was about
30 hours in this case. An earlier study by the author, of the stress relaxation processes in ice, indicated that the stress remaining after this period would be negligible if not zero. Thus the tracks would develop only during the later part of the etching process and it is conceivable that many dislocations would have stopped before the end of the process, forming stable etch-pits. Any
Dislocations in ice by etching 1397 dislocations that did not move during the entire process would produce large pits. I n this way, grown-in dislocations could also be identified, because these defects are not expected to move (see Gilman and Johnston (1957) for experiments on LiF).
Figure 6 shows a small area that was typical of the replica obtained from this experiment. The 3 p wide uniform track was found to be more than 1200p in total length. The direction of the track was found to be mostly parallel to the (10TO) and (1120) directions, but certain sections indicated directions parallel to the bisectrics and trisectrics of the angle between the (10TO) and (1120) directions. The presence of the track appears to block the passage of other dislocations, or new dislocations were generated during its formation. This is indicated by a series of point-bottomed intermediate size (2-5p) etch-pits adjacent to the track. There is a uniform distribution of smaller pits of less than 1.5 p in diameter. These pits could have been produced by the stoppage of the rapidly moving dislocations near the end of the etching process. The density of these pits was found to be 3.8 x l o 6 ~ m - ~ , which agrees with the density of dislocations in the crystal before the application of thermal stress. The large pits of 50 to 100 p size appeared to be stationary during the entire process and thereby developed to large dimensions. The average density of these pits was found to be 2.0 x l o 4 ~ m - ~ , which is close to
Optical micrograph of a long and uniform etch-track, large asymmetric etch-pits, and minute etch-pits.
the density of the large pits with a stepped structure found earlier in this crystal. This supports the hypothesis that they are grown-in dislocations. The large pits in fig. 6 were not symmetric. Since the surface was cut parallel to the basal plane within an error of a few degrees, the asymmetry was too great to be 'explained by the tilt of the basal to the sectional surface. The non- symmetric characteristics of these pits can, however, be explained by the tilt of the grown-in dislocation lines with the (0001) axis as shown in fig. 7 .
The influence of large pits and the condition of the surface on the movement of dislocations is indicated in fig. 8 (a). The track directions on the left-hand side of the photograph are all parallel to (1120) directions, thereby forming semi-hexagonal patterns around a large pit. The width in the track appears
to be wider where the tracks are parallel to (1010) directions, on the right-hand
side of the photograph. The apparent increase in track width was found by scanning electron micrography to be due to the formation of minute etch-pits on both sides of the tracks (fig. 8 ( 6 ) ) .
Fig. 7 A N G L E OF T I L T D I S L O C A T I O N OF THE S U R F A C E L I N E P A R A L L E L O R D I S L O C A T I O N TO [ 0 0 0 1 ] A X I S L I N E W I T H R E S P E C T TO [ 0 0 0 1 ] A X l S
Schematic diagram of symmetrical and asymmetric etch-pits depending upon the tilt of the surface or dislocation lines with respect to the c-axis and the a-axes.
Dislocations in ice by etching Fig. 8
(a) Surface conditions influence the movement of dislocations as seen in the left near a
large pit. The width of the tracks on the left, parallel to (1120) directions, appear to be narrower than on the right, parallel to (1010). ( b ) The change in width of the track, seen in ( a ) , is due to the formation of large number of small pits around the track, as shown by SEM.
4 . 4 . Size of etch-pits
The energy change associated with the mechanical balance between the line tension of a dislocation and the tension a t the surface is responsible for the differential dissolution a t the intersection of the line defects with the surface. The dissolution a t these junctions proceeds both along the line defects and parallel to the surface because of the strain field of dislocations, until equilibrium is achieved. The boundary of an etch-pit on the surface therefore, would extend a maximum distance determined by the strain field a t the dislocation end of neighbouring dislocations. The dislocation density, therefore, should de- termine the maximum size of an etch-pit.
The maximum size of the etch-pits could be calculated from the average dislocation density. If d is the average density expressed in ~ m - ~ , then the average area per dislocation will be given by l / d . This area would be equivalent to a circular area of radius
R = ( l / ~ d ) l / ~ cm. ( 1 ) Equation (1) can be used to calculate the approximate maximum size of
etch-pits for both grown-in and other dislocations. For a density of 2 x l o 4 ~ m - ~ for grown-in dislocations mentioned earlier, eqn. ( 1 ) gives a maximum
diameter of about 8 0 p . Kuroiwa and Hamilton (1963) reported a density of etch-pits of 2 x l o 5 ~ m - ~ . Equation ( 1 ) gives an average diameter of 25 p for this density, which agrees with the size seen in their photograph. Both our observations and those of Muguruma (1961) showed that the density of other
dislocations was in the range of
lo6
cm-2. The diameter of the etch-pits, as calculated from eqn. ( l ) , are 11 p and 5 p respectively for densities of 1 xlo6
and 5 x lo6 ~ m - ~ , which again agrees with the respective experimental observations.4.5. Direct evidence of correspondence of etch-pits to dislocations
If the conditions of etching are such that the dissolution can continue into the crystal along the dislocation lines, then, if the energy of the dislocation core is neglected, the radius r of the etched capillary is given by
where y is the surface free energy of ice with respect to the etchant. The right- hand side is the elastic energy stored per unit length of the dislocation line assuming linear elasticity, where b is the Burgers vector, R is the outer extent of the strain field given by eqn. (I), r,, is an inner cut-off radius inside which the approximation of linear elasticity theory does not apply, and K is a function of the elastic constants, orientation of the dislocation line, and the Burgers vector.
Teutonico (1970) has shown that K may be computed analytically for dislocations in crystals belonging to the hexagonal system. Tyson (1971) has calculated the elastic strain energies of dislocations in I h ice (ordinary ice) on the basis of Teutonico's formulas.
Using the following values in eqn. (2),
Kb2 = 9.85 x ergs/cm a t 0°C; Tyson (1971),
b = 4.523 x cm,
r,= 56 = 22.615 x 1 0 F ; assumption (Weertman and Weertman 1964), R = 5.64 x
lop4
cm for a dislocation density of 1 x lo6; eqn. (1)y = 20 ergs/cm2 (assumption),
the diameter, 2r, is computed to be 0.12 p.
The strain energy of dislocations and the value of K increase slightly with a decrease of temperature and the value chosen for r , also slightly influences the result, but the greatest uncertainty in the preceding calculation is the assumed value of the surface free energy of ice with respect to the etchant. The value used corresponds to that of ice with respect to water in the temperature range of - 30°C to - 40°C.
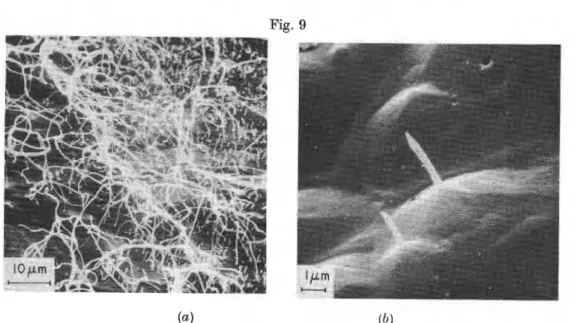
Equation (2) indicates that capillaries of measurable size could be developed under appropriate etching conditions. These conditions include as low a value of surface free energy as possible, and an etchant of sufficient fluidity to penetrate the capillaries produced by the dissolution. Experiments in- dicated that the conditions could be satisfied by the Pormvar solution a t low temperatures.
Figure 9 (a) shows a general view of whiskers on a replica of the (0001) plane of la,boratory-grown ice. The length of the whiskers was 60 to 70 p and the diameter, as shown in the SEM micrograph, was about 0.25 p. A separate measurement of the thickness of the coatings of carbon and gold, following
Dislocations i n ice by etching
Fig. 9
(a) Non-basal dislocation whiskers in ice revealed by the scanning electron micrograph. (6) Pyramidal hexagonal etch-pits on a (0001) plane with whiskers representing the dislocation lines.
the same procedures of vacuum deposition, indicated that they were 350 and 250
A
respectively, giving a total thickness of coating of 600A.
The correction to the observed diameter was 1200A
or 0.12 p , assuming the whiskers were coated uniformly, which may not be true. The corrected diameter of the whiskers was 0.13 p, which agrees well with the value calculated from eqn. (2). Isolated etch-pits with small whiskers are shown in fig. 9 ( b ) and clearly show the relationship of the whiskers to the base of etch-pits on a (0001) plane. These observations directly correlated the etch-pits to the line defects in a three- dimensional sense more strongly than achieved earlier in any material. (See, however, Dash (1957) on his technique of decorating dislocations in silicon.)4.6. Observations of basal plane dislocations
Tyson (1971) computed the elastic strain energies of dislocations for basal and non-basal planes, and showed that they are the same. This means that the whiskers' diameter for basal plane dislocations will be the same as for non- basal dislocations provided the surface free energies do not differ appreciably between the basal and the prismatic surfaces.
Figure 10 ( a ) shows whiskers produced a t the bottom and side surfaces of an evaporation etch-pit on a (0001) plane. The schematic in fig. 10 ( b ) shows their relationship to the crystallographic orientation. It shows that both basal and non-basal dislocations can be replicated simultaneously for the same crystal of ice. The whisker diameters for both basal and non-basal
Fig. 10 H E X A G O N A L E V A P O R A T I O N E T C H P I T O N B A S A L P L A N E B A S A L P L A N E D I S L O C A T I O N S D I S L O C A T I O N S S E M P H O T O G R A P H I L L U S T R A T E D ( a ) (b)
( a ) Scanning electron micrograph of whiskers corresponding to basal and non-basal dislocations. Whiskers in the horizontal direction are related to the basal dislocations. (b) Schematic diagram of the formation of whiskers at the bottom and side surfaces of an evaporation etch-pit on a (0001) plane.
dislocations were found to be about the same, indicating that the ice etchant interface free energies y(,,,,, and y(,,io, might not differ significantly. Thus
it confirms indirectly a similar conclusion arrived a t by Fletcher (1975) for free energies a t the ice-water interface.
An example of a replica of a forest of glide dislocations intersecting the ( 1 1 2 0 ) surface is shown in fig. 1 1 ( a ) . The whiskers were found to be as long as 30 to 40 p and the diameters about 0.14 p. Figure 10 (b) shows the relation- ship between elongated etch-pits formed on the (10TO) surface and the whiskers. The replica in this case was purposely peeled off to break the whiskers so that their base could be seen more clearly.
This method of etching and obtaining replicas of glide ,dislocations re- sponsible for the basal slip in ice has provided a number of possibilities for further investigation of deformation processes in ice. The technique has been applied successfully to study simultaneous basal and non-basal glide in poly- crystalline ice, the effect of strain rate on microcrystalline deformation, the development of glide dislocations and pile-ups, and other deformation features. This work is to be reported in future publications.
Dislocations in ice by etching Fig. 11
( a ) Forest of basal-plane dislocations represented by the corresponding whiskers on a (1120) surface. (6) Broken whiskers on a (10TO) surface showing the elongated pits parallel to [0001] at their bases.
It was well established that the dual process of etching and replicating ice surfaces with solutions of Formvar in ethylene dichloride could be improved and made more selective by controlling concentration, temperature, thickness of the film applied, and the vapour pressure of the environment. Careful microtoming was found to produce a surface condition suitable for etching and replicating dislocations. By appropriate choice of conditions, etching can be made to occur not only a t the point of emergence of dislocations on the surface, but also into the crystal along the line imperfections, resulting in replicas in the form of whiskers of uniform diameter. Both non-basal and basal dis- locations can be etched in this way. The technique has removed the ambiguity sometimes associated with the correspondence of etch-pits to dislocations.
A relationship developed for the diameter of the etched dislocation strain cores gave values in agreement with the observed values. The ability t o replicate whiskers corresponding to the dislocation lines opens up many possibilities for the application of the method to the study of deformation processes in ice. Grown-in dislocations amongst other non-basal dislocations can be identified by the proper choice of etching conditions. Grown-in dislocations were found to have marked concentric and spiralling step features. Tracks caused by the movement of dislocations during etching are tapered for a non-uniform stress field and non-tapered when the stress was uniform. Because of the time to form measurable etch-pits and tracks, the etching technique can be used for the study of disIocation movements only for low stresses. The predominant direction of glide for non-basal dislocations was found to be along (1010) and (1120). The movement of non-basal dislocations leaves a trail of new non- basal dislocations, point defects, or the etch-track is a barrier to the movement
of other dislocations. A simple relationship between the density of dislocations and the maximum size of the etch-pits is in agreement with experimental observations.
The author gratefully acknowledges many helpful discussions with and the advice of Dr. L.
W.
Gold in the preparation of this paper, and the expert assistance of E. G. Quinn who prepared all the scanning electron micrographs. This paper is a contribution from the Division of Building Research of the National Research Council of Canada and is published with the approval of the Director of the Division.REFERENCES CABRERA, N., 1956, J. Chdm. phys., 53, 675.
CARSLAW, H. S., and JAEGER, J . C., 1959, Colzductwn of Heat in Solids, 2nd edition (Oxford: Clarendon Press).
DASH, W. C., 1957, Dislocations and Mechanical Properties of Crystals (New York: John Wileg B Sons, Inc.), p. 67.
DROST-HANSEN, W., 1967, J . Colloid Interface Sci., 25, 131. FLETCHER, N. H., 1976, J . Cq~,vtal Grozuth, 28, 375.
FRANK,
F. C., 1952, Adv. Phys., I, 91.FVKCDA, A,, and H I a ~ s m , A., 1973, Crystal Lattice Defects, 4, 203.
G ~ M A X , J. J., and . J o m s ~ o s , 11'. G., 1957, Dislocations and Mechanical Properties
of Crystah (New York: John Wiley & Sons, Inc.), p. 116. GILRA, N. K., 1974, Phys. Stat. Sol. A, 21, 323.
HESSTVEDT, E., 1964, Norwegian Gwtechnical Institute Publication, No. 56, p. 7. HIGUCHI, K., 1957, J. Glaciol., 3, 131. 1958, Acta metall., 6, 636.
JOHNS, D. J., 1965, Thermal Stress Analysis (Oxford: Pergamon Press Ltd.).
JONES, S. J., and GILRA, N. K., 1973, Physics and Chemistry of Ice, edited by E. Whalley, S. J. Jones and L. W. Gold (Royal Society of Canada), p. 344. KUROIWA, D., 1969, J. Glaciol., 8, 475.
KUROIWA, D., and HAMILTON, W. L., 1963,'1ce and Snow, edited by W. D. Kingery (Cambridge, Mass.: M.I.T. Press), p. 34.
KETCHUM, W. M., and HOBBS, P. V., 1969, Phil. Mag., 19, 1161. KRAUSZ, A. S., and GOLD, L. W., 1967, J. Colloid Interface Sci., 25, 255. LEVI, L., DE ACHAVAL, E. M., and SURASKI, E., 1965, J. Glaciol., 5, 691. MUGURUMA, J., 1961, J. Electron-microscopy, 10,246.
MUGURUMA, J., and HIGASHI, A., 1963, J . phys. Soc. Japan, 18, 1261. SUZUKI, S., and KUROIWA, D., 1972, J. Glaciol., 11, 265.
TEUTONICO, L. J., 1970, Mater. Sci. Engng, 6, 27. TRUBY, F. K., 1955, J. appl. Phys., 26, 1416. TYSON, W. R., 1971, Can. J. Phys., 49,2181.
WEERTMAN, J., and WEERTMAN, J. R., 1964, Elementary Dislocation Theory (New York: The Macmillan Company).
![Fig. 7 A N G L E OF T I L T D I S L O C A T I O N OF THE S U R F A C E L I N E P A R A L L E L O R D I S L O C A T I O N TO [ 0 0 0 1 ] A X I S L I N E W I T H R E S P E C T TO [ 0 0 0 1 ] A X l S](https://thumb-eu.123doks.com/thumbv2/123doknet/14365373.503421/17.722.196.576.497.926/fig-n-g-l-e-t-i-l.webp)