HAL Id: hal-02865559
https://hal.archives-ouvertes.fr/hal-02865559
Preprint submitted on 11 Jun 2020
HAL is a multi-disciplinary open access
archive for the deposit and dissemination of sci-entific research documents, whether they are pub-lished or not. The documents may come from teaching and research institutions in France or abroad, or from public or private research centers.
L’archive ouverte pluridisciplinaire HAL, est destinée au dépôt et à la diffusion de documents scientifiques de niveau recherche, publiés ou non, émanant des établissements d’enseignement et de recherche français ou étrangers, des laboratoires publics ou privés.
Civil conflict and firm recovery: Evidence from
post-electoral crisis in Côte d’Ivoire
Florian Leon, Ibrahima Dosso
To cite this version:
Florian Leon, Ibrahima Dosso. Civil conflict and firm recovery: Evidence from post-electoral crisis in Côte d’Ivoire. 2020. �hal-02865559�
fondation pour les études et recherches sur le développement international ATION REC ONNUE D ’UTILITÉ PUBLIQUE . T EN ŒUVRE A VEC L ’IDDRI L ’INITIA TIVE POUR LE DÉ VEL OPPEMENT E
T LA GOUVERNANCE MONDIALE (IDGM).
OORDONNE LE LABEX IDGM+ QUI L
’ASSOCIE A U CERDI E T À L ’IDDRI. ATION A BÉNÉFICIÉ D ’UNE AIDE DE L ’É TA T FR ANC AIS GÉRÉE P AR L ’ANR A U TITRE DU PR OGR A MME «INVESTISSEMENT S D ’A VENIR» -14-01».
Civil conflict and firm recovery:
Evidence from post-electoral
crisis in Côte d’Ivoire*
Florian Léon
Ibrahima Dosso
Florian Léon, Research Officer, FERDI. florian.leon1@ferdi.fr
Ibrahima Dosso, Consultant, World Bank, PhD Student, Université Clermont
Auvergne, CERDI. idosso@worldbank.org
Abstract
This paper examines how firms recover after a short, but severe, external shock. Thanks to a rich firm-level database, we follow surviving formal enterprises before, during and after the 2011 post-electoral crisis in Cˆote d’Ivoire. Main findings are summarized as follows. First, recovery was rapid in the first year but imperfect: three years after the shock, firms did not reach their previous level of productivity. Second, we show a wide heterogeneity in recovery across firms (within the same industry). Young and local firms were more able to rebound after the crisis. In addition, credit-constrained firms were less resilient, highlighting the importance of access to credit in post-crisis periods. Finally, the recovery was higher for labor-intensive firms but firms relying more on skilled workers and managers faced a lower rebound.
Key words: Political violence; Firm; Recovery; Africa; Labor. JEL Classification: D22; L25; N47; O12.
* We would like to thank the National Institute of Statistics for sharing data with us. We also thank Pierrick Baraton, Luisito Bertinelli, Arnaud Bourgain, Joël Cariolle, Lisa
Chauvet, Boubacar Diallo, Marie-Hélène Hubert, Jordan Loper, Patrick Plane, Laurent Weill and Alexandra Zins, as well as participants at African Development Bank (Abidjan, Côte d’Ivoire) and CERDI (Clermont-Ferrand, France), and audiences at JMA (Casablanca, Morocco) and AFSE Conference (Orléans, France), for their helpful advice. Any errors are our own. This research was supported by the Agence Nationale de la Recherche of the French government through the program “Investissements d’avenir” (ANR-10-LABX-14-01), through the IDGM+ initiative led by Ferdi (Fondation pour les études et recherches sur le développement international).
Dev
elopment Po
lic
ie
s
W
ork
ing Paper
266
May 2020“Sur quoi la fondera-t-il l’économie du monde qu’il veut
gouverner? Sera-ce sur le caprice de chaque particulier? Quelle
confusion! Sera-ce sur la justice? Il l’ignore.”
1
Introduction
Private firms in developing economies are essential to wealth and job creation but often
suffer from external shocks such as commodity price bust, natural disaster,
epidemio-logical crisis or conflict. In Africa, internal conflicts are a common source of instability,
particularly at election times. More than half of all elections held in Africa experienced
some form of violence before or after the election day (Burchard,2015;Ksoll et al.,2019).
Despite a large body of literature on the consequences of civil conflicts on socio-economic
outcomes (Verwimp et al., 2019), our knowledge about the implications of conflicts on
firms and entrepreneurship remains limited. In particular, while recent articles have
pointed out that firms suffer during conflicts (e.g. Dupas and Robinson, 2010; Camacho
and Rodriguez, 2013; Amodio and Di Maio, 2018), our knowledge about firm recovery
after a conflict is rather scarce.
A better understanding of how firms rebound after a shock is of prime importance
in helping policymakers to effectively formulate policies that strengthen firm resilience
in post-conflicts countries. The persistent effects of conflicts on firms is ambiguous,
es-pecially for short events (Blattman and Miguel, 2010). On the one hand, the disruption
of business and the destruction of (human and physical) capital may be too limited to
have a profound or long-term effect.1 In addition, a rebound of economic activity may
occur after a negative event due to reconstruction and/or because the crisis has had a
cleansing effect. On the other hand, even short-lived shocks may have long-term effects
due to the loss of specific assets (Collier and Duponchel, 2013) or delayed investments
or hiring decisions (Baker et al., 2016). Furthermore, conflicts negatively affect human
capital accumulation (education and health), public finance and social cohesion (Hjort,
2014), impeding firm growth in the long-term.
In this article, we examine firm recovery after a short, albeit severe, civil conflict. In
doing so, we follow performance of formal firms operating in Cˆote d’Ivoire before, during
and after the 2010 post-electoral crisis. The Ivorian context is especially appropriate
for our objective. From the 1990s, there were ethnic and political tensions, that peaked
1Even strong physical destruction may have limited long-term impact, as documented in the literature
on the impact of bombing (Davis and Weinstein, 2002; Miguel and Roland, 2011). Evidence from the literature on the consequences of natural disasters also points out that local events have a limited impact on global activity (Cole et al.,2017;Strobl,2012).
in 1999 with conflicts that led to the First Ivorian Civil War from 2002 to 2007. The
2011 post-electoral crisis occurred in the context of this prior unrest. It was relatively
short (less than 6 months) but devastating (resulting in more than 3,000 deaths and over
700,000 displaced persons) and followed by a quiet period (Figure 1). This paper tracks
the evolution of the productivity of surviving firms before (2009-10), during (2011) and
three years after the electoral crisis (2012-14). We exploit heterogeneity across firms to
examine factors impacting firm recovery. Beyond the usual firm characteristics (sector,
age, size, ownership), we dedicate special attention to the supply channel (e.g., input cost
and availability).2 For each firm, we identify whether it relied more on labor (quantity
and quality) and capital before the crisis than its counterparts in the same industry. We
then scrutinize how dependence on specific input shapes its recovery.
Main results can be summarized as follows. First, our analysis indicates that firms
had only partially recovered three years after the crisis. The level of (labor) productivity
decreased on average by 20% during the crisis. One year after the conflict, half of the losses
was recoup. However, three years after the crisis, the level of productivity remained ten
percent lower than prior to the crisis. Second, we show a wide heterogeneity in recovery
across firms (even within the same industry). Small (in terms of employees) and local
entreprises recovered, contrary to large and foreign-owned firms. Furthermore,
credit-constrained firms suffered more and were less able to recover than non-credit constrained
firms. Interestingly, the access of capital played a role after the crisis but did not help
firms to limit losses during the conflict (many banks were closed during the combats).
Finally, the role played by the reliance on labor in process of production (before the
crisis) in recovery is ambiguous. On the one hand, labor-intensive firms outperformed
their counterparts both during and after the crisis. On the other hand, firms relying on
skilled workers and on managers were less able to rebound. These results are robust to
sensitivity tests, especially alternative measures of performance (total factor productivity
2Theoretically, the negative impact of violence may transit through three main channels: (i) supply
channel (availability and cost of inputs); (ii) demand channel (contraction of demand, access to output markets); and, (iii) uncertainty (inducing firms to postpone hiring and investment decisions and adopting risk mitigating strategies). As explained in the following, we lack data to test the two latter channels. Indeed, the literature on the consequences of conflicts and violence on firms often focuses on supply channel (certainly due to lack of data). Firms suffer from limited access to inputs during conflicts, whether they are the labor (Collier and Duponchel, 2013; Ksoll et al., 2019), capital and investment (Singh,2013) or intermediate goods (Amodio and Di Maio,2018;Klapper et al.,2013).
and profit), alternative measure of input dependence, alternative definitions of the crisis
period, and additional econometric specifications taking into account sample selection
and spatial heterogeneity.
Our research contributes to a burgeoning literature on the consequences of
interper-sonal violence and civil conflict on firms. Recent works show that civil war and criminal
acts seriously disrupt business activities by reducing the performance of surviving
busi-nesses (e.g., Dupas and Robinson,2010;Klapper et al.,2013;Amodio and Di Maio,2018;
Rozo, 2018), inducing a stronger exit (Camacho and Rodriguez, 2013), changing firm
location (Blumenstock et al., 2020), reducing firm diversity (Rıos, 2019) and spurring
the growth of the informal sector (Bozzoli et al., 2013).3 However, to our knowledge,
only two papers examine how firms perform in the wake of a crisis. Ksoll et al. (2019)
point out that the impact of Kenya’s 2008 post-electoral crisis on the flower industry was
short-lived. Despite widespread worker absenteeism during the crisis, firms were able to
rebound within few days. The relatively short delay in recovery is consistent with workers
returning to their jobs shortly after the violence ended. Collier and Duponchel (2013),
however, document that five years after the end of fighting in Sierra Leone, the business
of firms located in the most affected areas still lagged. The authors explain the lack of
firm resilience by a ”forgetting by not doing” effect. Skilled workers lose their skills due
to a prolonged period of inactivity.
Our paper extends this scant literature on firm recovery by providing more robust
evidence allowed by the inclusion of the universe of formal firms (contrary to Ksoll et al.
(2019)) and the exploitation of information on firms before, during and after the crisis
(contrary to Collier and Duponchel (2013)). In addition, we reconcile findings from
both studies, as well as provide new results. An important difference that may explain
the contradictory conclusions between Collier and Duponchel (2013) and Ksoll et al.
(2019) is the duration of the conflict (respectively, two months and eleven years). In
our analysis, we exploit a short crisis (less than six months) but one that occurred in a
very politically unstable country. In this context, we highlight that even a short event
3Until recently, the literature on the economic consequences of political violence has been dominated
by cross-country analyses (Alesina et al.,1996;Cerra and Saxena,2008). First researches employing firm-level data has employed market valuation and document that consequences of conflict is heterogenous (Abadie and Gardeazabal,2003;Guidolin and La Ferrara,2007). However, these studies focus exclusively on listed firms and neglect the large majority of firms, especially in developing countries.
may have a persistent effect on firm performance in the medium run. In addition, both
papers focus on the importance of workforce. Our work documents that the relationship
between labor and resilience is rather complex, helping to explain contradictory findings
from both papers. Our results indicate that labor-intensive firms, that often rely on
unskilled labor (such as those in the flower industry examined by Ksoll et al. (2019)) are
more likely to recover as their workers are easily replaceable with little to no productivity
costs (learning by doing is achieved in several days). However, for firms that rely on
more complex production processes or on skilled workers, replacing departed employees
can have significant productivity costs. New workers are unable to immediately be as
productive as well as former ones. In addition, re-hiring skilled workers has a limited
effect due to the ”forgetting by not doing” effect (Collier and Duponchel, 2013) because
skills depreciate over time (Edin and Gustavsson, 2008). Finally, our paper sheds light
on the importance of capital access to strengthen resilience after a shock. This finding
indicates that financial access is not only important in normal times but also after the
occurrence of a shock.
Our article also contributes to the analysis of recovery after a conflict by providing
a microeconomic analysis of this process. There is quite a lot of controversy in the
literature regarding the long-term effects of civil conflicts on economic activity (Blattman
and Miguel, 2010).4 Usual Solow growth model implies that a destruction of production
factors has a temporary effect and countries catch-up with a more rapid accumulation of
physical and human capital. Several empirical investigations give support to this view
by focusing on major wars or bombing episodes (Organski and Kugler, 1977; Davis and
Weinstein, 2002; Miguel and Roland, 2011). However, recent macroeconomic studies
point out that recovery is partial after a civil conflict (Cerra and Saxena, 2008; Mueller
et al., 2017). The recovery process is rarely investigated at the micro-level despite its
importance to better understand channels through which recovery occurs. One exception
is Serneels and Verpoorten (2015) who document that six years after the conflict in
Rwanda, households and localities that experienced more intense conflicts are lagging
behind in terms of consumption. Our work contributes to this literature by focusing on
4We do not discuss a large literature on long-term effect of civil conflict on human capital through its
negative consequences on (child) health and education (see Blattman and Miguel,2010;Verwimp et al.,
firm’s ability to recover. We provide evidence in line with the partial recovery. Even if
firms were more able to rebound in the short-term, they do not experience a complete
recovery. Obviously, our contribution is limited by the time dimension but show than
even after three years firms do not experience quicker gains in productivity. Finally, we
also shed lights on the importance of reliance on specific input for recovery, particularly
labor.
Our work finally adds to a small body of literature focusing on political crises in
Cˆote d’Ivoire. Several papers have investigated the impact of the first Ivorian civil war
(1999-2005) on economic and social outcomes. The first Ivorian crisis had a detrimental
impact on child health (Minoiu and Shemyakina, 2012,2014) and on the education level
(Dabalen and Paul, 2014). Closest to our paper is Klapper et al. (2013) who study the
effects of the first Ivorian crisis on firms. They find a loss of productivity of approximately
20%, which decline was still strong for foreign companies or companies employing foreign
employees, as well as for companies in sectors that rely on imported inputs. However, the
authors focus on short-term effects (the first Ivorian crisis was not ended in 2003). We
confirm their main results regarding the role of firm characteristics (age, size, foreign or
domestic) and extend them by showing how dependence on inputs shape recovery across
firms.
The paper proceeds as follows. Section 2 describes the political context in Cˆote
d’Ivoire. Section 3presents the dataset used in the empirical section. Section 4discusses
the methodology. Section 5 presents baseline results and sensitivity analysis. Section 6
discusses our main findings. The last section concludes.
2
Context
2.1
The first political crisis (1999-2007)
Cˆote d’Ivoire is a West African country, with a diverse population of more than 26 million
(in 2017). It is a regional center of migration and foreigners account for one quarter of the
inhabitants (even more in Abidjan). The country has about sixty ethnic and linguistic
contin-uous economic prosperity characterized by sustained economic growth. Politically, Cˆote
d’Ivoire is a presidential system and was governed by F´elix Houphou¨et Boigny (FHB) after
its independence. Following the death of FHB on 7 December 1993, Henri Konan B´edie´
(President of the National Assembly) was appointed president. The economic challenges
for the new president were substantial, and included managing the devaluation of the CFA
franc and implementing austerity measures and economic liberalization reforms. Despite
an ambitious five-year program, social difficulties associated with structural adjustment
programs remained and the economy failed to rebound.
On Christmas Eve 1999, Henri Konan B´edie´ was deposed from power by General
Robert Gueı¨ (former army Chief of Staff) following a coup d’´etat. Presidential elections
were held a year later. Laurent Gbagbo, the historical opponent of FHB, rose to power
following violent clashes between his supporters and those of General Gueı¨. These
ten-sions, coupled with changes in economic ideology (from free-market to socialist) and the
development of the concept of ”ivoirit´e” to exclude northerners and foreigners reinforced
the social and political divide.
This situation led to the failed coup d’´etat of September 2002 and the assassination of
General Gueı¨. The failed coup turned into a rebellion and the country was divided into
two parts: the central, northern and western zones were controlled by the rebel forces of
the Patriotic Movement of Cˆote d’Ivoire (MPCI), led by the former student union leader
Guillaume Soro while the southern zone was controlled by the national army in support
of Laurent Gbagbo.
After a peak in violence in November 2004 (following the bombings of the French
base in Bouak´e), tensions diminished in 2005, as indicated in Figure 1. A durable peace
agreement was signed in 2007 (Ouagadougou agreement). The zone of confidence
estab-lished in 2002 between Soro’s rebel forces in the north and Gbagbo’s forces/supporters in
the south was dismantled. Soro became the head of government and Gbagbo remained
president. Between 2005 and 2010, the country experienced a relative period of calm,
a ”no war and no peace” situation characterized by increased uncertainty and sporadic
2.2
The second political crisis (2010-2011)
After five years of postponement, presidential elections were held in 2010 (in accordance
with the Ouagadougou agreement). After a peaceful first round, the final round
(Novem-ber, 28th) results were contested and both finalists claimed victory: Alassane Ouattara5
was recognized by the Independent Electoral Commission (CEI), the UN as an
indepen-dent observer and the international community while Gbagbo was declared the winner by
the Constitutional Council, which cancelled certain results proclaimed by the CEI. Thus,
Cˆote d’Ivoire found itself with two presidents Alassane Ouattara and Laurent Gbagbo
and two governments (headed by Guillaume Soro and Gilbert Ak´e Ngbo, respectively).
From January to April 2011, Abidjan was the scene of numerous clashes between
sol-diers of the pro-Ouattara ”Invisible Commando” and Laurent Gbagbo’s armed forces. In
western and northern Cˆote d’Ivoire, pro-Ouattara forces supported by the brotherhood of
the Dozos (traditional hunters) organized and advanced towards Abidjan (see Figure A1
displaying the march on Abidjan). The pro-Ouattara forces gradually seized several cities
in the country and entered Yamoussoukro on March, 30th. The next day, the Republican
Forces of Cote d’Ivoire surrounded Abidjan. After several days of intense fighting and
surrender, Laurent Gbagbo and his wife were arrested on April, 11th in the presidential
residence in Cocody (Abidjan). Gbagbo was taken prisoner in the north of the country
before being referred to the International Criminal Court (Netherlands) and charged with
crimes against humanity. Alassane Ouattara was instated as President of the Republic
of Cote d’Ivoire on May 21, 2011, and recognized by the international community.
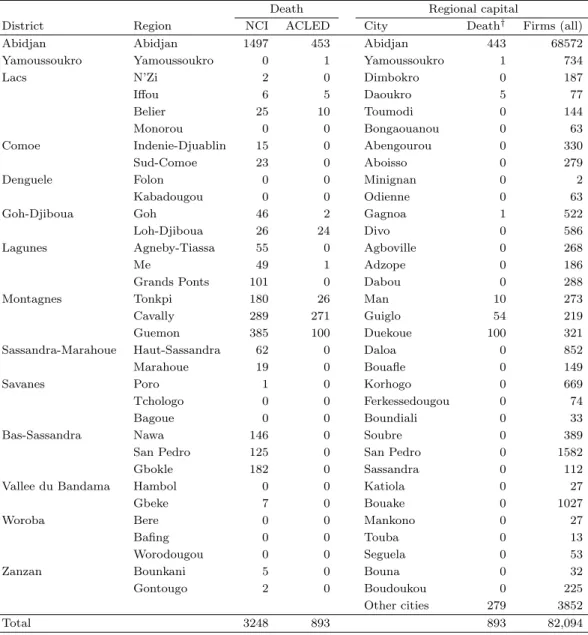
Despite its short duration, the 2011 post-electoral crisis had profound human
conse-quences. According to the National Commission of Inquiry, the civil conflict killed 3,248
people (see Table A1), particularly in the southern (Abidjan, Lagunes) and western parts
(Bas-Sassandra, Montagnes) of the country. In addition, the post-electoral crisis caused
the displacement of nearly 735,000 persons (recall that Abidjan is a center of internal and
5Finishing third in the first round, Henri Konan Be´die´ (former president) endorsed Ouattara for the
second round. Alassane Ouattara was the former prime minister under FHB. He was disqualified from the 2000 Presidential Election due to the new electoral code stating that both parents must be Ivorian to run (Alassane Ouattara was suspected to be Burkinabe).
regional migration).6 Several families fled the country by any means, a state of emergency
was declared and thousands of foreign nationals were evacuated (including nearly 12,000
French nationals).
The post-electoral crisis also had significant economic consequences in the short-term.
Ivorian cocoa was under embargo. Many banks, especially in Abidjan, were closed for
several months, there was a shortage of medicines, the country’s main refinery was no
longer able to buy crude oil and was at a standstill, which resulted in fuel and food
shortage (sugar, meat, oil, . . . ) whose prices skyrocketed. In short, the economy was
at a standstill. Since 2012, the country has experienced relative political stability and
economic recovery and has had one of the highest growth cycles in the world (more
than 8% on average per year). This renewed economic momentum was mainly driven by
an improvement in the business environment, ambitious investment plans and renewed
dynamism in agricultural.
3
Data
3.1
Dataset
Our analysis is based on firm-level data from the register of formal enterprises in Cˆote
d’Ivoire from 2006 to 2014. The register, collected by the National Institute of
Statis-tics (Institut National de Statistiques, INS henceforth), covers the universe of enterprises
operating in the formal sector in Cˆote d’Ivoire. It includes public, local private and
foreign-owned firms operating in all industries (agriculture, manufacturing, trade,
con-struction, services and finance). The unit of observation is the firm; but almost all firms
in Cˆote d’Ivoire are single-establishment firms (Klapper et al.,2013).
The register collects two types of information. First, we obtain general information on
firms including year of creation, location (city), industrial sector (two-digit), legal status
(limited liability, public company or other status), ownership structure (public; private;
foreign), and the number of employees. Interestingly for our investigation, the INS not
only provides the number of employees but also the number of managers (”cadres” in
6The International Displacement Monitoring Centre has advanced the figure of one million displaced
French) and the number of permanent and temporary workers. In addition, the database
reports basic financial information extracted from balance sheets (such as total assets
and debt structure) and income statements (such as total sales, value added, profit, taxes
paid, total payroll). All financial data are deflated using the GDP deflator (year base =
2009).
One advantage of this dataset is that companies continued to be monitored during the
crisis. It should be noted that INS checks firm-level information to detect irregularities.
As a consequence, we are confident with the accuracy of data.
Despite its richness, the database comes with some shortcomings. First, firms are
theoretically identified by a unique identifier. However, we observe some discrepancies in
the dataset. The same identifier is sometimes employed for two observations that appear
to apply to different firms. To detect any possible irregularities, we develop a procedure
described in the Appendix. According to this procedure, we recode 462 firms (less than
2% of the firms) and results are insensitive to this issue.
Second, informal firms are not included in the database. We are therefore blind to
firm dynamics in the informal sector and the migration between the formal and informal
sectors. While in many African countries, the majority of jobs are informal in Cˆote
d’Ivoire. However, according to recent estimates, formal sector accounts for two thirds
of economic activity in Cˆote d’Ivoire (Medina and Schneider, 2018) and its evolution is
crucial to provide decent jobs.
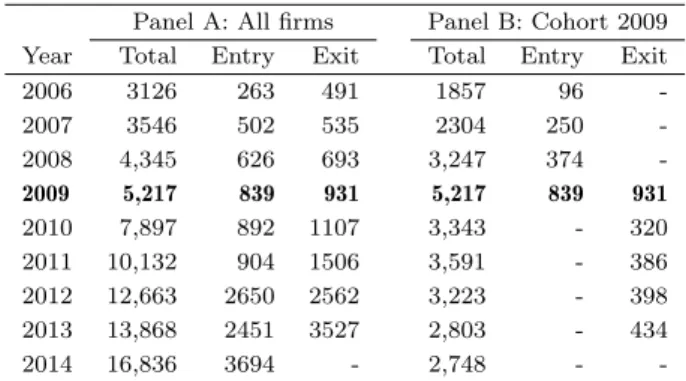
Finally, while our dataset allows us to follow post-entry performance of existing firms,
it provides limited information on firm entry. Some firms enter the dataset after their
registration, as indicated in Table 1(differences between the stock of firms (first column)
and flows of entries and exits).7 We are theoretically equipped to disentangle ”real entries”
and the registration of existing firms (by comparing the year of creation and the first year
in which the firm appears in the dataset). However, the year of creation is based on a
7Before 2008, formal firms in Cˆote d’Ivoire transmitted their financial statements to both fiscal
au-thorities (mandatory) and to the INS (not mandatory). As a result, some firms were registered with the fiscal authorities but not included in the INS dataset. In 2008, a single window was created to facilitate the transmission of data. Since 2010, the INS has begun to cooperate with the new institution to retrieve data on all formal firms.
declaration by the firm that the INS cannot check.8 In addition to dataset discrepancies,
a new law in 2012 blurred the effect of post-crisis conditions on firm entry.9 It should be
noted that the new legislation may explain the sharp increase in firm exits because new
firms are more likely to exit.
3.2
Sample
Our main objective is to investigate firm recovery following the 2011 post-electoral crisis
in Cˆote d’Ivoire. In doing so, we follow a cohort of surviving small and medium private
non-financial corporations operating from 2009 to 2014. Below we discuss the reasons
justifying for choosing this period and the sample of firms retained in the analysis.
3.2.1 Period
A first critical point for analyzing firm recovery consists in defining proper pre-crisis and
post-crisis periods. Although we have data from 2006, we exclude 2006, 2007 and 2008
in our baseline analysis. This decision is based on the recent history of Cˆote d’Ivoire,
described in the previous section. We face a trade-off to select the pre-crisis period:
Choose sufficient periods (at least one) before the crisis that does not overlap with the
post-crisis period of the first Ivorian crisis. The first Ivorian crisis was officially over
in 2007 (Ouagadougou Agreement) but combat was terminated in 2005, as indicated
in Figure 1. We made the choice to consider 2009 and 2010 as the pre-crisis period
(benchmark). The first year considered (2009) is three years after the end of the first
Ivorian crisis, which allows us to assume that all of that conflict’s post-crisis effects have
occurred before this date. We consider 2010 as a pre-crisis year because the post-electoral
conflict began in the end of the year and weakly affected firms during 2010, as indicated
in Figure A2.
Turning to our post-crisis period, an ideal set-up involves a period without conflict.
8A simple observation of entries points out that some entries defined as real entries are subject to
caution. For instance, some new firms entered with more than 100 employees.
9In 2012 an administrative order has been adopted to facilitate the creation of new firms through a
unique guichet or window (Centre de Promotion des Investissement en Cˆote d’Ivoire, CEPICI ) and a reduction in the number of procedures (Article 4 of order number 2012-867, 6 September 2012. As a result, we fail to disentangle the impact of the end of the post-electoral crisis and the impact of the 2012 law in explaining the sharp increase in the number of entries after 2012.
While we observe some events after, their intensity had largely decreased. In addition,
economic activity regained renewed dynamism and vigor just after the post-electoral crisis
of 2011 (from 2012 onwards). As a consequence, we consider the years from 2012 to 2014
as the post-crisis period (we are limited to the final year by data availability). In any
case, 2015 was an election year in Cˆote d’Ivoire, which may have changed the behaviour
of firms.
3.2.2 Sample of firms considered
As our main interest involves firm resilience, we follow a cohort of surviving firms from
2009 to 2014. We consider only firms operating in 2009 and do not include new firms.
Indeed, as explained above, we cannot investigate firm entry due to data discrepancies
(false entries) and the adoption of a new law in 2012 to facilitate entrepreneurship.
We apply some additional filters. We drop public and semi-public firms (190 firms) as
these firms are potentially related to political power and their business can be influenced
by electoral cycles. We also drop firms operating in finance (549 firms) because financial
corporations differ in many aspects to non-financial corporations. Finally, we exclude
firms in domestic work and extraterritorial business due to the limited number of firms
in each sector (one firm only in each).
We then withdraw large firms, defined as those having more than 100 employees in
2009 (367 firms). Small and Medium Enterprises account for 65% of employment and
55% of GDP in Cˆote d’Ivoire (OECD, 2016). The exclusion of large firms is justified for
several reasons. First, large firms are more likely to be connected with political leaders
that may impede (for those close to Gbagbo) or improve (for those close to Ouattara) their
recovery. Second, a political crisis is not exogenous for larger firms. Their performance
may affect the economic situation and therefore have an impact on the occurrence of the
post-electoral shock (at least at the local level). Finally, this decision is also data-driven.
For unexplained reasons, we observe that the number of employees of many (large) firms
presents an unexplained hike in 2013 (the number of employees doubled or tripled in 2013
and returned to their ”normal” levels in 2014).
Our sample is reduced to 5,217 firms (see Panel B of Table 1), including 839 new firms
after 2009 and no exit before 2010. The number of exits is the highest in 2010, which
could be explained by the market churning insofar as new firms have a higher probability
of leaving the market. In this paper, we focus exclusively on firm recovery and therefore
exclude exiters (2,469 firms). Our final sample therefore includes only 2,748 small and
medium firms operating in 2009 and surviving until 2014.10 Characteristics of these firms
in 2009 are displayed in Table 2.
3.3
Variables
3.3.1 Productivity
Our aim is to study how firms operating in 2009 and surviving until 2014 were able
to rebound after the 2011 post-electoral crisis. In line with previous works (
Hallward-Driemeier and Rijkers,2013), our preferred measure of firm performance is productivity.
Indeed, firms in developing countries suffer from misallocation reflected in differences in
terms of productivity and firm size (Hsieh and Klenow, 2009; Restuccia and Rogerson,
2017).
In an ideal world, we should focus exclusively on total factor productivity (TFP),
especially because we draw special attention to labor and capital. The TFP has the
advantage of better proxying pure productivity shock because it is a residual that
con-tains any information not captured by observed inputs (labor and capital). However,
computation of TFP requires data on capital and labor. We exploit the data on tangible
capital assets that are available for only one third of firms and use the applied approach
developed by Olley and Pakes (1996). Details on the computation of TFP are provided
in the Appendix.
We therefore also consider labor productivity, defined as value added per worker, as
done in other works (Cole et al., 2017). The main advantage for us is the availability
of information on value-added and workers that allows us to compute labor productivity
for all firms. Another advantage of labor productivity is the possibility to break out its
10In the econometric analysis, the number of firms included is reduced because some variables are not
available (especially information on employment). In addition, for our econometric analysis, we exclude extreme values for financial data (top and bottom percentiles) and for firms with negative value added (because we employ a logarithm of labor productivity). It should be noted that an ongoing research is dedicated to the exit. This analysis has to tackle specific challenges such as the time definition of exit.
components (value added and workers). Both sub-components are also measure of firm
performance in terms of wealth (value added) and job (workers) creation. In addition, by
comparing evolution of both figures, we may better understand how firms cope with the
shock. The value added has been deflated using the GDP deflator and translated in euros
using the official exchange rate. The number of workers is obtained by taking the total
number of employees plus one (the manager and/or owner). We consider the number
of permanent and temporary workers. Temporary workers are often employed in Africa
to adjust production. The share of permanent workers increases with firm size. As a
result, employing the number of permanent workers instead of total workers biases labor
productivity results by increasing the labor productivity for small firms and reducing the
labor productivity for large firms.
3.3.2 Input usage
A major contribution of this paper consists in scrutinizing which firms were best able
to rebound. According to the literature, three main channels may affect a firm
dur-ing and after a crisis: (i) supply channel (availability and cost of inputs); (ii) demand
channel (contraction of demand and access to output markets); and, (iii) uncertainty
channel (inducing firms to postpone hiring and investment decision). Ideally, we would
investigate each channel. Unfortunately, our dataset allows us to test the supply channel
exclusively.11 However, existing papers (e.g., Collier and Duponchel, 2013; Amodio and
Di Maio,2018) point out that constraints on inputs play a major role during a crisis. We
thus focus on labor and capital.12 Our aim is to identify is a firm relied more on a specific
input for its production before the crisis (e.g., in 2009) relative to other firms in the same
sector.
Labor: We focus not only on the share of labor in the production process but also on
its composition. We firstly consider the importance of labor in the production process.
In doing so, we compute the cost of labor (total payroll) relative to total sales. We expect
11We do not gain access to data such as the export status of firms or investments that would allow us
to test any channels other than the supply channel.
12In a previous analysis, we also consider intermediate goods by computing their cost (difference
between sales and value added) to sales. However, results are highly unstable and do not allow us to draw a clear-cut conclusion.
that firms dedicating a larger share of their revenues to pay wages are more dependent on
labor (irrespective of its composition). Even if we exploit within industry variation, we
display in Table A2in the Appendix, our proxy for labor dependence by industry allowing
us to gauge the relevance of our indicator. Without surprise, we see that tertiary activities
(tourism, transport, services to enterprises, education and health) rely more on labor in
their production process than other sectors do.
We then consider two proxies to capture differences in the composition of labor. First,
we consider the share of managerial staff (”cadres” in French) to total workers. Firms
with a higher relative share of managers rely on a more complex production process that
require more coordination. We expect that these firms are more dependent on a few
work-ers (managers) to maintain their level of productivity. Second, we consider the average
wage by dividing total wages paids by the number of total workers. The average wage is
often employed to gauge the skill level of the workforce (Cole et al., 2017). One might
raise concerns that average wage is correlated with (labor) productivity but across-firm
correlation is far from perfect (ρ = 0.36). Turning to differences across industries, Table
A2 indicates that extractive industries, transport and services to enterprises are sectors
employing the largest share of managers. This statistic confirms that managers play an
important role in industries with a complex production process. Interestingly, these
in-dustries, along with electricity, are also those that pay a higher average wage.
Capital: In the absence of a perfect proxy for credit access, we consider two measures
of quantity and two measures of prices. First, we build the debt ratio by dividing the
sum of (short-term and long-term) financial debt to total assets. Firms with a larger debt
ratio are assumed to be less credit constrained than their counterparts (the use of equity
is rather limited in Cˆote d’Ivoire). We also compute the ratio of trade credit to total debt
(financial debt and trade credit). The theory of trade credit is unclear: trade credit may
act as a substitute or a complementary of formal finance. Nonetheless, the substitution
role of trade credit is heightened in a context of scarcity of funds following a financial
crisis (Carbo-Valverde et al.,2016) or in countries with under-developed financial markets
as Cˆote d’Ivoire (Fisman and Love, 2003). We therefore assume that firms relying more
counterparts.
Next we try to assess the cost of lending for firms. In doing so, we compute the
financial cost defined as financial expenses to total revenue, and the implicit interest rate
computed as the ratio of financial expenses to total debt. Credit-rationed firms are
there-fore those with a limited debt ratio, a higher level of trade credit and higher financial
costs. Table A2(Panel B) points out that extraction, construction and services to
enter-prises are the least credit constrained industries.
Exploitation of within-industry differences: Contrary to the existing literature, we
fo-cus on differences in input across firms operating in the same industry. A usual approach
consists in comparing firms operating in different industries (Hallward-Driemeier and
Ri-jkers,2013;Klapper et al.,2013). For instance, if access to capital is the main channel by
which a crisis has affected firms, we expect that firms operating in industries relying on
external capital will suffer more than their counterparts. Considering industry-level
indi-cators implicitly assumes that all firms in the same industry face similar constraints. We
raise doubts about the homogeneity assumption and its applicability in our context. First,
the literature on firm productivity in developing countries sheds light on heterogeneity
across firms within the same industry due to differences in access to inputs (Restuccia
and Rogerson, 2017). Second, dataset employed here does not provide a fine-grained
definition of industries (two-digit). Third, our data, displayed in Table A2, point out
that differences in input usage across firms in the same industry are substantial. In the
Appendix, we document that more than 95% of variations in input usage are explained
by within-industry variations rather than between-industry variation (see Table A3).13
To account for differences across firms within industry, we normalize input usage using
the average of the industry. Specifically, for each input, we create a dummy equal to 1 if
13To quantify the importance of within-industry and between-industry variations in the use of input,
we regress our different measures of input usage on industry dummies. We consider several specification including all observations available in the dataset and only firms included in our sample (all years or only in 2009). Results are insensitive to different specifications, as indicated in Table A3. Industry dummies capture variation between industries, while the unexpected part refers to within-industry variations. These dummies explain less than 5% of variation for input usage, except for cost of labor to sales (8%). It should be noted that firm characteristics (age, size, location and foreign-ownership) have a limited explanatory power of input usage, except for average wage (the four variables explain 13% of variations).
the firm value exceeds the mean of the sector where the firm operates, as follows: Xij(t0)= 1, if xij(t0)− ¯x.j(t0) > 0; 0, otherwise.
where xij(t0) is the value for each input for firm i in industry j before the crisis (i.e., in
2009) and ¯x.j the average in the industry j at the same period (t0). In other words, our
measure takes the value of 1 if a firm relied more on the input considered than firms in the same industry did before the post-electoral crisis.
4
Methodology
Our main objective is to analyze the impact of the effect of firm characteristics and input on firm recovery. In doing so, we consider a simple fixed effects model with interactions as follows:
Log(P )ijt= αi+ β1AF T ERt+ β2AF T ERt× Xij(t0)+ β3AF T ERt× Cij(t0)+ εijt (1)
where Log(P )it denotes the log of productivity.14 AF T ERt is a dummy taking the value
of 1 for years after the occurrence of the crisis (from 2011 to 2014) and 0 before the crisis
(2009 and 2010). We consider a dummy taken into account the crisis and the post-crisis
period because our main objective is to compute the net effect. In additional estimations,
we disentangle the crisis period (2011) and the post-crisis period (2012-14) to scrutinize
whether input reliance has differently affected both phases. We interact the AF T ERt
dummy with our dummies for input (Xij(t0)), as described above. These input dummies
are measured in 2009, i.e. before the crisis (t0). To control for confounding factors
im-pacting both input usage and recovery, we include interactions between the AF T ERt
dummy and firm characteristics measured in 2009 (Cij(t0)). Firm characteristics include
firm size (in terms of assets and workers, both in logarithm form), firm age, a dummy
for foreign-owned firms, a dummy for firms located in Abidjan and a dummy for each
14Over the sample considered, 15.4% of all observations reported a negative value of value-added and
are therefore excluded in regressions with labor productivity. We got data on capital for less than one third of enterprises, limiting our ability to compute TFP.
industry. Table 2 documents that one quarter of firms are foreign-owned. The average
firm size is 12 workers and firms are 7-years old on average. Almost all firms (more than
90%) are located in Abidjan. Enterprises operate mainly in services, especially in trade
(36%) and services to enterprises (21%), followed by construction (12%) and
manufac-turing (10%).
One might be surprised by the simplicity of the econometric model. We discuss our
main choices below.
First, we consider input usage and firm characteristics before the crisis because our
aim is to investigate whether initial differences impacted firm performance during and
after the crisis. The best way to do so consists in using initial values (before the crisis).
Furthermore, employing time-varying control variables may induce a simultaneous bias
insofar as the crisis may affect both the dependent and independent variables.
Second, contrary to previous works (Collier and Duponchel, 2013; Camacho and
Ro-driguez,2013;Ksoll et al.,2019), we do not exploit spatial heterogeneity in crisis exposure.
As indicated in Table A1, the majority of firms are located in Abidjan which was strongly
affected by the crisis.15 Unfortunately, we are unable to exploit richer information on
lo-cations within Abidjan (Abidjan is divided in 10 municipalities). Indeed, neither the
INS dataset on firms nor the ACLED database on conflicts provide precise location (e.g.,
municipality) within Abidjan. In addition, one might raise that conflict location is not
random and influence by firm activity. A large literature has investigated the economic
roots of civil conflicts (Blattman and Miguel, 2010). Firm performance as well as
in-tensity of the conflict may be shaped by proximity to the power. As a result, we focus
on before/after analysis and assume that the treatment (crisis) is common for all firms,
irrespective of their location. A major limitation of exploiting only time variation is the
fact that AF T ERt dummy captures all changes occurring during crisis and post-crisis
periods. It may account for factors unrelated to crisis/postcrisis events during the period
(e.g., change in economic environment). However, we expect that the post-electoral crisis
15It should be noted that data on conflicts at the local level are extracted from the ACLED database,
which provides the location of events. However, information reported should be treated with caution because the ACLED reports fewer events/fatalities than the more complete data provided by the National Commission of Inquiry (see Table A1).
was the biggest shock occurring in Cˆote d’Ivoire over the period. We relax this
assump-tion by computing an index of conflict intensity at the city level. Our findings are similar
than those reported in the baseline.
Finally, our identification strategy relies on the assumption that we control for all
characteristics affecting both input usage and a firm’s ability to rebound after a shock.
This motivation explains why we control for firm characteristics (age, size, ownership,
etc.) that could affect the input mix in 2009, as well as rebound. In addition, the
inclusion of firm fixed effects allows us to control for time-invariant (unobserved) firm
characteristics, such as skill level of managers, network or internal organization of the
firm (e.g., management practices). Unfortunately, we cannot control for time varying
unobserved characteristics. However, we expect that this issue does not disqualify the
analysis. To bias our findings, unobserved factors should not only be related to recovery
but also correlated with input usage in 2009. In theory, this possibility exists. The most
probable explanation induces a change in company management between 2009 and 2014.16
However, to be statistically detectable this situation should concern many enterprises that
is unlikely, at least because many SMEs in developing countries are family firms with few
changes in top management and firm organization over time (Carillo et al.,2019).
5
Results
5.1
The net impact of the crisis
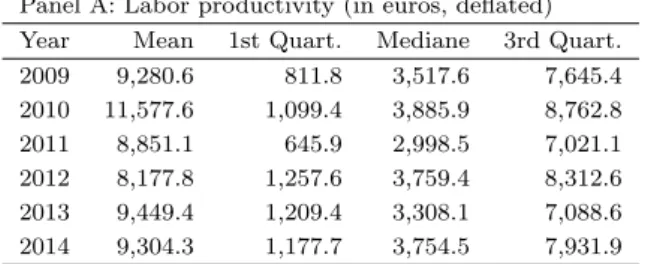
Table 3 scrutinizes the evolution of productivity (labor productivity and total factor
productivity) for active firms (2,748 firms) from 2009 to 2014 per year. In Table 3, we
display the mean, quartiles and median for the three variables, by year. We see an increase
from 2009 to 2010 of labor productivity and its components (value added and number of
workers). However, labor productivity, as well as value added and the number of workers,
decreased in 2011. The impact of the crisis was significant for labor productivity, which
shrank by 23%. Interestingly, the amplitude of this drop is close to that observed by
16For example, a bad manager has been replaced by a good manager (or the vice versa). The bad
manager should be less able to attract skilled workers and obtain loans. Therefore, we should note that companies with less capital and skilled labor-intensive activities outperform after the crisis due to this change in manager (or vice versa).
Klapper et al. (2013) in the first Ivorian crisis. The recovery seems imperfect for labor productivity. Even if on average the level of labor productivity in 2014 is superior to that in 2009, the labor productivity cannot attain the level of 2010 at the end of the period of observation. Meanwhile, the impact of crisis on value added and workers seems more temporary (one year for value added and two years for employment). In Panel B, we focus on total factor productivity for an handful of firms for which we were able to compute it. Surprinsingly, TFP declined mainly in 2012 (and not in 2011). However, the decline was impressive with a reduction of almost 50%. However, the rebound seems stronger, and the value of TFP reachs pre-crisis value in 2014.
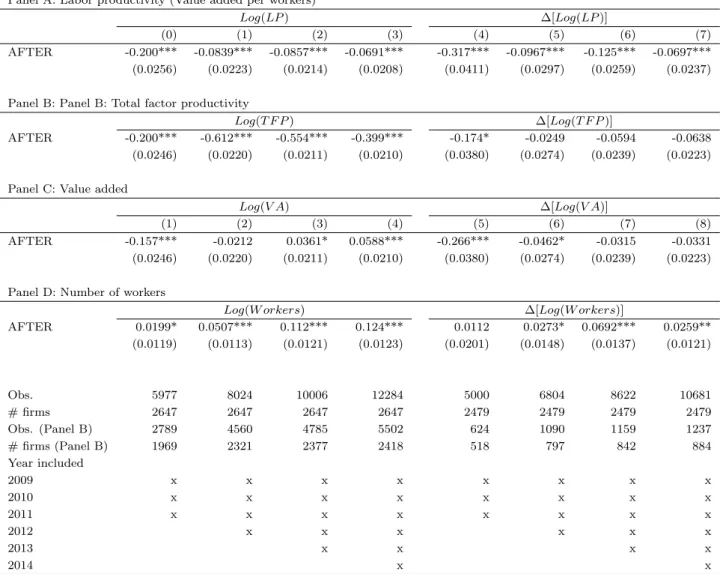
To provide more direct evidence, we run a simple fixed effects model with the AF T ERt
dummy.17 To gauge the impact of the crisis, we firstly consider the pre-crisis period
(2009 and 2010) and the crisis year (2011). We then add post-crisis years one by one
(2012, 2013, 2014). Results, displayed in Table 4, confirm the raw statistics for labor
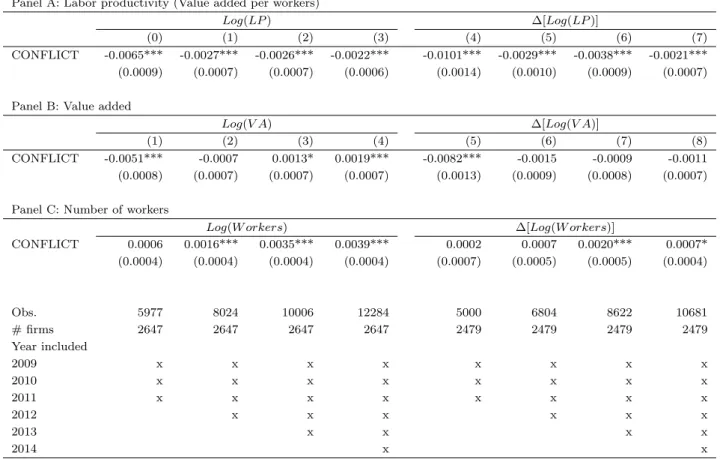
productivity (and its components). The level of labor productivity decreased by 20% during the crisis. There was a rapid recovery one year after the crisis (in 2012) but the level of labor productivity remained ten percent lower three years after the crisis. We then investigate the impact of the post-electoral crisis on labor productivity components, namely value added and the number of total workers. The negative impact of the crisis on value added is temporary, as documented in Panel B. The number of workers was not really impacted by the crisis and continued to expand over time (Panel C). The difference in evolution between value added and the number of workers explains the global negative trend on labor productivity. We document that our findings are robust to the use of growth (columns (5-8)) instead of level for all variables (labor productivity, value added and the number of workers). In addition, these findings are in line with a macroeconomic
analysis documenting a net rebound in Cˆote d’Ivoire after the post-electoral crisis.
Findings are not in line with raw statistics when we consider TFP (Panel B of Table
4). We fail to observe a rebound when we control for firm unobserved characteristics.
The decline is rather important in 2011 (-20%) but even stronger in the next year. Three years after the crisis, on average, TFP is lower by 40% than before the crisis.
To summarize, findings on global impact of the crisis point out that the post-electoral
17The specification is Eq. 1 without interactions as follows: Log(P )
crisis has a profound and permanent impact on productivity (labor productivity or TFP
even if figures diverge). For labor productivity, the evolution is rather explained by a
contraction of wealth creation, while job creation has been less affected by the crisis.
5.2
The heterogenous impact of the crisis
5.2.1 Firm’s characteristics
Our main aim consists in investigating differences in recovery across firms, according to
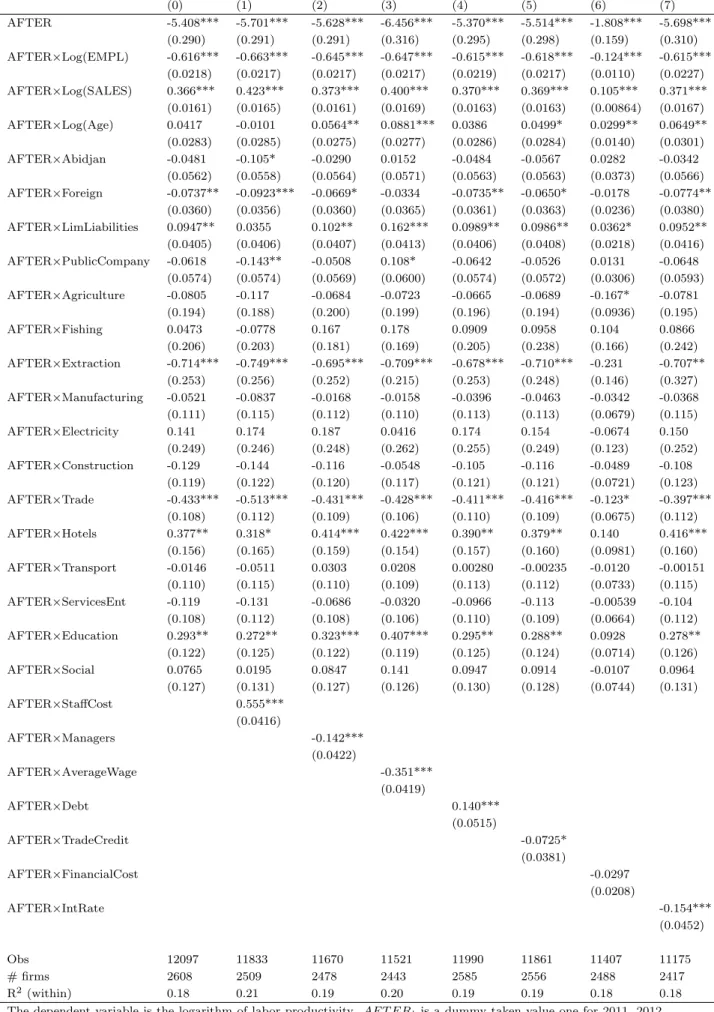
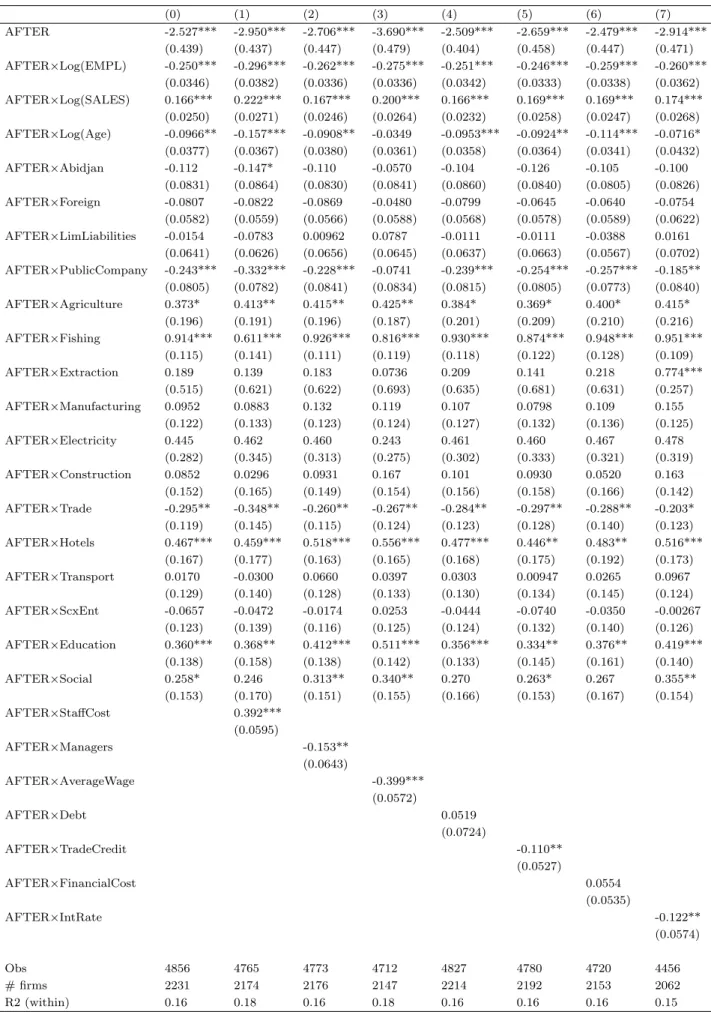
their initial conditions. Tables 5and 6present the results of our baseline model (Eq. 1)
including interactions for labor productivity and total factor productivity, respectively.
Before focusing on input, we briefly discuss the results regarding firm characteristics. The
column (0) reports the results when we keep only interactions with firm characteristics.
Despite differences in period coverage and measurement of productivity, our findings are
very similar to those obtained by Klapper et al. (2013) for the first Ivorian crisis. First,
even if xenophobia was less explicit in the second Ivorian crisis, we see that foreign firms
also suffered more than their local counterparts during the second episode. Foreign firms
which are more externally oriented and therefore require access to foreign markets, are
more sensitive to disturbances in infrastructure and logistic chains.
Second, the impact of firm size is ambiguous but also in line with econometric results
produced by Klapper et al. (2013) (see Table 7 in their paper). Larger firms measured by
the number of workers suffered more than small ones. However, we find the opposite sign
for sales. At the same time, the smallest companies (less than 10 employees) were able
to rebound faster than the others. Several explanations can be put forward. First of all,
small structures are more flexible to face an uncertain future. They are more oriented
towards local markets, making them less sensitive to infrastructure disruptions, have a
much simpler structure and management, which allows them to adapt more immediately
to market variations and logistics problems.
There is an ambiguous effect of firm age difference between older and younger firms,
which seems sensible to measure of productivity considered. The location of firms in
Abidjan does not seem to matter (but more than 90% of firms are in Abidjan in our
trade sector suffered more during and after the crisis than firms in other sector. On the opposite side of the spectrum, firms operating in tourism and education experienced a positive increase of productivity. The impact on other industries (extraction, fishing) is not robust when we consider the alternative measure of productivity.
5.2.2 Labor
We now focus on how input dependence before the crisis has impacted a firm’s ability
to rebound after the crisis in the rest of Tables 5 and 6. In both tables 5 and 7, results
regarding labor are reported in columns (1) to (3) and those related to capital in columns (4) to (7).
We first focus on workforce by using one measure of labor intensity in the production process (staff cost) and two measures of labor composition (share of managers and av-erage wage). First, we document that firms that relied more on labor before the crisis, irrespective of composition were more resilient than their counterparts, as indicated in
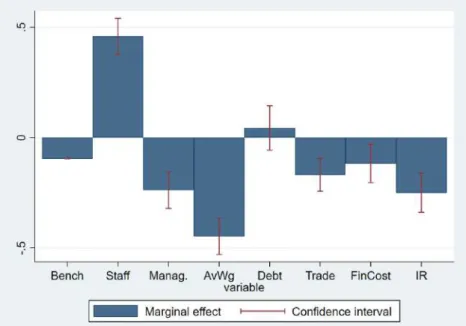
column (1) of Tables 5and6. To get a sense of our estimation, we plot the impact of the
crisis on labor productivity for a hypothetical average firm in Figure 2. In the first bar,
we set up all input dummies to zero.18 We then consider how the net impact of the crisis
changes when we switch dummy from zero to one for each input (and provide confidence
intervals). In Figure 2, we show that the average firm suffered from a 10% contraction
of labor productivity after 3 years (all input dummies are set to zero). However, com-panies relying on labor experienced an increase by 45% as indicated by the second bar
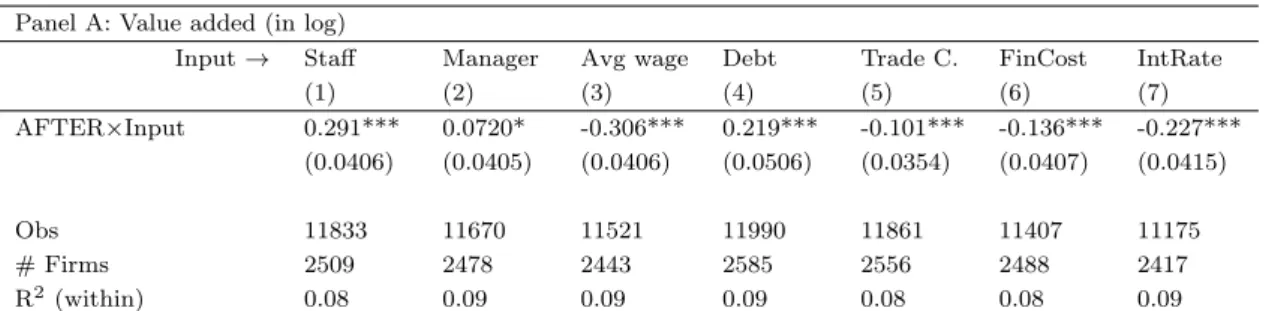
(we change the dummy for labor-intensive firms from 0 to 1). Table 7 (Panels A and
B) indicates that firms with higher staff costs increased their productivity after the crisis because they experienced an increase of value added and a contraction of employment. In addition, Panels C and D show that labor intensive firms suffered less than other firms during the crisis (in 2011) as well as in the post-crisis period.
We then turn to the composition of labor. Results displayed in columns (2) and (3) of both tables point out that the composition of the workforce matters. Firms relying more on managers and that had more skilled workers (higher average wage) suffered more than other firms. The level of labor productivity for firms relying on managers decreased
by 20% after three years and by 40% if we refer to average wage as a proxy of skilled
workers, according to our computation, displayed in Figure 2. For both measures of labor
composition, we observe an increase in the number of workers for firms relying ex ante
on managers and/or skilled labor (Table 7, Panel A, columns 2-3). Meanwhile, the value
added grew slower (managers) or decreased (average wage). In addition, we document
(in Panels C and D of Table 7) that these enterprises not only suffered more during the
crisis but were less able to rebound afterward.
5.2.3 Capital
It is often accepted that financial access is an important driver of firm growth. Next,
we investigate how financial constraint affects firm dynamics after a political crisis. In
doing so, we employ two measures of quantity and two measures of price. We assume
that less credit constrained enterprises have a higher level of debt ratio, a lower level of
trade credit and lower financial costs. As previously, these characteristics are measured
before the crisis (in 2009) and we control for firm fixed effects and interaction with firm
characteristics (age, size, location and industry) to limit endogeneity issues (see Eq 1).
Results displayed in Tables 5 and 6 (columns 5-6) point out that credit-constrained
firms faced a greater decline in productivity, irrespective of its measure. Interestingly,
results on labor productivity components reported in Table 7 (Panels A and B) are also
consistent. Firms with a better access to credit before the crisis expanded both in terms
of value added and in terms of employment.
Econometric results from Panel C and Panel D of Table 7 document that access to
finance was crucial during the post-crisis period, but less important amid the crisis. Put
differently, credit-constrained firms did not suffer more during the crisis than
uncon-strained ones but were less able to rebound when the crisis was over. This finding is
consistent with the fact that banks closed during the crisis in Cˆote d’Ivoire, particularly
in Abidjan. As a result, firms with better banking relationships could not exploit them
during the crisis. However, in the following years, these firms were privileged by banks
5.3
Sensitivity analysis
5.3.1 Robustness checks
We run several robustness checks. Results are displayed in the Appendix (Tables A4
-A11).19 First, we exploit (limited) information on spatial heterogeneity in conflict
inten-sity at the district level. As explained in Section 4, we rely exclusively on time variation
in our baseline. This choice is motivated by (i) limited spatial variability and (ii) the
risk of endogeneity for local measure of conflict. As a first robustness check, we
con-sider conflict intensity. To proxy the conflict intensity, we report the number of deaths
per 100,000 inhabitants. We employ data on the number of deaths per district provided
by the National Commission of Inquiry and reported in Table A1 (third column). The
number of inhabitants is obtained from the last population census. The conflict variable
(CON F Lit) takes the value of 0 before the crisis (in 2009 and 2010) and the number
of deaths per 100,000 inhabitants after 2011. Conflict intensity ranges from 0 to 41.9 in
the Gu´emon district in the West (31.8 in Abidjan). We rerun the same model as Eq.
1, except that the AF T ERt dummy is removed and replaced by our measure of conflict
intensity (CONF Lit) as follows:
Log(P )ijt= αi+ β1CON F Lit+ β2CON F Lit× Xij(t0) + β3CON F Lit× Cij(t0) + εijt (2)
where CONF Lit is the conflict intensity in district where the firm i is located. We first
rerun baseline model without interactions in Table A4(similar table than those reported
in Table 4). To compare results, we should recall we previously exploit a dummy variable.
19We present robustness checks for labor productivity only. However, we run robustness checks for
TFP and results are in line with our baseline (results available upon request). We also estimate additional unreported robustness checks. First, we consider all firms instead of small and medium enterprises, by including companies with more than 100 employees in 2009. Second, we test another proxy of skilled workers by using the ratio of permanent workers to total workers. The use of long-term contracts is rather scarce in Africa and concerns only a small percentage of workers. If we assume that long-term contracts are used to retain workers with specific assets (Williamson, 1979), the share of permanent workers is therefore a proxy of reliance on hardly interchangeable workers for the firm. Our findings are closely similar to those obtained when we consider the share of managers. We then include all input dummies in the same specification because different proxies might reflect the same feature due to complementaries in production technology. Finally, one might argue that input dummies capture a catching-up effect, explaining why labor-intensive firms perform better than firms that rely on skilled workers. To account for this problem, we include a lagged value of productivity (dynamic panel) in levels or interacted with the AF T ERtdummy without altering our conclusion.
We now rely on a continous measures. On average, districts experienced battles had 27 deaths per 100,000 inhabitants. By using this value, we observe a decrease of labor productivity of 18% in 2011 and around half of losses was recoup in the next year, in line
results from Table 4. We then report the baseline results with the measure of conflict
intensity in Table A5. Results are very close to those observed in the baseline analysis
(Table 5).
In Table A6, we split the sample between firms in Abidjan and firms outside Abidjan.
Results for firms in Abidjan are in line with baseline (because the large majority of firms are located in Abidjan). For firms in other regions, despite a sharp reduction in the number of observations, our main findings for labor are unchanged. For capital, the coefficients have the same sign as in the baseline analysis but are not statistically
significant. There are two possible explanations based on (i) the limited number of
observations and (ii) the bank branch network that is concentrated in Abidjan.
Second, we test whether our findings are sensitive to the measure of performance in
Table A7and Table A8. In the baseline, we considered several measures of performances
(labor productivity, TFP, value added and employment). We then consider alternative
proxies for performances. In TableA7, we change the measurement of labor productivity
by modifying the denominator (only permanent workers in Panel A and total payroll in
Panel B) and using variations of labor productivity in Panel C. In Table A8, we consider
alternative measures of performances based on accounting results (profits). In Panel A, the dependent variable is the logarithm of profit, defined as earnings before interest and taxes. We consider the ratio of gross operating surplus to sales in Panel B and the return on assets in Panel C as measures of profitability. Our econometric results are largely confirmed.
Third, we play with the measurement of input usage. In Panel A of Table A9, we
create a dummy based on the median in the industry rather than the mean. In Panel B, we consider continuous measures instead of dummies. In both cases, our results are unchanged.
Fourth, we change our definition of pre-crisis and crisis periods. In Panel C of Table
A9, we include 2008 in our pre-crisis period without altering our conclusion.20 In the
following row, we include 2010 in the crisis period. Indeed, as shown in Figure A2, the post-electoral crisis began in December 2010. Finally, we run a placebo test to be ascertain that differences between firms after the crisis are not explained by different trajectories
before the crisis.21 We consider the years from 2007 to 2009 and create a crisis dummy
equal to one in 2009. We expect that input dependence will not affect labor productivity before the crisis. With the exception of debt ratio (column 4), we see in Panel E that interactions are not significant, in line with expectations.
Fifth, we address the sample selection issue. The baseline specification suffers from a sample selection issue because we exclude exiting firms. To control for this problem, we develop a sample selection model for fixed effects panel data. In this paper we employ
the three-step procedure proposed by Wooldridge (1995) (see Baraton and L´eon, 2021,
for a recent application of this procedure). Details about the method are reported in the Appendix and results are displayed in Panel F of Table A9. We document that our findings, except for proxies of labor composition, are unchanged after controlling for sample selection. For the composition of labor, the coefficients have the expected signs but are not statistically significant at the usual thresholds.
5.3.2 Additional analysis
We then examine whether our findings regarding labor could be explained by a different story. One might argue that the complex relationship between labor and recovery is explained by other channels, especially the demand channel. Indeed, labor-intensive firms may sell their products in local markets, contrary to skilled worker/manager-intensive firms that are more dependent on national or international markets. As a result, the impact of labor could be due to limited access to markets (lower resilience for firms selling their production in remote markets). Due to lack of data (e.g., export status), we cannot directly test this hypothesis. However, we present an indirect proof against this explanation. We document that the share of managers and the average wage have been negatively impacted by the crisis with an imperfect recovery; but only for firms dependent
on skilled workers before the crisis (see Table A10). The share of managers was reduced
findings remain unchanged.