Publisher’s version / Version de l'éditeur:
Vous avez des questions? Nous pouvons vous aider. Pour communiquer directement avec un auteur, consultez la première page de la revue dans laquelle son article a été publié afin de trouver ses coordonnées. Si vous n’arrivez pas à les repérer, communiquez avec nous à [email protected].
Questions? Contact the NRC Publications Archive team at
[email protected]. If you wish to email the authors directly, please see the first page of the publication for their contact information.
https://publications-cnrc.canada.ca/fra/droits
L’accès à ce site Web et l’utilisation de son contenu sont assujettis aux conditions présentées dans le site LISEZ CES CONDITIONS ATTENTIVEMENT AVANT D’UTILISER CE SITE WEB.
Building Research Note, 1978-12
READ THESE TERMS AND CONDITIONS CAREFULLY BEFORE USING THIS WEBSITE. https://nrc-publications.canada.ca/eng/copyright
NRC Publications Archive Record / Notice des Archives des publications du CNRC :
https://nrc-publications.canada.ca/eng/view/object/?id=48049f75-5936-41b6-8214-ba688d6a2d5a https://publications-cnrc.canada.ca/fra/voir/objet/?id=48049f75-5936-41b6-8214-ba688d6a2d5a
NRC Publications Archive
Archives des publications du CNRC
This publication could be one of several versions: author’s original, accepted manuscript or the publisher’s version. / La version de cette publication peut être l’une des suivantes : la version prépublication de l’auteur, la version acceptée du manuscrit ou la version de l’éditeur.
For the publisher’s version, please access the DOI link below./ Pour consulter la version de l’éditeur, utilisez le lien DOI ci-dessous.
https://doi.org/10.4224/40000573
Access and use of this website and the material on it are subject to the Terms and Conditions set forth at
NRC Solar Monitoring Program
NRC SOLAR MONI'FOHING PROGRAM
by
S . A . Barakat, W.E. Carscallen and B . E . S i b b i t t
1. INTRODUCTION
A major o b j e c t i v e of the s o l a r energy program in Canada is t h e g a t h e r i n g of d a t a on t h e performance o f s o l a r h e a t i n g systems by monitoring so lax i n s t a l l a t i o n s . F o l l o w i n g c o l l e c t ion, a n a l y s i s and evaluation, t h e d a t a a r e used to determine the thermal and mechanical performance of a s o f a r heating system and i t s subsystems and to formulate
d e s i g n guidelines. The extent o f monitoring f o r any one installation depends primarily an the subsequent use t o b e made o f t h e data.
In general, information obtained from m o n i t o r i n g can b e used t o address one or Inore o f the f o l l o w i n g o b j e c t i v e s :
-
to describe t h e over-all thermal performance of a s o l a r system intcms of its c o n t r i b u t i o n to t h e energy needs of a s p e c i f i c
b u i l d i n g ,
- t o v a l i d a t e solar heating system computer simulation programs,
t o permit d e t a i l e d a n a l y s i s of t h e pesformance of a s o l a r h e a t i n g
system,
which
inturn
will i d e n t i f y shortcomings in system d e s i g n ( e . g . , oversized storage, i n c o r r e c t c o n t r o l operation), componentweaknesses, and shartcomings in component disposition and
i n s t a l l a t i o n in the b u i l d i n g (subsequent analysis can a l s o be c a r r i e d out to indicate t h e performance improvement t o b e expected
f r o m modifications of rhe s o l a r system! t h i s should l e a d to d e s i g n g u i d e l i n e s for s o l a r heating systems as w e l l as recommendations f o r component manufacturing, installation and maintenance).
-
to validate combined s o l a r and b u i l d i n g heat l o s s computer simulation programs.2 . MONITORING PROGRAM
2.1. Performance Factors
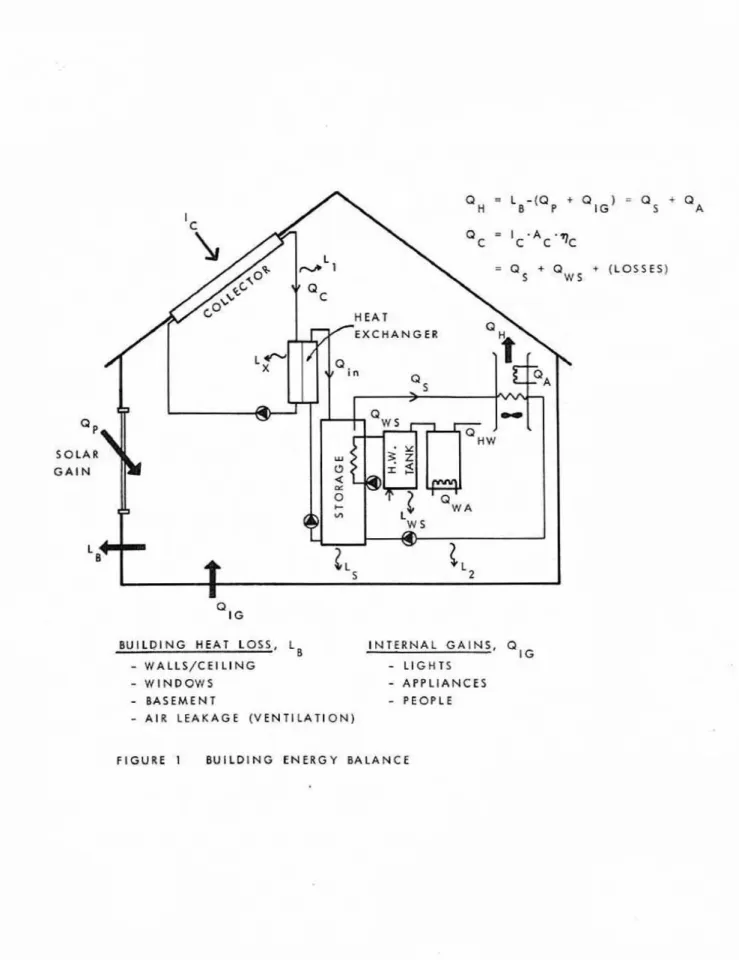
Some o f the f a c t o r s used to describe the thermal performance o f a
solar h e a t i n g system and its subsystems are defined below. Reference
should b e made to Figure 1, which shows a t y p i c a l liquid solar heating
system.
*
2 . 1 . 1 - F r a c t i o n s o l a r , FS, represents t h e solar energy c o n t r i b u t i o n to
t h e net heating requirement (space and service water h e a t i n g ) a f t h e
b u i l d i n g
It can be subdfvided into t h e fraction s o l a r
f o r
space h e a t i n g[QS/Q1) and the f r a c t i o n s o l a r f o r service water h e a t i n g (QWS/Q14W]. The net space h e a t i n g demand of the b u i l d i n g can be o b t a i n e d in 3 number of
ways :
-
by measurrrnent o f QS
ands,
(s
=QS
+ QA),
-
by comparison w i t ha
s i m i l a r non-solar b u i l d i n g f o r which purchased energy is measured, i .e.
,
f o r whichQH
= QA,-
by a n a l y s i s , using a building heat loss model to account forL ~ ' QP and
QIG,
(QH = LB-
(s
+PIG))
- b y d e t a i l e d measurement where most losses and g a i n s c o n t r i b u t i n g
t o
LB,
C$ and QICare
measured and t h e remainder c a l c u l a t e d .2.1.2. Heating system utilization e f f i c i e n c y ,
~ K S ,
is t h e r a t i o of t h es o l a r energy utilized to t h e amount c o l l e c t e d , and a measure a l s o of t h e h e a t l o s s e s of the
sysrem
2 . 1 . 3 . Collector array e f f i c i e n c y , q ~ , is the r a t i o of t h e energy collected b y t h e array to t h a t i n c i d e n t on it. This accounts f o r a r r a y losses as well as variation of i n s o l a t i o n d u r i n g the measurement period. It s h o u l d t h e r e f o r e
be
distinguished froan t h e instantaneous c o l l e c t o r e f f i c i e n c y reported by mnufacturers and t e s t agencies2.1.4. Over-all s o l a r system conversion e f f i c i e n c y , q,, is t h e r a t i o
of the s o l a r energy utilized to the solar energy i n c i d e n t on the c o l l e c t o r a r r a y
This r e p r e s e n t s t h e e f f i c i e n c y with which t h e solar system converts solar r a d i a t i o n to u s a b l e energy. It can a l s o b e expressed as
The f i r s t parameter, FS/Ac, characterizes t h e s o l a r system design; t h e second,
(%
4%)
/Ic, characterizes the h u i l d i n g h e a t i n g load, h o t waterusage, and weather.
2.1.5. Storage subsystem e f f i c i e n c y , 0
S
Storage efficiency is an i n d i c a t i o n o f the energy l o s s characteristic of t h e s t o r a g e u n i t .
Other performance factors may be of importance in some applications, including heat exchanger effectiveness and heat pump coefficient of
performance,
if
applicab le.
2.2 Levels o f Monitoring
A number of solar heated b u i l d i n g s were equipped with m n i t o r i n g
systems, the level of monitoring d i c t a t e d b y t h e type of building and
t y p e of solar heating system a s w e l l as by t h e use to b e made of the data. It must b e recognized t h a r r e f i n e d d a t a can only b e obtained by means of
an increase in t h e c o s t of instrumentation, maintenance, and subsequent data monitoring
and
processing. Monitoringlevels
a r e summarized as follows :2.2.1. Level 1
The consumption o f conventional o r purchased e n e r g y only ( i . e . , e l e c t r i c i t y , gas
o r
o i l ) is measured. The n e t heating requirement isinferred by a n a l y s i s o r comparison w i t h a s i m i l a r non-solar-heated
b u i l d i n g . T h i s l e v e l w i l l provide a rough estimate of f r a c t i o n s o l a r and
is s u i t a b l e f o r privately-funded solar-heated installations f o r w h i c h
c o s t l y m o n i t o r i n g instrumentation cannot b e j u s t i f i e d . It i s a l s o the
a p p r o p r i a t e l e v e l of monitoring f o r funded projects t h a t are duplicates
of o t h e r s monitored in more detail arid at a higher l e v e l ( e . g .
,
a row-housing group c o n t a i n i n g a number of i n d i v i d u a l solar s y s t e m s ) .
2.2.2. Level 2
T h i s level of monitoring addresses t h e f i r s t o b j e c t i v e of m o n i t o r i n g ,
a s w e l l a s t h e second and third o b j e c t i v e s ( s e e S e c t i o n
1.1,
to a degree t h a t dependson
t h e monitoring instrumentation and d a t a acquisition equipment used. It can b e d i v i d e d i n t o two c a t e g o r i e s according to t h ed a t a o u t p u t device and frequency o f measurement and r e c o r d i n g of data; t h e f i r s t u s e s i n t e g r a t i n g h e a t meters, t h e second, an automatic d a t a a c q u i s i t i o n s y s tern.
[a) An integrating heat meter is a d e v i c e t h a t receives a n a l o g u e
signals from Two temperature s e n s o r s (temperature difference) and a f l o w
sensor, and is calibrated to measure t h e i n t e g r a t e d h e a t flow p a s t a
point i n the system. [More details o f the meter and a s s o c i a t e d
instruments are presented in S e c t i o n 3 . 1 1 , I n t e g r a t i n g h e a t meters are
used at d i f f e r e n t p o i n t s in the s o l a r system to measure the amounts of
s o l a r energy c o l l e c r e d [QC], solar energy delivered t o space (Q)
,
and s o l a r e n e r g y used for hot w a t e r p r e h e a t i n g((lws)
as well as any o t h e r h c n tflow q u a n t i t i e s r e q u i r e d for the a n a l y s i s o f a p a r t i c u l a r subsystem. I n a d d i t i o n , i n t e g r a t i n g meters are used to measure purchased energy
[QA and & A ) , and an i n t e g r a t i n g pyranometer i s used to measure solar energy i n c i d e n t on the c o l l e c t o r s [ I )
.
C
I n t e g r a t e d energy values a r e generally recorded on a weekly or
month1 y b a s i s ; more f r e q u e n t reading is impractical. I n t e g r a t e d data arc s u i t a b l e for gross analysis o f sys tern and component performance (weekly
and monthly values of FS, r~~~~~
,
.
. .
and f o r validating seasonalsolar system simulation programs such as FCHART and S o l c a s t .
(b] E x p e r t m e n t a l s o l a r systems and systems w i t h novel. f e a t u r e s of components ~ e q u i r e d e t a i l e d data for dynamic system and component
performance analysis. D e t a i l e d performance d a t a are a l s o r e q u i r e d for
v a l idarion of s o l a r sys tern simulation programs such as WAI'SUN a n d TRNSYS
.
F o r s u c h d e t a i l e d data gather in^ ( t h a t is, data col l e c t c d on an h o u r l y o r quarter-hourly basis) an automatic data acquisition and l o g g i n g system is r e q u i r e d . A similar data sys tern can be used i n (a] above i f t h enumber o f integrating meters becomes p r o h i b i t i v e and data h a n d l i n g
T h i s monitoring system a l s o utilizes temperature and flow sensors, b u t a l l readings are recarded by a d a t a logger or a minicompt~ter, both of which are capable o f r e c o r d i n g a large number o f r e a d i n g s in v e r y s h o r t
time intervals. A data logger performs a m i n i m u m of p r o c e s s i n g on t h e
data p r i o r to storing in a way s u t t a b l e for f u t u r e computer processing
(e.g., on magnetic tape). A minicomputer, on the o t h e r hand, has t h e
additional c a p a b i l i t y of on-site processing and reducing data to f i n a l form ( i . e . , energy quantities and p e r f o m n c e f a c t o r s ) ,
2.2.3 Level 3
T h i s l e v e l c o n s t i t u t e s measurement of t h e elements o f t h e b u i l d i n g
energy requirement as well as those
of
t h e solar system. The measured q u a n t i t i e s are the same as those in Level 2 [Ic, Qc, Q ,a,
Qvs.. .) plust h e building-related energy values (LB, Qp, and QIG). An automatic data a c q u i s i t i o n and l o g g i n g system
is
used. T h i s level of monitoring is required for v a l i d a t i o n of combined solar-system and b u i l d i n g heat l o s s simulation programs. There are c u r r e n t l y no s o l a r - h e a t e d b u i l d i n g s w i t h this l e v e l o f monitoring.It should b e noted t h a t because of t h e close-coupling o f t h e solar system and the b u i l d i n g in a passive solar heating application t h e
monitoring af such i n s t a l l a t i o n s is extremely difficult, Full monitoring can o n l y b e achieved w i t h Level 3 . The a l t e r n a t i v e is to r e l y on Level 1 monitoring. A summary of solar-heated b u i l d i n g s now being monitored
b y DBR or undergoing i n s t a l l a t i o n of a monitoring system is given i n
Tab Ee I . The level of monitoring of each of the projects is a l s o given.
3 .
MONITORING
OF NRCSINGLE-FAMILY
SOLAR DEMONSTRATION HOUSES3 . 1 . Equipment
Monitoring systems corresponding to Level 2(a) w e r e installed in the
summer and f a l l o f 1 9 7 7 in twelve of t h e f o u r t e e n NRC s o l a r d e m o n s t r a t i o n
houses across Canada (1). They incorporate a v a r i e t y of liquid and a i r
solar systems, some w i t h heat-pump assistance. A t y p i c a l m o n i t o r i n g arrangement i s shown in Figure 2. F o r subsystems i n which energy is t r a n s f e r r e d b y a heat t r a n s f e r medium (air or liquid), a n i n t e g r a t i n g
heat meter was used to measure the i n t e g r a t e d v a l u e s of h e a t flow and
f l u i d flow to or from the subsystem. It accepts analague signals f r o m two t e m p e r a t u r e sensors and a flow sensor, and displays i n t e g r a t e d energy
value in MTh and i n t e g r a t e d f l u i d f l o w in m3. A f a c t o r proportional t o
the product of d e n s i t y and specific heat o f water is b u i l t i n t o the electronics of the meter. It is, t h e r e f o r e , necessary to c a l i b r a t e t h e meter if it is to b e used w i t h f l u i d s o t h e r than water.
P r e c i s i o n platinum rssis tance thermometers [RlQ 3s) were used for temperature measurement. They have a nominal resistance o f 100 fi a t O O C
and a thermal c o e f f i c i e n t of resistance of 0.00385
R/Q/"c.
TheRTD
swere
interchangeable w i t h i n 0, O S D C over t h e range 20 to 9 0 ' ~ .A s b o t h l i q u i d a n d air systems were monitored, two types o f flow meter were selected. L i q u i d flows were measured w i t h a p o s i t i v e -
displacement n u t a t i n g disc flow meter equipped with an impulse head to y i e l d one pulse (switch closure) f o r every 10 L of l i q u i d passing through
t h e meter. T h i s p u l s e output was fed i n t o the i n t e g r a t i n g h e a t meter.
The i n t e g r a t e d flow could also b e read o f f a d i g i t a l counter. Air flows were measured w i t h a propeller-type vane anemometer. The o u t p u t o f t h e vane anemometer w a s in t h e form o f an a-c signal of v a r i a b l e frequency
t h a t depended on t h e r o t a t i o n a l speed o f the v a n e and hence on t h e a i r
v e l o c i t y o r air flow r a t e , An e l e c t r o n i c i n t e r f a c e was p r o v i d e d b e t w e e n
the anemometer and t h e i n t e g r a t i n g heat m e t e r to p r o v i d e t h e meter w i d 1 the p m p e r p u l s e i n p u t .
For subsystems having energy i n p u t s in the farm of a c o n v e n t i o n a l
energy source
(i.e
.
,
a i l , gas or e l e c t r i c i t y ) alternate measuring schemes were u t i l i z e d . The auxiliary energy c o n t r i b u t i o n of an o i l or gasfurnace was estimated from t h e measured fuel consumption and an assumed
furnace e f f i c i e n c y . Gas consumption was measured w i t h a d i s p l a c e m e n t gas
meter, Oil consumption was calculated using the furnace n o z z l e size and
the measured elapsed on-time o f t h e furnace. The l a t t e r was measured w i t h a totalizing clock. The electric e n e r g y consumption was measured w i t h klVh meters with the output d i s p l a y e d on five d i a l s , b u t t h e s e were
l a t e r changed t o a digital o u t p u t because many of the monitoring agents
experienced difficulty
i n
reading the d i a l comb inatians.
For measurement of energy f l o w s in circuits where t h e temperature l e v e l s remained relative1 y c o n s t a n t bemeen measurements [one week), o n l y
t h e f l u i d flow w a s i n t e g r a t e d and the temperature d i f f e r e n c e measured a l o n g w i t h the o t h e r parameters on a weekly basis. Energy flow was
calculated using the average temperature d i f f e r e n c e and the i n t e g r a t e d
f l u i d flow. T h e e n e r g y demnd f o r domestic h o t water h e a t i n g systems was
determined in t h i s way because s h e warer mains temperature and t h e hot
water supply temperature [ s e t to a fixed value) could b e assumed c o n s t a n t
in t h e i n t e r v a l between readings. A commercial e l e c t r o n i c thermometer
was used, c o n s i s t i n g of three t h e r m i s t o r s connected to a r e a d o u t t h r o u g h
a three-channel selector.
S o l a r r a d i a t i o n i n c i d e n t on the collector array w a s normally estimated using values obtained from the nearest r a d i a t i o n measuring
s t a t i o n . I f these was
no
s t a t i o n nearby, a pyranometer was mounted att h e site at t h e same slope as the c o l l e c t o r s and w a s connected 60 an
i n t e g r a t o r to g i v e a continuous d i g i t a l readout o f t h e i n t e g r a t e d solar r a d i a t i o n .
3 - 2 . C a l i b r a t i o n and I n s t a l l a t i o n
C a l i b r a t i o n and i n s t a l l a t i o n of t h e monitoring equipment were carried out b y NRC s t a f f ; o n - s i t e plumbing and e l e c t r i c a l m o d i f i c a t i o n s of the
solar s y s t e m to prcpare it t o accept t h e equipment were performed b y t h e
local plumbers and e l e c t r i c i a n s o r i g i n a l l y involved in its instal la t i o n . A l l equipment was c a l i b r a t e d individually in t h e laboratory p r i o r ta
i n s t a l l a t i o n t o check accuracy o r determine c a l i b r a t i o n factors. An exception was vane anemometers, which were calibrated a f t e r i n s t a l 1 at i o n
because of t h e dependence
of
a i r flow on actual operating temperature and p r e s s m e . In-situ c a l i b r a t i o n o f t h e vane anemometer was accomplished b ycorrelating
i t s
output ( p l ses/min)
w i t h a d i r e c t flow rate measurementusing a p i t o t tube traverse. A summary of the inst-ruments used, t h e i r
r a n g e , and accuracy i s given in Table 11.
3.3. Comments
'Ika factors common to all t h e demonstration monitoring resulted in
d i s t o r t i o n o r d i s r u p t i o n of the m o n i t o r i n g process. The first was r e l a t e d t o m o n i t o r i n g equipment f a i l u r e and t h e o t h e r t o human e r r o r . Most
equipment failure was associated w i t h the vane anemometers a n d t h e
integrating h e a t meters. The vane anemometers suffered from bearing
failures a f t e r a relatively s h o r t operating period (the brass b u s h i n g s
fai Zed a f t e r one o r t w o months o f operation), and this l e d to e r r o n e o u s
air flow {and hence heat flow) readings.
Malfunction o f the i n t e g r a t i n g h e a t meters ranged f r o m a drift f r o m c a l i b r a t i o n c o n d i t i o n t o complete failure. Failure rate o f the vane
anemometers was as high as 5 0 per cent; for t h e heat meters it w a s 20 per cent. O t h e r factors t h a t disrupted t h e m o n i t o r i n g process were r e l a t e d to the s o l a r system i t s e l f (1). Another source o f error was t h e i n a b i l i t y of some monitoring agents to read meters c o r r e c t l y (such as the d i a l readouts of kwh and gas meters]. This i n d i c a t e d t h e need far well prepared data s h e e t s to minimize m y p o s s i b i l i t y of e r r o r in r e c o r d i n g
d i a l readings and l o c a t i n g decimal p o i n t s .
As a r e s u l t of these problems t h e r e is not a complcte set of
monitored data f o r the 1977/78 h e a t i n g season f o r t h e demonstration houses In many instances even the c o l l e c t e d data were so d i s t o r t e d t h a t meaning- f u l conclusions c o u l d n o t b e drawn r e g a r d i n g the performance o f t h e solar
systems. A summary of the thermal performance of a number of t h e
monitored s o l a r systems has been presented in Reference ( I ) . Work is now
under way to r e c t i f y t h e sources o f e r r o r . A new b e a r i n g for the vane anemometers i s b e i n g d e s i g n e d and new i n t e g r a t i n g h e a t meters are b e i n g
tested and calibrated to replace f a u l t y ones. It i s expected t h a t a complete e v a l u a t i o n of the s o l a r systems "eerfomance will be possible
f o l l o w i n g the 1978/79 season.
4 . MONITORING OF
AYLMER SENIOR
CITIZENS APARTMENT BUILDING SOLAR SYSTEM A senior c i t i z e n s residence located in Aylmer, O n t a r i o , i n c o r p o r a t e sa solar h e a t i n g s y s t e m w i t h a seasonal s t o r a g e u n i t and 219 m2 of l i q u i d - h e a t i n g c o l l e c t o r s . A m o n i t o r i n g system of Level 2Cb) category, w i t h a
minicomputer-based d a t a a c q u i s i t i o n sys tern,
is
being i n s t a l l e d b y NRC,It is based on a D i g i t a l Equipment Corporation E I - 1 1 minicomputer w i d 1
2 8 K memory equipped
with
a dual floppy d i s k unit (250 K) and a Texas I n s trurnen ts model 700 keyboard p r i n t e r . Analogue channels a r einput
through a FIonitor Labs reed scanner and a Fluke 8500 multimeter w i t h binary o u t p u t . Period, rate and l o g i c channels are connected to theLSI-I2 t h m u g h an ADAC o p t i c a l i s o l a t o r i n t e r f a c e ,
F o r each of the 200 channels the system calculates a running
i n t e g r a l based an 30-sec scans. A t each scan t h e measured value is compared w i t h its previous value; if these differ by more than a p r e s e t amount and
if
a p r e s e t "'minimum timet' has elapsed, a new b l o c k of d a t aconsisting of all t h e channels i d e n t i f i e d a s "quickly varyingn i s w r i t t e n
on the f l o p p y d i s k . Data f r o m "slowly varying" channels are written on
the disk a t p r e - s p e c i f i e d t i m e i n t e r v a l s . On-line f ortran routines wi 11 perform running integrations of key performance measurements and d r i v e a
d i s p l a y panel to b e located in the lobby of the b u i l d i n g .
Liquid f l o w and e l e c t r i c a l energy sensors are essentially the same as those described earlier. The kWh meters are equipped w i t h a photo-
e l e c t r i c pulse generator to interface w i t h the minicomputer. Yellow
S p r i n g s Instrument Company precision thermistors matched to w i t h i n
k0.1 C Beg
are
used far temperature measurement, and a #eathertronics t h i n - f i l m capacitive sensor is used to measure r e l a t i v e humidity. S o l a r r a d i a t i o nis
measured w i t h an Eppley 848 pyranometer. A Weathertronicsthree-cup anemometer w i t h a d-c g e n e r a t o r and a vane w i t h a potentiometer
w i l l be used to measure wind speed and d i r e c t i o n , r e s p e c t i v e l y . Air f l o w in the mechanical v e n t i l a t i o n system will b e determined w i t h Validyne p r e s s u r e t r a n s d u c e r s measuring t h e pressure drop across a heat wheel a n d the pressure differentials from averaging p i t o t t u b e s . For comparison, a i r flow will a l s o b e measured with a vane anemometer w i t h a p u l s e d o u t p u t .
Some features are included i n t h i s monitoring system that were not
included in previous systems of the same l e v e l : an automatic power-failure r e s t a r t system, and a d a t a reduction program to a n a l y s e recorded data a s they become a v a i l a b l e . The m o n i t o r i n g system is expected t o b e
operational early in 1979.
5, CONCLUSIONS
- Monitoring systems have been i n s t a l l e d b y NRC in several solar h e a t e d b u i l d i n g s representing a variety o f s o l a r system d e s i g n s
and applications.
- The l e v e l o f the monitoring system installed i n each b u i l d i n g
depended on the t y p e o f b u i l d i n g , the solar system, and the end use of t h e monitoring data produced. Monitoring ranged from
measurement o f conventional fuel consumption o n l y to use o f minicomputer data acquisition systems.
- Valuable experience was gained in designing, calibrating and
instaZling monitoring equipment in various buildings. Ebre effort i s needed in t h e development o r improvement of some of the
measuring equipment, f o r example, t h e vane anemometer and t h e
i n t e g r a t i n g heat metes.
- Cooperation of the m o n i t o r i n g agent and h i s f u l l u n d e r s t a n d i n g a f
t h e solar system and t h e monitoring system operation are v i t a l
factors in c o l l e c t i n g r e l i a b l e d a t a .
REFERENCES
1 . CarscabZen, W.E. and B.E. Sibhitt. S u m a r y o f t h e 197611977 S o l a r
Demonstration Houses. P r e s e n t e d at 1978 SESCI Conference
rRenewable Alternatives,
'
London, Ontario, August 1 9 7 8 .*C = Net collector array aperthre area
=
c
= Incident solar energyLJ3 = B u i l d i n g h e a t l o s s
Q~
= S o l a r heat gain
QC
= Collected s o l a r energyin = Solar e n e r g y i n p u t t o storage
QS
= Solar energy d e l i v e r e d to spaceQw
s
= S o l a r e n e r g y to domestic hot Hater h e a t i n gQA = Auxiliary energy to space
%A = Auxiliary e n e r g y to domestic h o t water h e a t i n g QH = Space h e a t i n g requirement
QHW = D o m e s t i c hot water ( O H W ) heating requirement
L
= Heat l o s sQI G = B u i l d i n g i n t e r n a l heat gain
0
0
%
.d>
kB U I L D I N G H E A T L O S S ,
B INTERNAL G A I N S , Q I G
- wALLS/CEI L I N G - LIGHTS
-
W I N D O W S - A P P L l A N C E S- B A S E M E N T
-
PEOPLE-
AIR LEAKAGE (VENTLLATIONS@
T E M P E R A T U R E S E N S O R@ F L O W M E T E R