READ THESE TERMS AND CONDITIONS CAREFULLY BEFORE USING THIS WEBSITE. https://nrc-publications.canada.ca/eng/copyright
Vous avez des questions? Nous pouvons vous aider. Pour communiquer directement avec un auteur, consultez la première page de la revue dans laquelle son article a été publié afin de trouver ses coordonnées. Si vous n’arrivez pas à les repérer, communiquez avec nous à [email protected].
Questions? Contact the NRC Publications Archive team at
[email protected]. If you wish to email the authors directly, please see the first page of the publication for their contact information.
NRC Publications Archive
Archives des publications du CNRC
This publication could be one of several versions: author’s original, accepted manuscript or the publisher’s version. / La version de cette publication peut être l’une des suivantes : la version prépublication de l’auteur, la version acceptée du manuscrit ou la version de l’éditeur.
Access and use of this website and the material on it are subject to the Terms and Conditions set forth at
Strain energy : a performance attribute of modified bituminous roofing membranes
Dutt, O.
https://publications-cnrc.canada.ca/fra/droits
L’accès à ce site Web et l’utilisation de son contenu sont assujettis aux conditions présentées dans le site LISEZ CES CONDITIONS ATTENTIVEMENT AVANT D’UTILISER CE SITE WEB.
NRC Publications Record / Notice d'Archives des publications de CNRC: https://nrc-publications.canada.ca/eng/view/object/?id=7c937b11-db8f-4400-835f-4a4db4c5fd68 https://publications-cnrc.canada.ca/fra/voir/objet/?id=7c937b11-db8f-4400-835f-4a4db4c5fd68
N 2 1 d
National Research Conseil national
c. de recherches Canada
BLDG
- - - Institute for lnstitut de
Research in recherche en
Construction construction
Strain Energy
-
A Performance Attribute of
Modified Bituminous Roofing Membranes
by 0. Dutt
Presented at
The 3rd International Symposium on Roofs and Roofing Society of Chemical Industry (SCI)
Bournemouth, U.K., April 25-28, 1988
"Roofs and Roofing: New Materials, l ndustrial Applications,
Uses and Performancen. The Conference
-
'late' papersp. 81-92
(IRC Paper No. 1630)
Reprinted with permission
NRCC 31063
\
E ~ B L ~ O T H ~ C U ~ I R C APT\
c'v- + -
..
>*5,
I
!L'autcuc a 6 W le concept d't?Ilergie de deformation B la mptm due B la charge de traction en vue de I'utiliser COLUHE attribut de performauce des membranes de couverture en bitume
modif%. II a u W B cettc fin dcs &hantWns de membranes &s et modifiCes, qua= B
l'aidc d'APP @olypropyl$ne atactique) et huit au moya de SBS (copolymke s w n e -
butaei&ne-styrtne), et ua. khantillon de memimine au SBS non am&. Les 4chantillons ont
&t6 sournis & des essais en traction jusqu'g rupture. On s'tst servi des valeurs de cotatdie
de la charge, de l'allungement et de %a surfztce selon la courbe charge-allongement pour
cdculer la dsistance (T), la &furmation GS), le produit dsistance-&formation (Q) et 1'6neagie de d6fonnation 0, Lc rapport (R) & 1'Cnergie & &formation au produit r C s i s t a n o n a Ct6 &fini. On a utilid les Iimiets & la plage des valeurs R pour
C l a h une dthode graphique qui simplifie l'application du c r i & t de l'tnergie &
deformation, a m fins de 1'6valuation des me:mbranes, en dispmsant de mesum 1'Cnergie.
Dans cttte mdthode, chaque point indique sw le graphique n5sistance-deformation
rtgdsente m i s dimensions
-
T, S et Q -, b produit Q &ant une mesure de l'dnergie.L'auttur m o n a qu'une seuIe exigtnce d'6nergie de aformation p u t remplacer les exigences & charge et d Wlonrctrncnt et a m ce c d h e cst azmli~ble aux mat6riaux il
module &s faible ou t&s &r su SBS, a m k s
Strain energy
-
a performance
at
tribute of modified bituminous
roofing membranes
0. Dutt - Researcher, National Research Council of Canada, Ottawa.
ABSTRACT
The
concept of strain energy of rupture due to tensile load w a s studied for application as a performance attribute of modified bituminous roofin membranes using variousR
samples. These included eig t A P P (A tactic Polypropylene) and four SB S (Styrene-
B
utadiene-S t rene co olyrner)2
5'
modified and reinforced samples, an one SB modified and non-reinforced. They were tensile tested to ru ture. The test
P
values of load, elongation, and area under the oad-
elongation curve were used to corn u te strength (T , strain
B
Ti
(S), strength-strain product (Q), an strain energy ( ). A relat~onship between strain energy and strength-strain
product w a s established in terms of their ratio (R). The limits of the range of R values were used to develop a graphical method that sim lified t h e application of strain energy
P
criterion for e v a uatin membranes without measuring energy. In this rnethocf, each oint plotted on the strength- strain graph re resents three imensions
-
T,
S
andQ
-
B
B
where the pro uct Q is a measure of energy. It is shown t h a t
a single requirement of strain energy can replace individual requirements of load and elongation, and that it
accommodates very l o w to v e t h i g h modulus materials reinforced membranes.
B
Roofs and Roofmg
~ C O R I E C l l D
---.(l
A S PER CHAR7E L O N G A T I O N . rn
Fig. 1 . Strain energy areas and load-elongation product, rectangles.
E L O N G A T I O N . m 100 I 0 4 2 zoo 0 0 0. 1 0. Z 0 . 3 0 . 4 0.5 ELONGATION. m [Ch.
Fig. 2. Different load-elongation curves of MB membranes, reinforced (a to d) and non-reinforced (e).
Strain Energy
LNTRODUCTION
All roofing membranes are subjected to various stresses during manufacture, storage, transportation, ap lication and service. Tensile stress and strain are considerel most
important of all [I]. They are measured in terms of load and corresponding elongation. According to most standards and specif~cations, the membranes must be tested for the tensile properties [2,3].
Modified bituminous (MB) membranes constitute one of the major generic types of new roofing materials. There are numerous MB products and they vary widely in their strength and strain properties due to the combination of different modifiers and reinforcing fibers. Atactic
polypropylene (APP), a thermoplastic material, provides the
modified product with high tensile strength. Styrene-
bu tadiene-styrene copolymer S BS) imparts excellent
elongation property. The rein
!
orcements that are woven or nonwoven mats or scrims of (hi h modulus) glass or (low modulus) olyester fibers, may e combined In one or morel !
t
%
layers wit in a membrane to impart their characteristics. A membrane may consist of two sheets
-
a base sheet of high modulus and a cap sheet of low modulus materials.Conse uently, there has been an influx of new products
claimel to possess a multitude of characteristics. This has generated considerable interest within the industry and amongst researchers for developing performance criteria [4].
The conce t of strain energ , frequently used in engineering problems,
i
f
as been proposeJ' as a replacement of bothstren th and strain for application to roofing membranes. It
B
is re ated to the load and elongation behavior, and is equal to the external work done in deforming the material by a
gradually a lied load. Strain energy is computed fmm the
PR
area under t e load-elongation curve. For linear1 elastic
T
materials the load-elongation curve is a straight ine (Figure
1.a). The curves for roofin membranes are non-linear as
d
these composite materials eforrn viscoelastically. This
behavior results in a variet of shapes of t h e load-elongation
h
curves (Figures 1.b and 2). us it IS difficult to develop a
simple mathematical formula for strain energy to account for all types of materials.
A concept similar to that of strain energy employing the term load-strain product was first introduced in the
Canadian standard for modified bituminous membranes [2].
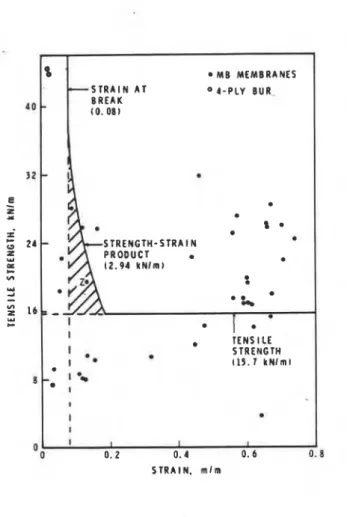
The objective was to disqualify the materials that barely meet the load and the elongatxon requirements. The three requirements related to the tensile property are graphically shown in Figure 3, with values converted to strength and strain units. In the shaded area
-
the disqualifying region-
84 Roofs and Roofmg [Ch.
e
-
Kg. 3. ~ k u m tensile Z *
requirements as per reference I'
[2]. Dots represent test 5 2 4
1: Y
values of various MB s membranes mostly from
Table 1.
1% 1
l M B M E M B R A N E S S T R A I N A T O 4 - P L Y BUR BREAK ( 0 . 0 8 ) S T R E N G T H - S T R A I N P R O D U C T 12.94 1tNlm) * a l .5 a TENS1 LE STRENGTH ( 1 5 . 7 k N i m l S T R A I N . m l r na material Z is shown as marginall passing the two
limit.
Z
requirements but failing to meet t e load- strain product
The use of strain energy criterion is more realistic in
assessing the tensile pro rt than the strength and strain
applied se arately. For &roping a methodology for
E
applying t e energy criterion that would characterize the
membrane performance when subjected to tensile loads a
number of APP and SBS modified bituminous membranes
were tested for peak load, elongation and the amount of strain energy expended to rupture the specimens.
EXPERIMENTAL
1. Specimens: Four samples of APP and eight of SBS modified bituminous reinforced membranes and one sample of SBS modified non-reinforced membrane were used in this work. Some of the samples were ca sheets of the two ply systems.
Five specimens, each in mac
%
ine and cross directions, werecut from each sam le. Each specimen was 25 mm wide in the
Strain Energy
2. Testing: The s ecimens were tested with a tensile tester (Instron, m ode1
8
0.1 122) having an automatic chart recorder system and an integrator for recording area under the curve. All tests were conducted with an initial grip spacing of 75 m m (60 Imm for non- reinforced specimens) and a rate of grip separration of 50 mm per minute. The testing of aspecimen was considered complete when either a total break occurred or a hole -'windowing1- or any other discontinuity appeared in t h e specimen which indicated that the
membrane was no ion er serviceable. If a specimen broke at the grip, the test was Ascarded and a replacement specimen
tested. Various quantities related to the machine constants were noted on t h e chart and were used for computing other values.
3. Com utation of Tensile Properties: The various quantities (Table
!
) were com uted from the machine chart values and machine constants. I! owever, the values forB U R
(27 and 28, Table I ) were computed from the data and informationiven by Rossiter and Beatz 151. Each value is the mean of at
feast five specimens tested. The definition of various terms used in the present context and their explanation are given below.
(a) Tensile strength IT' (kN/m): It is the maximum of the peak load per metre width of specimen, obtained from the chart value for the 25 mm wide specimen multiplied by 40. (b) Tensile strain 'S' (m/m): The elongation of a 75 mm long specimen (60 mm for non-reinforced specimen) was
measured from the curve to the point of rupture or to a point where the strength ordinate was reduced to 10% of the peak value, as shown in Figure 1 .b. This was converted to strain, m/m.
(c) Strength-strain roduct 'Q' (kN/m): This is the product of tensile strength an
#
strain in kN/m. This quantity represents the area in normalized units of a rectangle that circumscribes the load-elongation diagram with broken lines andcoordinate axes, as shown in Figure 1.
(d) Strain energy 'U' (kN/m): Technically, strain energ is the
K
area under the load-elongation curve and represents t e quantity of work done in kN.m. In the present case, the area was measured with a lanimeter, or computed from the integrator reading, an
$
reduced to the energy units, kN.m. This was further divided by the length and width ofspecimen to obtain the value of energy per unit area, kN/m. It may be noted that the strain ener y per unit volume is known as strain energy density or
d
odulus of Tou hness. In the present context, it is the ener per unit area, p u t isY
- - - - - . - . - - - -
[Ch. Roofs and Roofing
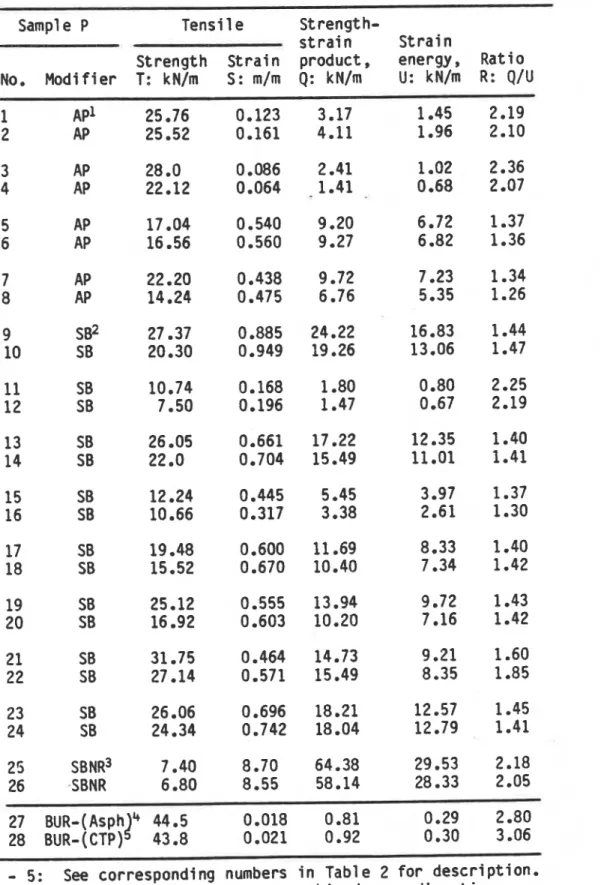
Table 1. Tensile properties of modified bituminous membranes.
Sample P Tensi 1 e Strength-
s t r a i n S t r a i n
Strength S t r a i n product, energy, R a t i o No. M o d i f i e r T: kN/m S:m/m Q: kN/m U: kN/m R: Q/U
1
-
5: See corresponding numbers i n Tab1 e 2 f o r description. Note 1 : Pai red val ues represent rnachi nelcross d i r e c t i ons. Note 2: BUR (27, 28) values computed from data i n Ref. ( 5 1 .Strain Energy
(e) Ratio
'R"
The ratio of strength-strain product to the strain ener y represents a kind of shape factor related to their grapb
leal shapes. In essence, it is the ratio of the area ofcicum scribing rectangle to the shaded area of load-elongation diagram (Figure I ) , w hich must always be reater than one
.
obviously equal to 2.
1
For a linearly elastic material (Figure 1 .a), t e shape factor is The relationship of the product
Q
and energU
is such thatB
both have the same value for strength T an for strain S , and each can be considered as a third dimension of the tensile
p r o p e r t y . T h e v a l u e s o f T , S a n d Q o r U f o r a f e w s a m lesare
shown In the perspective of a three dimensional grap
g
(Figure46
.
The total height of a vertical bar represents Q value an the solid portion of the bar, U value.RESULTS AND DISCUSSION
The tensile test results from the various samples given in Table 1 are summarized in Table 2. The values for
B U R
have been included for comparison only. It is seen that each type of M B membrane, where there were at least three materials,has a wide range of strength, strain and strain energy values, with the strength having the smallest relative variation. The variation of strain energy in the case of both A P P and
SBS
is the highest of all, which makes it more sensitive than other properties in defining tensile behavior. Thus, statistically, itmay be argued that the energy criterion is more appropriate than the strength and the strain, individually.
It is obvious that the measurement of the area of load- elon ation diagram for computing strain energ
%
r
iscum ersome, unless a computer system is bui t into the test apparatus. In order to generalize and simplify t h e
application of strain energy rinci le, the concept of strength-strain product is a !t opte c? and a relationship
between the two quantities established that bypasses the need for computing t h e areas for energy areas.
The
method is gra hical and is explained with some numerical valuesF
from able 1.
Consider, as an example, that the minimum requirement of strain ener y U is set at 2 kN/rn. Since the ratio
R
for theP
majority o materials Iies between 1.3 and 2.3 (Table I), the corresponding values of the smen th-strain product Q (i.e., U
x R ) must lie between 2.6 and 4.
d
kN/m. In other words, theenergy requirement has been translated into a range of Q values, between 2.6 and 4.6, which vary according to the sha e of the tensile test curves. Using the limits of the range of
6
values. hy erbolic curves representin the loci ofQ
(for Q = 2.6 and 4.l'
) are drawn on a graph w i t%
strength and[Ch.
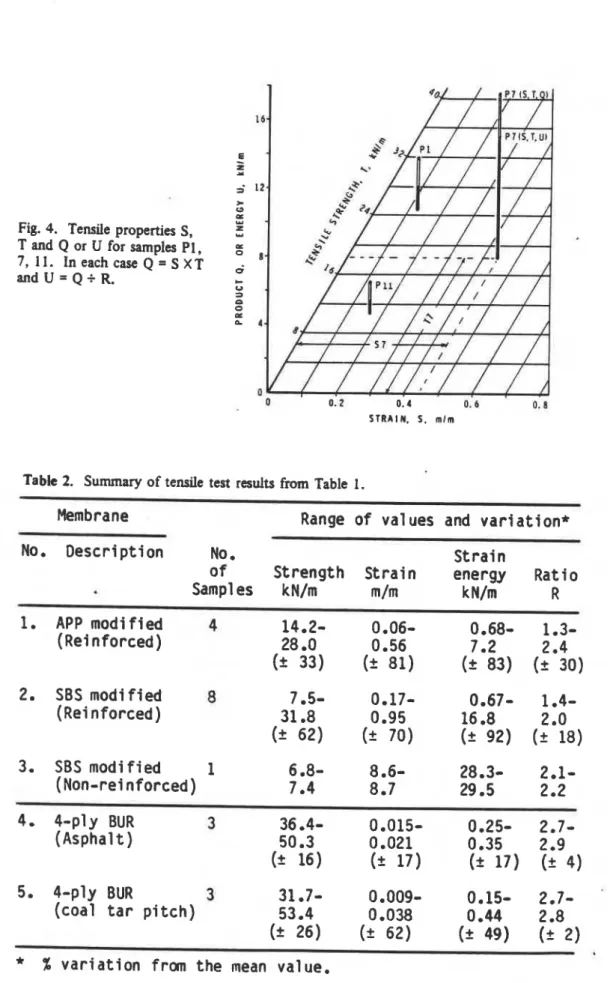
Fig. 4. Tensile properties S, T and Q or U for samples P1,
7, 1 1 . Ineachcase Q = S X T and U = Q i R.
0 0. Z 0.4 0. b 0.1 S T R A I N . 5. m l m
Tabk 2. Summary of tensile test results from Table 1.
Membrane Range o f val ues and v a r i a t i o n *
No. Description No. S t r a i n
o f Strength S t r a i n energy Ratio Sampl es kN/m m/m k N/m R 1. APP modified 4 14.2- (Reinforced) 28 .O (3 33) 2. SBS modified 8 7 .5- (Rei nforced) 31
.a
(2 62) 3. SBS modified 1 6.8- (Non-rei nforced) 7 .4 4. 4 . ~ 1 ~ BUR 3 36.4- 0.015- 0.25- 2.7- (Asphalt) 50.3 0 .021 0.35 2.9 (2 16) (2 17) (2 17) (+ 4) 3 5. 4-ply BUR 31.7- 0 009- 0.15- 2*7- (coal t a r p i t c h ) 53 .4 0.038 0.44 2.8 (2 26) (2 62) (2 49) (2 2)Strain Energy
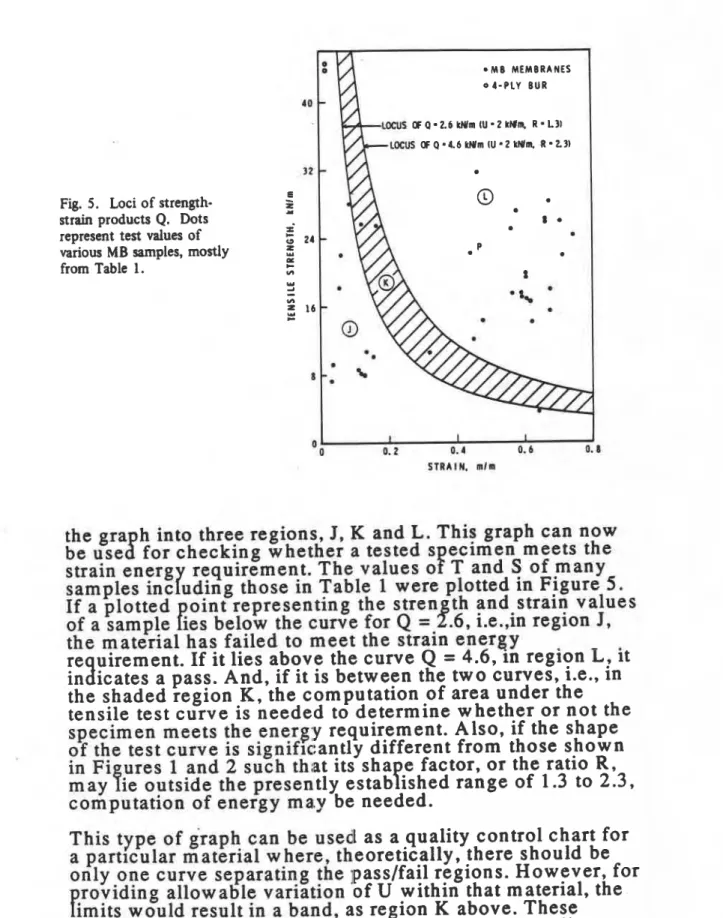
Fig. 5. Loci of strength- E strain products Q. Dots
z
represent test values of i 5 24various MB samples, mostly 9
a from Table 1. #A C w
-
111 5 16 C I I 1 0. 2 0.1 0.6 I S T R A I N . mlmthe gra h into three regions, J,
K
and L. This graph can now be use$
for checking whether a tested s ecimen meets ther
F
strain energ requirement. The values o T and S of many samples inc uding those in Table 1 were plotted in Figure 5. If a plotted oint representing the stren th and strain values of a sample
P
ies below the curve for Q =1
.6, i.e.,in region J,t h e material has failed to meet the strain energy
re uirement. If it lies above the curve Q = 4.6, in region L, it
in
I
icates a pass. And, if it is between the two curves, i.e., in the shaded region K , the computation of area under the tensile test curve is needed to determine whether or not the specimen meets the energy requirement. Also, if the shapeof the test curve is signifrc;antly different from those shown
in Fi ures 1 and 2 such th;at its sha e factor, or the ratio R ,
B
may ie outside the presently estab
f
ished range of 1.3 to 2.3, computation of energy ma,y be needed.This
type of graph can be used as a quality control chart fora particular material where, theoretically, there should be
only one curve separating the passlfail regions. However, for
roviding allowable variation 'of U within that material, the Ernits would result in a band, as region K above. These regions are then used for verication as explained earlier.
90 Roofs and Roofisq [Ch.
The concept of ratio R can be applied to estimate numerical value of strain energy without corn putin the area of load- elongation diagram. Consider, for examp
!
e, a black dot P in Figure 5, which represents the material Sam le No.7 (Table 1) whose strength-strain product Q is 9.72 k %I /m. Using an extreme value of R , 1.3 or 2.3, of the range establishedearlier, the strain energy of the Sam le works out as U =
Q/R
= 4.72/(1.3 or2.3) = 7.48 or 4.23 k
&
/m.It means thatU can take any value between 4.23 and 7.48 depending on the shape of tensile test curve.A similar argument can extend the use of the concept of strength -s train product for comparing a sample's energy capacity with t h e minimum energy required. From the above exam le,
(Q
available)/(Q re uired) can be written as9.72/?2.6 or 4.6) = 3.74 or 2.
9
1 . It means that the strain energy ca acity of the sampIe cannot be more than 374% or less than1
11% of the minimum requirement. The above results can be expressed i n different mathematical forms according to the objective of tlhe analysis.In the case of tensile testing at low temperatures, it is
ex ected that the material will be more brittle and will e x
!
ibit a somewhat linear behaviour resulting in a ratio R close to 2. For such test conditions, a new gra h can beptincip
P
e.R
develo e d as explained earlier for applying t e strain energy The results of various membrane Sam les plotted in Figure 5 show that the majority are far above t
7,
e minimumrequirement of Q, and hence of U , and a few are failing. Only three are in the grey or shaded) area that may require
f
detailed calculation o energy. The two tiny o en circles near the to left corner of the graph represent the U R values.
R
d
They ave been incIuded to present the osition of
B U R
ont h e tensile energy spectrum of modifie
1
b i t u m i n o u smembranes. since it is commonly argued 141 that in order to establish valid and acceptable criteria, the past performance
of BUR mern branes that have served satisfactonly must be
used as a point of reference.
CONCLUSIONS
1. A methodolo y is developed where strain energy
requirern ent rep
f
aces the standard tensile requirements. Thls eliminates t h e need for checking for strength and strain criteria separately. It has t h e potential for appIication i n m a n y engineering probIem s.2. The method of application of the energy criterion based on the concepts of strength-strain product and ratio R shows that the energy requirement is trans
3
ated into a range8 1 Strain Energy 91
of
Q
values. This permits the tensile test results to be easily verified for strain ener y by plotting the test results off
strength and strain on t e graph, or control chart, containing the 'pass', 'fail' or 'may be' domains.
3. It is obvious from the roposed graph that the energy criterion accommodates t
f
e broad range of very low to very high modulus materials commonly found in the modified bituminous membrane category.4. Numerical value of the strain energy can be estimated by using the values of the selected range of ratios and the
strength-strain product without computation of the actual area of tensile test curve.
5. The minimum energy requirement can be s e t according to the environmental and performance conditions such as low temperature, or to the properties after weathering and aging, which are based on laboratory tests and field surveys.
6. The methodology can be further sim lified by developing a graph for load-elongation product anB strain energy in N.m. This would, of course, be valid for specific size
specimens, but would cut down the computation work. This situation is common in testing for quality control or for compliance with a given specification.
7. The B U R samples marked by two tiny open circles lie in the fail region (Figure 5). If it is desired to include BUR in the passing region for comparison with the MB membranes, the minimum energy requlrernent can be reduced or,
alternatively, the hyperbolic equations for Q may be modified.
ACKNOWLEDGEMENT
The author acknowledges with thanks the assistance of D.A. Neely in conductin the laboratory tests. This paper is a contribution from t
%
e Institute for Research in Construction, National Research Council of Canada.REFERENCES
1. Dutt, 0. and Ashton,
H.E.,
'PVC Roofing Membranes-
Factors Affecting Tensile Tests', Proceedings of Second International S mposium on Roofing Technolo ,Gaithersburg, & D , September 1985, pp.16 1-1
b;r
2. Canadian General Standards Board (CGSB) 37-GP-56M Standard for Membrane, Bituminous, Prefabricated, and Reinforced for Roofing, July 1980, pp.3-6.
92 Roofs a d Roofmg [Ch. 81
3. European Union of A rement, UEAtc, 'Special Directives for . the Assessment of Rein
!
orced Wate roof Covering ofAPPISBS Polymer Bitumen, M . o . A ~ . No.3013 1, August 1984, pp.5-14.
4. Mathey, Robert G., and Cullen, William C., 'Preliminary Performance Criteria for Bituminous Membrane Roofing', U.S. National Bureau of Standards, NB S-B S 5 5 , November 1974, pp.5-10.
5. Rossiter, Walter J., Jr. and Bentz, Dale P., 'Strain Energy of Bituminous B uilt-Up Membranes: An Alternative to the
Tensile Strength Criterion'.
U.S.
National Bureau of Standards. NB SIR 86-341 8, September 1986, pp.39-44.This paper is being distributed in reprint form by the Institute for Research in Construction. A list of building practice and research publications available from the Institute may be obtained by writing to
the Publications Section, Institute for Research in Construction, National Research Council of Canada, Ottawa, Ontario, KIA 0R6.
Ce document est distribu6 sous forme dc tire-8-part par 1'Institut de recherche en construction. On peut obtenir une liste des publications de 1'Institut portant sur les techniques ou les recherches en matikre de bitiment en hivant B la Section des publications, Institut de recherche en construction, Conseil national de recherches du Canada, Ottawa (Ontario), K 1 A OR6.