Chemical Enhancement of Carbon Dioxide Transfer across the Air-Sea Interface
by
Klaus Keller
cand. Ing.
Technische Universitat Berlin
March 1991
Submitted to the Department of Civil and Environmental Engineering in Partial
Fulfillment of the Requirements for the Degree of
Master of Science in Civil and Environmental Engineering
at the
Massachusetts Institute of Technology
September 1994
© Massachusetts Institute of Technology
All rights reserved
Signature of Author
Department of Civil and Environmental Engineering
p.->
August 4, 1994
Certified by , . , ,
Franqois M.M. Morel Professor, Civil and Environmental Engineering
It)
Thesis Supervisor
Accepted byJoseph M. Sussman
Chairman,
Itment Graduate Committee
Chemical Enhancement of Carbon Dioxide Transfer across the Air-Sea Interface
byKlaus Keller
Submitted to the Department of Civil and Environmental Engineering
on August 4, 1994 in Partial Fulfillment of the Requirements for the Degree of
Master of Science in Civil and Environmental Engineering
Abstract
The question of chemically enhanced transport of carbon dioxide across the air-sea
interface was reexamined using a general numerical model. The model shows that theenhancement factors are greater for a film penetration model than for a laminar film
model. The results are in good agreement with independently determined experimental
values. The model predicts higher enhancement factors than an earlier numerical model by
Quinn and Otto (1971).
This difference can be attributed to several factors: the
consideration of changing pCO2 and pH of the water bulk phase, the solution of the entire
alkalinity expression, and the incorporation of the hydroxyl pathway for the hydration
reaction. Calculations of the local effects of carbonic anhydrase in seawater show that the
additional enhancement caused by the enzyme is less then 2 %.Previous calculations with annually and globally averaged input parameters have lead to underestimations of the real effect of chemical enhancement because the rela-tionship between the input parameters and the enhancement factor (EF) is highly nonlinear as well as asymmetrical and the input parameters are intercorrelated. Under absorbing
conditions, the undersaturation with respect to C0
2causes a higher pH. At higher pH the
hydroxyl pathway and therefore chemical enhancement becomes more important. The
problem is asymmetrical because the oceans can 'breathe in' more easily than they can'breathe out'. The relatively small net influx of C0
2is the result of much larger in- and
out-fluxes. This amplifies the effect of chemical enhancement. As a result, the overall
global effect of chemical enhancement can be bigger than the maximum local enhancement
factor.
Assuming typically encountered wind speeds and air-sea C0 2 gradients for the
Atlantic region, the actual effect of chemical enhancement could be as big as 15 % on a regional scale and up to 27 % on a basin scale. The higher enhancement for absorption conditions compared to desorption causes an average supersaturation of the oceans. The
apparent disagreement between
14C derived air-sea gas exchange rates and rates based
on radon measurements can be explained by chemical reactions. Chemical enhancementcannot be neglected in modeling the fate of C0
2.
Thesis Supervisor: Dr. Frangois M.M. Morel
Acknowledgments
After one great year in the Parsons Lab, I want to express my gratitude for the
ex-traordinary hospitality of Frangois Morel and his group. Their friendship helped me settle into a more than academically special environment.Only a few of the people who helped me during the last year fit on one page. Frangois Morel introduced me to this field, showed me new ideas, ways of thinking and helped me with his persistence to find a solution. He is much more than an advisor to me. Dianne Newman, John Reinfelder, Brian Fairchild and Mick Follows refined my humble English in this thesis. The discussions with them clarified the topic and gave me new
ideas. Finally I want to thank my parents and Meltem for their encouragement, support
and patience.The author was supported by the Technische Universitilt Berlin and the Studienstiftung des Deutschen Volkes. Additional support from NSF and ONR is gratefully acknowl-edged.
Table of Contents:
I. Introduction . ...6
II. Conceptual and mathematical model ... 7
A. Physical mass transfer ... 7
B. Chemical reactions ... 10
C. Enhanced transport ...
10
III. Analytical approximations and numerical solutions ... 13
IV. Results... 17
A. Comparison with previous numerical results ... 17
B. Numerical results ... 18
C. Comparison with measured data ...
20
D. Effects of carbonic anhydrase ... 21
E. Effect of averaging on the effective EF ... 25
V. Summary and Conclusions ... 38
VI. References ...
40
VII. Appendices ...
44
Appendix A. Notation .
...
44
Appendix B. Constants and interpolation methods ... 47
Appendix C. Equations describing the chemical system ... 50
Appendix D. Equations and assumptions for the estimation
of averaging effects ...
52
List of Figures:
Figure 1: Conceptual picture of physical mass transfer ... 8
Figure 2: Comparison of numerical results with analytical approximations forthe laminar film model ... 15 Figure 3: EFs calculated with laminar film and film penetration model as a
function of the pH of the bulk phase ...
19
Figure 4: Effects of changing carbonic anhydrase concentration on the EF in alaminar film model at different laminar layer thicknesses ... 23 Figure 5: EFs as a function of carbonic anhydrase concentration evaluated with
different mass transfer models ...
2...24
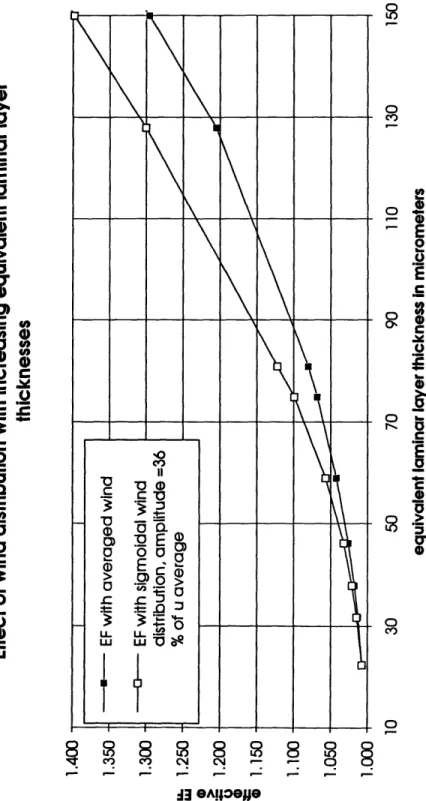
Figure 6: Effective EFs with a changing wind speed distribution ... 28Figure 7: Effective EFs with constant wind distribution and varying effective
laminar layer thickness ... 29 Figure 8: EFs as a function of ApCO2 of the bulk phase at different laminar
layer thicknesses ...
33
Figure 9: Effective EFs as a function of averaged ApCO2... 34I. Introduction
Modeling the global cycle of carbon dioxide (C0O2) is becoming increasingly important
due to the threat of global warming. The oceans play the biggest role in the
geo-chemical cycle of C0
2, where the majority of anthropogenic C0
2is finally absorbed
over geological time scales (Baes (1982)). Yet to be resolved are two important
ques-tions: How fast can the oceans respond to the increasing atmospheric C02concentra-tions? And how much are they absorbing in the end?
In recent years, scientists have approached this problem by incorporating more and more features (such as biological activity in the oceans or refined resolution of data re-trieved by satellite measurements) into global carbon cycle models. But the problem has yet to be solved satisfactorily. Besides a missing sink of approximately 1.8 Gt of carbon per year in the global budget (Winn (1994)), the CO2 exchange rate between the
atmosphere and the oceans seems to be considerably higher when determined by carbon species than when calculated by the unreactive gas radon (Broecker et al (1986)).
Three approaches are commonly taken to determine the average oceanic C0
2exchange
rate (Broecker and Peng (1984)). The natural
14C method predicts a rate of 21
moles*m- 2*yearl. The artificial 1 4C method deduces a CO2 exchange rate of 23 plusor minus 5 moles*m-
2*yearl. The radon method finally yields a globally averaged
ex-change rate of about 16 moles*m-2*year- 1l. Each of these predictive methods must wrestle with the inherent complexity of global air-sea gas exchange. Besides the ques-tion of chemical enhancement, other factors such as the influence of wind speed,differ-ent diffusivities, cooling of the surface due to evaporation and injection of bubbles at higher wind speeds still remain only partially quantified (Broecker and Peng (1984)).
Peng et al (1979) confirmed that the globally averaged mass transfer coefficient derived
from carbon species is a factor of 1.2 to 1.4 bigger than values derived from the radon
method. The possibility that this enhanced absorption of CO
2could be due to chemical
enhancement without the existence of a catalyst like carbonic anhydrase (CA) was
de-nied by the authors based on the studies of Bolin (1960) and Hoover and Berkshire
(1969). This thesis reexamines the question whether this effect could be explained by chemical enhancement and if so, under what conditions. First, previously used modelsare recalculated and extended; second, the needed concentration of carbonic anhydrase
to explain the global enhancement is determined; and finally, the possible effects of in-sufficient data resolution and the resulting averaging over large space and time domains is estimated.II. Conceptual and mathematical model
A. Physical mass transfer
The transfer of the anthropogenic CO2 spike into the oceans is a transient problem. To
answer the question of how fast C0
2is absorbed by the oceans, mass transfer rates
between the atmosphere and the water are relevant. The commonly used equation
de-scribing the flux F of CO
2across the air-sea interface has the form:
with:
APCO
2 = pCO2, - PCO2,ai,(2.2)
The subscript I indicates that almost all resistance to mass transfer is in the liquid phase. Various transport models are distinguished by the methods used to evaluate the mass transfer coefficient kl, which is proportional to the diffusivity constant to some power
n.
k, oc D (2.3)
In his laminar layer model, Whitman (1923) pictures the process as governed by a layer
in which the rate of molecular diffusion limits transport (Figure 1). The adjacent phases
are considered to be well mixed and the equation for the mass transfer coefficientbe-comes:
D
z(2.4)
pC02
Air
x _ ... ....renewal parcel
control volume
/ erenewed parcel
after
exposure time
-I f ! IThe mass transfer coefficient is then directly proportional to the molecular diffusivity of the gas. Although the real physical conditions at the air-sea interface are generally
different from this picture, its conceptual power and mathematical simplicity cause the
laminar film model to be widely popular.
Danckwerts (1951) changed the theoretical framework by assuming that an initially well
mixed bulk phase is subject to absorption and is mixed by a turbulent eddy with a
sur-face renewal rate of s. The mass transfer coefficient for the sursur-face renewal model is
then
k, = f3
(2.5)
with n equal to 0.5.
Roberts and Dandliker (1983) empirically determined the value of n to be around 0.6
for turbulent conditions; Holmen and Liss (1984) gave a value of approximately 0.57.
The variation in n can be accounted for by the film penetration model of Dobbins
(1955) which combines the film and surface renewal models. A finite laminar film is mixed after a time exposure of 0 which results in:D
z 22z2 1 _2I2DO
k
=
1
14
D
2 )
2)exp(
(2.6)
where n lies in between 0.5 and 1 depending on how turbulent the conditions at the in-terface are. At high layer thicknesses and short exposure times, this model behaves like a surface renewal model, whereas in the opposite case, the model approaches the lami-nar film model.
B. Chemical reactions
The model of water chemistry is primarily based on water, carbon, and borate species.
The equations describing the system are given in Appendix C.All the acid-base reactions - except the hydration of C02 - can be treated as
pseudo-equilibrium reactions at the time scales involved. Three pathways lead to the hydration
or dehydration of C0
2: reaction with water, with the hydroxyl (OH-) ion, and the
reac-tion catalyzed by the enzyme carbonic anhydrase.
The kinetic rate expression for the carbonic anhydrase pathway is quite complex and
treated in the literature in many different ways (Lindskog et al (1984); Otto (1971);
Lindskog (1980)). I have assumed Michaelis-Menten kinetics with no equilibrium shift due to carbonic anhydrase addition, no limitation by protons in the dehydrationdirec-tion, and equal half saturation constants for the hydration and dehydration direction.
The hydration rate constant is a function of the ionization of the enzyme with an apparent PKa,CA value. Based on these assumptions, the dehydration rate constant is adirect function of the hydration rate constant.
C. Enhanced transport
Because reaction-diffusion systems have been described in the literature at length by
many others (Danckwerts (1970); Astarita (1983); Westerterp and Wijngaarden
(1992)) only a short outline is presented here.If a molecule is able to react during its transport, the product can also be transported and an enhanced flux results. This effect is incorporated in the flux expression by the
enhancement factor, defined as
EF
= kl'with reaction(2.7)
k,without reaction
The relative magnitude of the diffusion time scale compared to the reaction time scale
determines the degree of enhancement. This is expressed in the dimensionless ratio of these time scales, known as the Damkohler number, here defined for a first-orderreac-tion (Scharzenbach et al (1993); Zlokarnik (1990)):
Da =
Dk
(2.8)
kIwithoutreaction
At very high Damkohler numbers, the reaction is much faster than diffusion. Chemical equilibrium can be assumed everywhere, leading to equilibrium enhancement. At very low Damkohler numbers, diffusion is very fast compared to chemical reactions and chemical enhancement is negligible.
The mass balance of each species with concentration-independent diffusivities links re-action and diffusion processes to one another and yields the partial differential equation for the concentration ci of each species:
aci
= D ia 2i - k * i (2.9)
at
caX2
The indices i=1..3 denote the species carbon dioxide, bicarbonate, and carbonate, re-spectively. For the laminar film model, only the steady state solution is of interest, in-dependent from the initial conditions. The film penetration model must be solved for a time history, starting from well-mixed initial conditions. The flux due to electrical
po-tential differences can be neglected if the charged species have the same diffusivities. This is equivalent to meeting the electroneutrality condition at every point. These coupled nonlinear partial differential equations are subject to the following boundary
and initial conditions.
At the air-sea interface the ionic species cannot partition into the air, which is expressed
by the no-flux boundary conditions:
a
[HCO3]a
=0 L=o
(2.10)
ax
ando
[Co:2-]
a
[co]
I,0
(2.11)ax
CO2 at the interface is assumed to be always saturated with respect to the overlying
atmosphere.
[C02 ]
Ix=o
= Khenry
* pCOz
2,a(2.12)
At the lower boundary, (the bulk water phase) chemical equilibrium is assumed and all
concentrations are fixed. The chemical composition of the bulk phase is expressed by
the saturation ratio of total inorganic carbon (rsct) with
Irsc t,satud at pCO 2=.
(2.13)
Ctrea
Im Analytical approximations and numerical solutions
To solve the system of partial differential equations numerically, I applied an explicit finite difference algorithm with time-splitting for diffusion and reaction. The pH of the solution was calculated by applying a bi-section root finder (Press et al (1990)) to the alkalinity expression. The space and time discretization was increased until the
calcu-lated EFs were constant.
The model is able to calculate the EF over the entire range of Damkohler numbers. As the Damkohler number approaches zero and infinity, the EFs approach their theoretical limits asymptotically.
In the laminar film model, steady state was reached when the variance of the total car-bon fluxes through each layer was below 0.2 % and the change in EF was negligible. The EF with this mass transfer model was evaluated as the ratio of the average of the calculated total carbon flux at each layer to the theoretical diffusional C02 flux, defined
by the boundary conditions. The routine converged from different initial conditions to
a constant EF.There are several analytical approximations available for the laminar film model. The analytical approximations given by Smith (1985) with
EF= rz * cosh(r*z)
(3.1)
sinh (r z)
where
r =
{H}+k
*K
(3.2)
Do * H}
is compared with the numerically obtained values and Hoover and Berkshire's (1969) approximation in Figure 2.
Both analytical approximations assume that the pH in the laminar layer is constant and equal to that of the bulk phase and consider the hydration as well as the hydroxylation pathway. Bolin's (1960) approximation neglects the hydroxylation pathway, and therefore fails to represent an important feature of the system. Because Smith (1985) treats the CO2 reaction as a first-order irreversible reaction, his solution does not
re-flect the upper limit of the EF that would be achieved at equilibrium enhancement conditions (i.e., at high Damkohler numbers). His assumptions hold as long as the EF is not too high. Under oceanic conditions, the EF is always small compared to the EF under equilibrium enhancement. The maximum error introduced by using Smith's (1985) approximation instead of the numerical solution is below 3 % at a laminar layer thickness of 200 gm and a pH of 8.38. The use of Smith's (1985) approximation is therefore appropriate for estimating chemical enhancement of air-sea CO2 transport if
.C =.
o
._
f.
0. E, -Co
*o
QE
O UJ0
Lbo
o
,, LO LUo
C
o X E .o8
LJ0
x / co co c C c _ JO0ooj lueWe9OUDqU3Figure 2: Comparison of numerical results with analytical approximations for the laminar film model
The computation of the EF with the film penetration model is numerically more
com-plex. The evaluation of the fluxes and the EF in the analytical expressions for a film
penetration model is done by evaluating the flux expression at the interface. When
in-tegrated with respect to time, this yields the amount of carbon absorbed per unit area
and kl is determined by(Dc
[c
2
)dt
1=0 ax
k= xo (3.3)
o([COluphe [ interfac)
This equation, however, is very inaccurate if evaluated numerically. The reason is that
at the interface the amount of reaction is at a maximum. To adequately represent this
change numerically, very high time and space discretizations are required. A mass bal-ance of ct yields the following scheme which proves to be numerically more accurate.3 x=zL t 3
l; (= -c,)d
- |(D.a
)dD
ki=
X=O
t0
i=
1
--
(34)
=([C021bulphas -[C
2
]tece.)The film penetration model was evaluated at a high degree of turbulence (i.e., at a high
ratio of laminar layer thicknesses to exposure times). It represents the behavior of a
surface renewal model. To calculate the EF for the film penetration model, the kl val-ues calculated with and without chemical reaction starting from the same initialcondi-tions were compared.
IV. Results
A. Comparison with previous numerical results
Improvements over the model of Quinn and Otto (1971) are: the solution of the entire
alkalinity expression, the consideration of the OH- pathway, and the inclusion ofvari-able bulk water pH. Quinn and Otto (1971) incorporated the OH- pathway in their
governing equations but neglected it in the actual calculations. This is only of minorimportance if the pH of the bulk phase is held constant at 8, as it is in their study, but
becomes an important factor when the bulk phase pH is variable. I have changed the pCO2,water rather than pC02,air. This is a more realistic approach, given that the at-mospheric partial pressure of CO2 can be assumed to be practically constant, whereasthe seawater pCO2 can vary (for example due to biological activity) over short time
scales on the order of days (Robertson et al (1993)).
Actual measured pH values in the oceans range from 7.8 to 8.5 (Simpson and Zirino (1980)). At an average pH of 8.3, the CO2 turnover in seawater due to the OH-
path-way is around 50 %. By neglecting this, one would underestimate the EF and fail to represent the nonlinearity of the EF with respect to ApCO2. As we shall see, such nonlinearity, however, is a critical property of the system and must be taken into
account when averaging.
Including the full alkalinity expression, the OH- pathway, and the variable bulk phase pH significantly effects the predicted EF. While the model of Quinn and Otto (1971)
predicts an equilibrium EF of 2.67 at ApC0
2=-227 gatm, a pH of 8.0 and T=20 C, the
new model calculates a pH of 8.6 and an equilibrium EF of 18. In the kinetic regime, the difference between EFs estimated by the two models increases with increasing Damkohler numbers. At a laminar layer thickness of 182 gm and the above specified
boundary conditions this difference between the EFs is still 20 %.
B. Numerical results
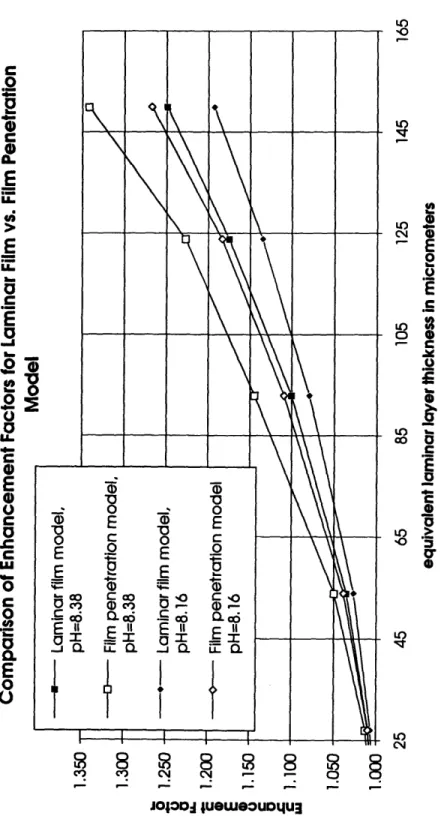
The numerical results for the laminar film and the film penetration model at two
differ-ent pH values are shown in Figure 3.Danckwerts (1970) suggested that in most cases the film model would lead to almost
the same prediction for the EF as the surface renewal model. Calculations with the two
different models, however, predict different EFs. So why are the predicted EFs higher
for the film penetration model than for the laminar film model ?There are two reasons. First, Danckwerts' (1970) point is true as long as the
diffusivi-ties of all transported molecules are the same. In the case of CO2 absorption, however,bicarbonate diffusivity is roughly only 50 % of that of CO
2. The equilibrium EF under
these conditions is always higher for a surface renewal model than for a laminar filmmodel, because, as discussed earlier, the ratio of diffusivities is weighted by a power of
0.5 as opposed to 1.C
2
0,
iz
q-Ea
CL O -C)0
C0
E0
r=w
C0
0.
E0
U) 0 0 .' 0 0o
U) CT LO Cf)! C J lueN -u -uJOlOOd uewO OUDolu3
Figure 3: EFPs calculated with laminar film and film penetration model as a function of the pH of the bulk phase
Second, even with equal diffusivities, the models predict slightly different EFs at
intermediate Damkohler numbers. Chemical reactions are more important in surface
renewal models than in laminar film models. The reason is that directly after a mixing event, the species concentrations at the interface are farthest from equilibrium and accordingly the reaction rate is at a maximum. In a laminar film model only the steady state solution is of interest and the "spike" in reaction rate that accompanies mixing isnot considered. Predicted EFs at intermediate Damkohler numbers are therefore higher
for a film penetration model.This effect was illustrated by Glasscock and Rochelle (1989) in a numerical study with
bimolecular reversible reactions and different diffusivities. They showed that the
differ-ence of the EFs has a maximum value at EFs around 1.5, which falls within the relevant
range for CO2 transfer across the air-sea interface. The additional reaction ofbicar-bonate to carbicar-bonate included here, but not considered by Glasscock and Rochelle
(1989), further increases the reaction rate because the back-reaction of bicarbonate to
CO
2becomes less efficient with decreasing bicarbonate concentrations.
C. Comparison with measured data
Measurements of EFs for C0
2transfer across the air-water interface have been
reported by Emerson (1975), Hoover and Berkshire (1969), Liss (1983), Broecker and
Peng (1973), Goldman and Dennet (1983), and Berger and Libby (1969). The last
three reported measurements were for water at pH values typical for seawater. In all
these papers important input parameters such as laminar layer thicknesses or pH valueswere either missing or variable over the course of the experiment. As a result, the
measured EFs have a large degree of error. For example, Emerson's (1975)
measure-ment of one EF ranges from 4.1 to 6.5 with an error of plus or minus 23 percent. Additionally, the range of input parameters (such as kinetic rate constants) is so large that it is relatively easy for both numerical and analytical models to reproduce the measured EFs. Smith's (1985) analytical approximation, as well as the presented nu-merical model, is able to reproduce the range of Emerson's (1975) experimental values.For the same reason, it is not possible to discriminate against any of the existing mass
transfer models on the basis of the cited experimental EF values.D. Effects of carbonic anhydrase
Berger and Libby (1969) first hypothesized that the enzyme carbonic anhydrase could
cause the globally observed enhancement of C0
2transfer across the air-sea boundary.
By adding 0.5 mg/l (which equals about 1.7* 10-8 M) to aerated steel drums, they found
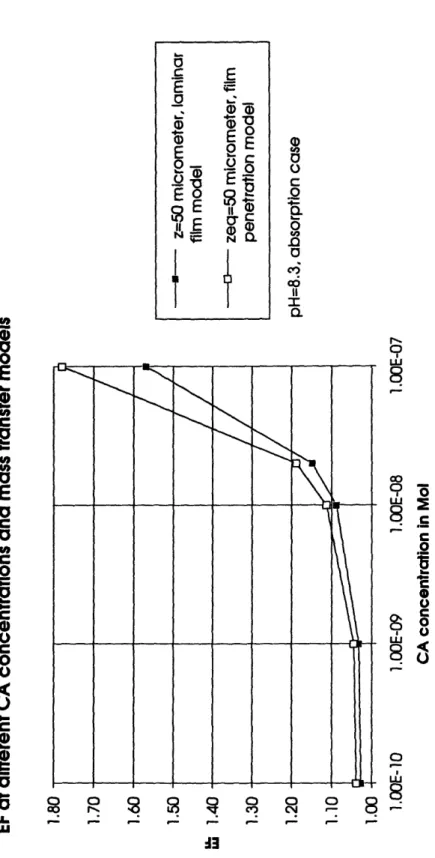
a 30 fold increase in the apparent reactivity. Their experimental setup suggests rather high laminar layer thicknesses. Quinn and Otto (1971) calculated the carbonic anhy-drase concentration needed to reduce the film thickness at which reactions become im-portant to be 10-7 M. The numerical model predicts an EF of 1.6 at z=50 m at this carbonic anhydrase concentration. This concentration is in excess of that necessary tocause the observed global enhancement. Goldmann and Dennet (1983) tried to
repro-duce the Berger and Libby (1969) results using a hydrodynamically more defined stirred cell with artificial and natural seawater. They measured EFs of 1.6 and 2 at 0.5 and 2 mg/l carbonic anhydrase respectively, but only at moderate degree of turbulence, to which they assigned a laminar layer thickness of 450 gm. Based on thesemeasure-ments and the results of inhibitor studies, they concluded that carbonic anhydrase does
not effect enhancement of CO
2transfer in seawater.
These calculations and experiments show that carbonic anhydrase can cause consider-able enhancement if the concentration is high enough. The maximum carbonic
anhy-drase concentration at the very surface of the oceans is constrained by the
concentra-tions of zinc and perhaps cadmium there, because every active site of carbonic anhy-drase requires a zinc atom. A substitution of zinc by cadmium in CA is possible. The upper limit of typically encountered total zinc and cadmium concentrations in oceanicsurface waters is lower than 2*10-9 mol/kg (Broecker and Peng (1982)).
Surface layer partitioning could increase the carbonic anhydrase concentration in the microlayer. Measurements by Duce et al (1972) show an average microlayer
enrich-ment factor for PCBs of 18.5. Assuming carbonic anhydrase partitions like PCBs and a
conservative bulk surface water zink and cadmium concentration of 10-9 M, thecar-bonic anhydrase concentration in this microlayer could be as high as about 2*10-8 M.
Using the conservative estimation for the carbonic anhydrase concentration and a
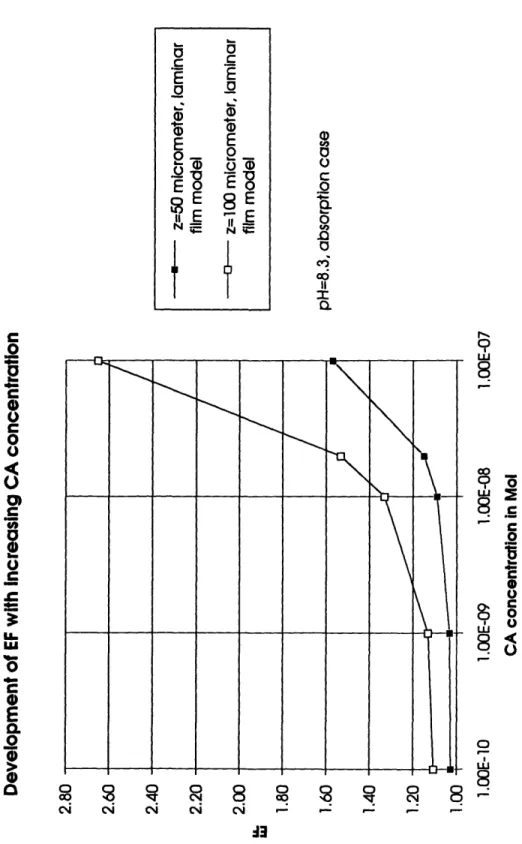
globally averaged laminar layer thickness of 50 gim, the EF is less than 1.05 (Figure 4). A change to the film penetration model does not alter the situation significantly (Figure 5). Only at the maximum estimated carbonic anhydrase concentration and a high equivalent laminar layer thickness of z = 65 gm is the calculated EF of 1.24 close to theC,
o
0
U co.0
Q0 IIa
CP O0~~~~~~~~~~~~
90 Ce
0
C0
U0,
oC0
O)0
C WE
0
LU8
o
L o 8i
C0
C0
. U0
f... Wu 00
0
O
2
'0Q 0
8
0
Cq2
o0 0
o 8 -c Cj ci cJ ci _ _ _ _ -13Figure 4: Effects of changing carbonic anhydrase concentration on the EF in a laminar film model at different laminar layer thicknesses
C E E
a
o
,. ,.E 0E
E
8E
o E 8 E
t
q,-
L{1
I
E
fa N. C2
~0a
E
l0
C Co
2
0-C0
C0
Uo
4,-c
'o
a
10 lb lUIL 'U a) 0 C .E0
c-0
.Q co III
C.8
8
l8
v"-v", .52
C0
t
C 0 00
U -, 11q pl~~~~~2 S q1o4
o
S
S
_: _ __ A3Figure 5: EFs as a function of carbonic anhydrase concentration evaluated with
0-
c
E_
V0 ° a) -EE
E
i
5
2
a
t
0
C!8
E. Effect of averaging on the effective EF
The globally averaged laminar layer thickness determined by the radon method is 50 plus or minus 30 gm (Broecker and Peng (1973)). Given this layer thickness, a pH of 8.3 and a temperature of 25 °C, the local EF is only 1.03. This calculation explains why chemical enhancement was thought to be negligible. The underlying assumption is that the global effect of chemical enhancement is the same as the effect that would re-sult in a hypothetical situation where the constant local wind speed, temperature and
pH would correspond to their globally averaged values. This hypothetical observed
lo-cal EF with averaged input parameters, however, is not identilo-cal to the global effect expressed by the effective EF:|
ApCO2* k * Ken
F
EFff = spaceie (4.1)
I
ApCO2 *k,*Kenry space timeIf the local EF is not changing as a function of the input parameters or if the conditions
are constant, the effective EF simplifies to the local EF.
Averaging all input parameters neglects four major properties of the system: the corre-lation between the input parameters, asymmetric recorre-lationships between input parame-ters and the local EF, the distributions of the input parameparame-ters, and the effects of aver-aging input parameters in nonlinear functions. Because of these properties of the sys-tem, calculated effective EFs are a function of the temporal and spatial discretization of the input data. The evaluation of the averaging effect is complicated by the weighting
factors (ApCO
2, k
Iand KHenry) in front of the term EF. These weighting factors as
well as the EF itself are a function of the chemical and physical boundary conditions of the system.
I will show that situations exist in which the effective EF is much greater than the maximum local EF. To illustrate the effect of averaging, I first impose distributed val-ues for one parameter at a time, considering wind speed and ApCO2 values as the most
important parameters. Finally, the case of changing wind speed and ApCO2
simultane-ously is examined. Measured values were used to calculate the amount of CO2
ab-sorbed without any averaging. When empirical parameter values were not available with sufficient resolution, their spatial and temporal distributions were modeled. Be-cause of its numerical convenience, the analytical approximation for the laminar film model was used to calculate the EF. Relevant equations and assumptions are given in Appendix D.
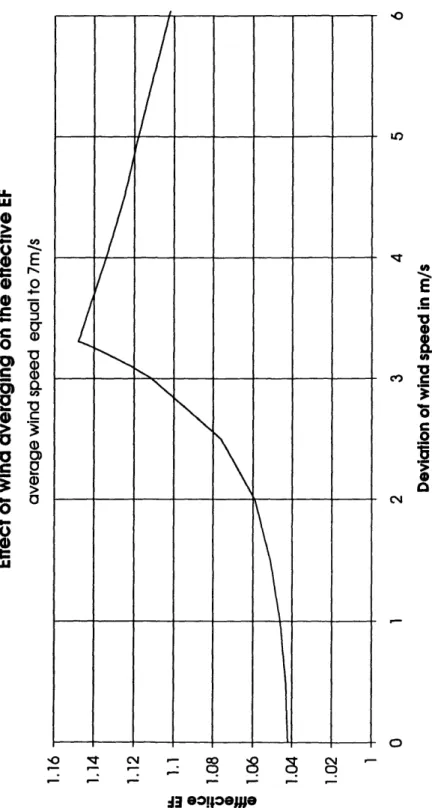
Averaging wind speed values underpredicts the effective EF at typical oceanic condi-tions. The effect of averaging the wind speeds on the effective EF is a function of both the average wind speed and the distribution type. The EF at an effective laminar layer thickness of 59 gtm, constant wind speed, and ApCO2 = -100 gatm is 1.04. To show
the influence of distribution at one fixed wind speed, I changed from a constant wind to a uniform distribution of two values. The effective EF can increase up to 1.15 (Figure 6). Clearly this high maximum EF is an upper limit for the effect of wind averaging at these conditions, because at high wind speeds more and more CO2 is absorbed at
al-most no enhancement and at low wind speeds the EF is limited by the assumed maxi-mum laminar layer thickness of 700 m. Hourly measured wind speed data
(Trowbridge (1994)) with the same chemical conditions and effective laminar layer thickness increased the effective EF only to 1.06.
The influence of distributed wind speeds changes with the average wind speed.
There-fore I modeled the effect of wind averaging as a function of the effective laminar layer thickness (Figure 7). Again, the enhancement is, in the typical oceanic range of thelaminar layer thickness, higher for a distributed wind. However, this effect cannot
account for the global EF alone.The additional effect of ApC0
2averaging may explain this phenomenon. If the
resolu-tion of the ApCO2 values is insufficient, the fact that huge in- and out-fluxes at
different physical and chemical conditions yield a relatively small net flux is neglected. The invasion rate based on natural 1 4C measurements is around 20 moles of carbon per m2 and year. At an oceanic surface of 3.62*1014 m2 and an atomic weight of 12 g per
mol of carbon, this equals a steady state in- and out-flux of 87 Gt of carbon per year
(Broecker and Peng (1993)). These huge in- and out-fluxes dominate the estimated net
absorption rate of 2 Gt of carbon per year (Winn (1994)).
The number of passages (np), defined by
npe L ced (4.2)
Jspace
me
en'hcedis one way to quantify this effect. It can be thought of as the average number of times a molecule has to pass through the interface until it stays at one side. The number of
passages based on the above values for the invasion rate and net absorption is 87.
IL
L"0
OE
Hec C a)0
Q + C5 a.5
*¢ C OU u)%- a
0
Ili LO ._ C l 0 0#A C,,) C.Fa
c
o:i
Iu
In10
I CN u co 'O -- '- - O - O 3 e!loellas0
0
t-Q Ca
*e0
0'
O4) O e0 C0
w O0
o _
.0 Ec
.o E C *, C -oo
Cj3
e!l4oejSeasonal cycling (Codispoti et al (1982)) and the geographic distribution of ApCO
2values cause these huge in- and out-fluxes. Global maps of annually averaged ApCO2
values range from minus 120 atm to plus 140 tatm (Keeling (1968)). The global average is estimated to be around -8 plus or minus 8 tatm (Broecker et al (1979)). Besides these variations, diurnal cycles and small scale variations of ApCO2 values have
been observed. Simpson and Zirino (1980) reported spatial variations with a length
scale down to 1 kmn and Robertson et al (1993) measured diurnal cycles with dailychanges of 20 patm.
The available resolution for ApCO2 data used for global C02 flux estimations is very
poor. Commonly used maps have a spatial resolution of about 5 degrees and are
calcu-lated with annual averages from real data sets or sometimes even with theoreticalmod-els (Etcheto et al (1991)). The maps of ApCO
2that are used neglect the existing fine
scale temporal and spatial variations. Calculation with one global average neglects thein- and out-fluxes entirely. Neither the effective EF nor the number of passages
de-pends on the discretization used for the calculation. But if one calculates the effective EF on the basis of discrete values, the result is dependent on the resolution of the inputparameters.
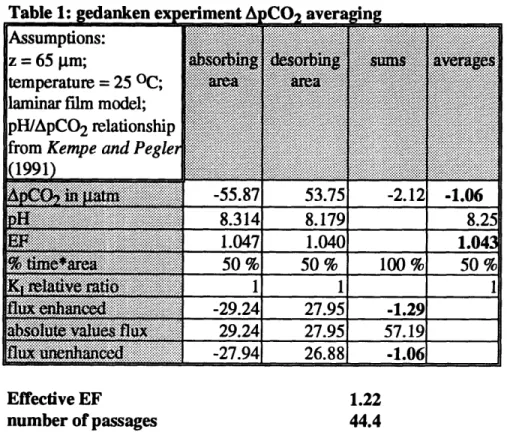
The gedanken experiment outlined in Table 1 illustrates the possible effects of neglect-ing chemical enhancement in this situation. Consider the situation of a two-box surface model, where for the sake of simplicity only the ApCO2 and the pH values are variable.
Table 1: edanken exeriment ACO
aver
ng
Assumptions:
z =65 lm; g
temperature = 25 OC;
...
laminar film model;
pH/ApCO 2 relationship ... ...
from Kempe and Pegle.
1991) i.... -55.87 53.75 -2.12 -1.06 .. ... 8.314 8.179 8.25 E'P ? a1:i;iiiiiiiiii a 1i 1.047 1.040 1.043i
e.
are...a
..
50 %
50 %
100 %
50 %
:~'i::i!.:''.6:.¥.. . .. -... , 1 1 1 K i 6 B a a1 1 1:f'liiE:':':- : a' :a"" a:-ixi -29.24 27.95 -1.29
6.::5.
lx
29.24
27.95
57.19
flu% un
:':he'd3~~-iiii:l6!
-27.94
26.88
-1.06
Effective EF 1.22
number of passages
44.4
The effective EF in this case is much higher than the maximum local EF. This effect
cannot be observed if one neglects the OH- pathway in the EF calculations, nor do
highly averaged calculations adequately represent this effect. This amplifying effect is a major feature of the system. If we merely took the net effect of the in- and out-fluxes we would underestimate the cumulative effect. The higher the number of passages and the asymmetry of the EF, the more important are the errors introduced by averaging the input parameters. I calculated the same example with numerical values for the film penetration model because of its higher sensitivity to changes in pH. The effective EF increased to a value of 1.27.The amplifying effect is caused by the asymmetric behavior of the EF with respect to
ApCO
2.
At absorbing conditions, the undersaturation with respect to CO
2causes a
higher pH. At higher pH the OH- pathway becomes more important and the EF in-creases. The problem is asymmetrical because the oceans can 'breathe in' more easily than they can 'breathe out' (Figure 8). The effective EF as a function of ApCO2 has
three important features: a vertical asymptote at ApCO2 equal to zero, negative EF
values, and a positive intercept on the ApCO2 axis (Figure 9).
The asymptotic behavior is based on the asymmetric properties of the EF. When the term
J
ApCO
2*ki*K, en
,
(4.3)
space time
goes to zero, the effective EF goes to infinity. This is equivalent to a situation in which there would be no flux without enhancement and the nonzero flux is caused by chemi-cal enhancement. Because the effective EF as a correction term is incorporated into the flux expression,
F , EF * ApCO
2(4.4)
it has to increase as the weighting factor driving force decreases. To cause the nonzero
flux at zero ApCO2, the effective EF has to go to infinity.At negative values of the effective EF, effective flux and averaged driving force have different signs. This means for example that there is a flux into the water, although the liquid is oversaturated on average. This can be explained by the no-flux condition for a
system at steady-state, defined by
f I ApC02*
k *KHe" *EF
= O(4.5)
CM
o
nE
0
E 4w
-2 'E zn O C_
f-3
E
l o_a
a
m C CQ8
N0
O0
0
la oQQ,
8
o
8
c
o
o
o8
Fg"- o §, , -3Figure 8: EFs as a function of APCO of the bulk phase at different laminar layer thicknesses
oEE
E E
8
a)
o
40 co 40 C
0
,a
Ea
4.. C2
0
,00
LL Ui 4)0
c0
a).-o
o a a) O, C -) C CN 040
o
"U 0 0 12 arv
c
-
o
7
C
3 eA!loeJ3Because of the asymmetry of the EF, the oceans, which breathe in more easily than they
breathe out, have to be slightly oversaturated with CO
2on the average in order not to
gain or lose C0
2. The equilibrium oversaturation is the intercept of the effective EF
with the ApCO2 axis. This oversaturation increases with increasing asymmetry of the
EF and increasing number of passages.
Oversaturation with oxygen has been observed at high wind speeds by Wallace and
Wirick (1992). This so called "wind pumping" is attributed to the asymmetrical effectof air entrainment. Breaking waves inject bubbles into deeper regions where, due to
the increased hydrostatic pressure, the water becomes oversaturated. According to
Broecker et al (1986), the oxygen oversaturation of the oceans is about 3 %. Much of
this supersaturation is caused by net photosynthesis, acting as an oxygen source term. Supersaturation values for oxygen and CO2 are different, because of the higher CO2 solubility, the buffering effects of seawater, and chemical enhancement. Memery and
Merlivat (1984) showed that the higher the solubility of a gas, the lower the effect of
wind pumping. These two reasons suggest that CO2 supersaturation caused by wind
pumping should be negligible. Like the nonlinearity due to chemical enhancement,
wind pumping is most important near equilibrium. The major difference between wind pumping and chemical enhancement pumping is that wind pumping is important at high wind speeds and on local scales, whereas chemical enhancement pumping is important at low wind speeds and on large scales.In the case of more than one variable parameter, the correlation between them becomes important. The values of KHenry, ApCO2 and wind speed are all correlated to each
The correlation between wind speed and ApCO2 is considered here as an example.
Be-cause the parameters have annual cycles, the phase shift between them as well as their
oscillation periods are important.
Consider a general absorbing condition. With a positive correlation between wind speed and ApCO2 (i.e., high wind speeds at desorbing conditions and low wind speeds
at absorbing conditions) the asymmetry of the EF is further increased and the effect of
chemical enhancement is amplified. A negative correlation between these parameters
decreases or even reverses the EF asymmetry and the effective EF decreases. The effective EF, however, does not increase in every case with a positive correlation. Ifthe effect of increasing kl with increasing wind and ApCO
2is more important than the
effect of chemical enhancement, the effective EF is diminished by the positive correla-tion. In a steady state situation with fixed net influx (as, for example, the natural 14C
case), the general result of chemical enhancement and a positive correlation would be
to decrease the necessary averaged driving force.A prediction of the correlation between wind speed and ApCO2 from first principles is
not possible. Several mechanisms link these two parameters, causing either a positive or negative correlation. A positive correlation between wind speed and ApCO2 on a
local scale and absorbing conditions is caused by a simple feedback mechanism. At a constant CO2 sink term (i.e. CO2 uptake due to biological activity), ApCO2 becomes
increasingly negative with lower wind speeds. On an annual basis, Etcheto et al (1991) reported a minimum wind speed in March and a maximum in October, roughly in phase with the annual ApCO2 cycle which has a minimum in the spring to summer months
augment the local positive correlation. Two factors that support a negative correlation
are: the general negative geographic correlation of higher wind speeds and morenegative ApCO
2values at high latitudes (Etcheto et al (1991)), and the solubility pump
with desorption in the relatively calmer summer months. Although the general
geo-graphic correlation is important, it is unlikely that this effect is dominant. First, it is
based on annually averaged values. Second, two-thirds of the world's oceans are be-tween 400 S and 400 N latitude. Finally, absorbed bomb 14C has maximum values in two symmetric bands located between 300 and 400 North and South (Stuiver (1980))which indicates the importance of the tropical and subtropical latitudes. If the solubility
pump were driving the ApCO2 cycle, the actual measured annual cycles would have amaximum in the summer. As shown above, this is not the case in most of the reported time series.
The actual correlation coefficient on a global scale cannot be evaluated unless wind speed and ApCO2 data are available in much finer resolution. Based on the reported
annual ApCO2 and wind speed cycles, the positive correlating mechanisms seem to be
V. Summary and Conclusions
On the basis of theoretical and experimental arguments, previous authors have
con-cluded that chemical enhancement of CO
2transport across the air-sea interface is
neg-ligible despite contrary evidence from global 1 4C and radon data. I have shown that by
dropping some of the previously used simplifying assumptions, chemical reactions
in-deed can enhance the global flux of C02 significantly. Although the calculations revealsomewhat higher local EF, these predictions are primarily based on considering the effects of nonlinearity and poor data resolution in evaluating the global effects.
Averaging wind speed and ApCO2 data drastically underpredicts the effective EF.
Considering the multiplying effects of changing wind speed and ApCO2 together with
their possible positive correlation, the apparent global EF can be explained. Real con-ditions in the oceans are far more complex than those represented by the assumed dis-tributions of the parameters. Yet these assumptions are arguably more realistic than
past approaches which averaged input parameters.
Unless the uncertainties in the mass transfer models are resolved and the input data de-termined in finer temporal and spatial resolution, the calculation of a global EF is effec-tively an "inverse problem", rather than a prediction from first principles. This inverse problem, however, puts an additional constraint on the calibration of global carbon cy-cles.
Quantifying the ApCO2 distribution in higher resolution is a critical next step for
im-proving the accuracy of future models. Further research on how the spatial and
tem-poral variability of the input parameters (chiefly wind speed and ApC0 2) can be de-scribed, measured and finally incorporated into global carbon cycle models is of thehighest importance.
VL References
Astarita, G., 1983, Gas treating with chemical solvents, Wiley-Interscience, New York Baes, F.B., 1982, Effects of carbon chemistry and biology on atmospheric carbon dioxide, in:
Carbon dioxide review 1982, Ed.: Clark, W.C., Oxford University Press, New York Berger, R. and Libby, W.F., 1969, Equilibration of atmospheric carbon dioxide with sea water:
Possible enzymatic control of the rate, Science, V. 164, pages 1395-1397
Bolin, B., 1960, On the exchange of carbon dioxide between the atmosphere and the sea, Tellus,
V. 12, pages 274-281
Bolin, B., BjOrkstrm, A., Holmen, K. and Moore, B., 1983, The simultaneous use of tracers for ocean circulation studies, Tellus, V.35 B, pages 206-236
Broecker, W.S., Ledwell, J.R., Takahashi, T., Weiss, R., Merlivat, L., Memery, L., Peng, T.-H., Jahne, B. and Munnich, K.O., 1986, Isotopic versus micrometerologic ocean CO2
fluxes: a serious conflict, Journal of Geophysical Research (JGR), V. 91, No. C9, pages 10517-10527
Broecker, W.S. and Peng, T.-H., 1973, Gas exchange rates between air and sea, Tellus, V. 26, No. 1-2, pages 21-35
Broecker, W.S. and Peng, T.-H., 1993, Carbon 13 constraint on fossil fuel CO2 uptake, Global Biochemical Cycles (GBC), V. 7, No. 3, pages 619-626
Broecker, W.S. and Peng, T.-H., 1984, Gas exchange measurements in natural systems, in: Gas transfer at water surfaces, pages 479-493, Reidel Publishing
Broecker, W.S. and Peng, T.-H., 1982, Tracers in the sea, Lamount Doherty Geolocical
Observatory, Columbia University, New York
Broecker, W.S., Peng, T.-H., Ostlund, G. and Stuiver, M., 1985, The distribution of bomb ra-diocarbon in the ocean, JGR, V. 90, No. C9, pages 6953-6970
Broecker, W.S., Takahashi, T., Simpson, H.J. and Peng, T.-H., 1979, Fate of fossil fuel carbon
dioxide and the global carbon budget, Science, V. 206, No. 4417, pages 409-418
Codispoti, L.A., Friederich, G.E., Iverson, R.L. and Hood, D.W., 1982, Temporal changes in the inorganic carbon system of the south-eastern Bering Sea during spring 1980, Nature, V. 296, pages 242-245
Danckwerts, P.V., 1951, Significance of liquid-film coefficients in gas absorption, Industrial
and engineering chemistry, V. 43, No. 6, pages 1460-1467 Danckwerts, P.V., 1970, Gas-liquid reactions, Mc. Graw Hill, New York
Dobbins, W.E., 1955, The nature of the oxygen transfer coefficient in aeration systems, in:
Biological treatment of sewage and industrial wastes, V. 1, Ed. by: McCabe, Rheinold
Duce, R.A., Quinn, J.G., Olney, C.E., Piotrowicz, S.R., Ray, B.J, and Wade, T.L., 1972, En-richment of heavy metals and organic components in the surface microlayer at Nar-ragansett Bay, Rhode Island, Science, V. 176, pages 161-163
Emerson, S., 1975, Chemical enhanced CO2gas exchange in an eutrophic lake - a general model, Limnology and Oceanography (L&O), V. 20, pages 743-753
Erickson, D.J., 1993, A stability dependent theory for air-sea gas exchange, JGR, No. C5, pages 8471-8488
Etcheto, J., Boutin, J., and Merlivat, L., 1991, Seasonal variations of the CO2 exchange
coeffi-cient over the global ocean using satellite wind speed measurements, Tellus, V. 43 B, No. 2, pages 247-255
Glasscock, A.D. and Rochelle, G.T., 1989, Numerical simulation of theories for gas absorption with chemical reaction, AIChE Journal, V. 85, No. 8, pages 1271-1281
Goldman, J.C. and Dennett, M.R., 1983, Carbon dioxide exchange between air and seawater: no evidence for rate catalysis, Science, V. 220, pages 199-201
Harvey, H.W., 1966, The chemistry and fertility of sea waters, Cambridge University Press Holmen, K. and Liss, P., 1984, Models for air water gas transfer, an experimental investigation,
Tellus, V. 36 B, No. 2, pages 92-100
Hoover, T.E. and Berkshire, D.C., 1969, Effects of hydration on carbon dioxide exchange across the air-sea interface, JGR, V. 74, No. 2, pages 456-464
Johnson, K.S., 1982, Carbon dioxide hydration and dehydration kinetics in seawater, L&O,
V. 27, No. 5, pages 849-855
Keeling, C.D., 1968, Carbon dioxide in surface ocean waters, 4. global distribution, JGR, V. 73, pages 4543-4554.
Kempe, S. and Pegler, K., 1991, Sinks and sources of CO2 in coastal seas: the North Sea,
Tellus, V. 43 B, pages 224-235
Kern, D.M., 1960, Hydration of carbon dioxide, Journal of Chemical Education ,V. 37, No. 1, pages 14-23
Lindskog, S., 1980, Rate limiting step in the catalytic action of carbonic anhydrase, in: Bio-physics and physiology of carbon dioxide, Ed: Bauer, B. et al, Springer Verlag, Berlin Lindskog, S., Engberg, P., Forsman, C., Ibrahim, S.A., Johnson, B.-H., Simonsson, I. and
Ti-bell, L., 1984, Kinetics and mechanisms of carbonic anhydrase isoenzymes, in: Tashian
and Emmett, Biology and chemistry of the carbonic anhydrase, The New York
Acad-emy of Sciences, New York
Liss, P.S., 1983, Gas transfer: Experimental and geochemical implications, in: Liss, P.S. and Slinn, W.G.N. (eds.), Air-sea exchange of gases and particles, pages 241-298
Meldon, J.H., Smith, K.A. and Colton, C.K., 1972, An analysis of electrical effects induced by carbon dioxide transport in alkaline solutions, in: Recent development in separation science, Ed. L. Norman, CRC Press, pages 1-10
Memery, L. and Merlivat, L., 1984, The contribution of bubbles to gas transfer across an air-water interface, in: Ocean whitecaps, Ed. Monahan, E.C and Niocaill, G.M,
D. Reidel Publishing Company, pages 95 -100
Miller, R.F., Berkshire, D.C., Kelley, J.J., and Hood, D.W., 1971, Method for determination of reaction rates of carbon dioxide with water and hydroxyl ion in seawater, Environ. Sci.
and Techol. (ES&T), V. 5, No. 2. pages 127-133
Morel, F.M.M. and Hering, J.G., 1993, Principles and applications of aquatic chemistry,
Wiley-Interscience, New York
Nydal, R., 1968, Further investigation on the transfer of radiocarbon in nature, JGR, V. 73, No. 15, pages 3617-3635
Otto, N.C., 1971, The transport of carbon dioxide in bicarbonate solutions: studies of flux augmentation and the properties of carbonic anhydrase, Ph.D. thesis, Chemical Engi-neering, University of Illinois at Urbana-Champaign
Peng, T.-H., Broecker, W.S., Mathieu, G.G. and Li, Y.-H., 1979, Radon evasion rates in the Atlantic and Pacific ocean as determined during the GEOSEC program, JGR, V. 84, No. C5, pages 2471-2486
Press, W.H., Flannery, B.P., Teukolsky, S.A. and Vetterling, W.T., 1990, Numerical recipes, the art of scientific computing (FORTRAN version), Cambridge University Press Quinn, J.A. and Otto, N.C., 1971, Carbon dioxide exchange at the air-sea interface: Flux
aug-mentation by chemical reaction, JGR, V. 76, No. 6, pages 1539-1549
Roberts, P.V. and Diindliker, P.G., 1983, Mass transfer of volatile organic contaminants from aqueous solution to the atmosphere during surface aeration, ES&T, V. 17, No. 8, pages
484-489
Robertson, J.E., Watson, A.J., Langdon, C., Ling, R.D. and Wood, J.W., 1993, Diurnal vari-ation in surface PCO2 and 02 at 600N, 200W in the North Atlantic, Deep Sea
Re-search (DSR) II, V. 40, No. 1/2, pages 409-422
Schwarzenbach, R.P., Gschwend, P.M. and Imboden, D.M., 1993, Environmental organic
chemistry, Wiley-Interscience
Simpson, J.J. and Zirino, A., 1980, Biological control of pH in the Peruvian coastal upwelling area, DSR, V. 27, pages 733-744
Smith, S.V., 1985, Physical, chemical and biological characteristics of C02gas flux across the
air-water interface, Plant Cell and Environment, V. 8, pages 387-398
Stuiver, M., 1980, 1 4C distribution in the Atlantic ocean, JGR, V. 85, pages 2711-2718 Stumm, W. and Morgan, J.J., 1981, Aquatic Chemistry, Wiley-Interscience, New York
Taylor, A. H., Watson, A.J., Ainsworth, M., Robertson, J.E. and Turner, D.R., 1991, A model-ing investigation of the role of phytoplankton in the balance of carbon at the surface of the north Atlantic, GBC, V. 5, No. 2. pages 151-171
Thomas, F., Perigaud, C., Merlivat, L. and Minister, J.-F., 1988, World scale monthly mapping of the C02 ocean atmosphere gas transfer coefficient, Phil. Trans. R. Soc. Lond. A., V.
325, pages 71-83
Trowbridge, P., 1994, Wind speed data obtained from Logan airport, Boston, personal
communication
Wallace, D.W.R. and Wirick, C.D., 1992, Large air-sea fluxes associated with breaking waves, Nature, V. 356, page 694
Watson, A.J., Robinson, C., Robinson, J.E., Williams, P.J. le B. and Fasham, M.J.R., 1991, Spatial variability in the sink for atmospheric carbon dioxide in the North Atlantic, Nature, V. 350, pages 50-53
Westerterp, R.K. and Wijngaarden, R.J., 1992, Principles of chemical reaction engineering, in:
Ullmann's encyclopedia of industrial chemistry, Ed: Elvers,B., Weinheim, V. B 4, pages 5-83
Wheast, R.C. and Lide, D.R. (eds.), 1990, Handbook of chemistry and physics, The Chemical Rubber Co.
Whitman, W.G., 1923, The two-film theory of gas absorption, Chem. Met. Eng., V.29,
pages 146-148
Winn, C.D., Mackenzie, F.T., Carrillo, C.J., Sabine, C.L. and Karl, D.M., 1994, Air-sea ex-change in the north Pacific subtropical gyre, implications for the global carbon budget,
CBC, V. 8, No. 2, pages 157-163
Zlokarnik, M., 1990, Dimensional Analysis, in: Ullmann's encyclopedia of industrial chemistry, Ed: Elvers, B., Weinheim, V. B 1, pages 3.1-3.27
VII. Appendices
Appendix A. Notation
Symbol usage units
[ ]
species concentration
moles*-l = M
{ } species activity M
overbar
averaged parameter
0 exposure time film penetration model s
oko carbon dioxide dissociation fraction dimensionless
al
bicarbonate dissociation fraction
dimensionless
it
2carbonate dissociation fraction
dimensionless
adjusting parameter for oscillation period
dimensionless
jt viscosity kg*m l *s
-P density kg*m-3
X phase shift s
A area m2
activityA
ratio of active enzyme at pertinent pH
dimensionless
Alk total alkalinity eq*l-1
Bt
total borate concentration
M
ci concentration of species i M
ct total inorganic carbon M
Da
Damkohler number
dimensionless
ApCO2 difference in partial pressure of CO?, atm
EF
enhancement factor
dimensionless
[Ej]
total concentration of enzyme CA
M
Fi flux of species i (negative values imply absorption) moles*m-2*s
-'K
1apparent first carbon dissociation constant
M
k14
kinetic constant for CO
2hydration, OH- pathway
Mol-s
-1K
9apparent second carbon dissociation constant
M
k
41kinetic constant for CO? dehydration, OH- pathway
s
-1 'KRapparent borate dissociation constant
M
'KA
apparent carbonic anhydrase dissociation constant
M
km,,
kinetic constant for CO? hydration, HO pathway
s
-1 kdJhvardehydration rate constant, CA pathway
s-1
kHucra
kinetic constant for CO
2dehydration, H20 pathway
M-ls-'K
apparent
Henry's
law constant
M*atm-1
kh~vrd,, CA hydration rate constant, CA pathway -1 k mass transfer coefficient, "piston velocity" m*s-l KMUm Michaelis-Menten half saturation constant Mpseudo-first-order rate constant
s-1
__Kw____
.thermodynamic
water dissociation constant
M
2'Kw
apparent water dissociation constant
M
2np number of passages dimensionless
pH
negative logn of {H}
r
parameter for analytical approximation of EF
m-1
s surface renewal rate in Danckwerts' model s-1
Sc Schmidt number dimensionless
t time s
T
temperature
OC
u10 wind speed in 10 m height m*s-1
x space coordinate m
z laminar layer thickness m
Zeq hypothetical laminar layer thickness with the same m piston velocity as the film penetration model
Appendix B. Constants and interpolation methods
Constant
Value
Source
- log ('K )
6.0
Stumm and Morgan (1981)1
-
log ('K?)
9.1
Stumm and Morgan (1981)
- log ('Kh)
8.7
Stumm and Morgan (1981)
-log ('KCA
-7.5Lindskog (1984)
- log ('K
1,
1.53
Stumm and Morgan (1981)
- log ('Kw)
13.7
Stumm and Morgan (1981)
Alk 2.47E-3 eq/1 Stumm and Morgan (1981)
B
t4.1E-4 M
Stumm and Morgan (1981)
oDnr~ 1.94 E-9 m2*s-1 Meldon (1972)
_DtO
0.94 E-9 m
2*s-
1Meldon (1972)2
DashoA 0.94 E-9 m2*s-1 Meldon (1972)
kl
4*K
w1.7E-10
Miller et al (1971) and
Johnson (1982)
kc=
0.03 s-1
Kern (1960)
khvyr-my A _
7.08 E5 s
1Lindskog (1984)
_ _KMM40E-3 M
Lindskog (1984)
The EF is very sensitive to the kinetic and equilibrium constants, which are only known within a certain degree of accuracy. The increase of the EF with increasing pH is
caused by the greater reaction rate of the hydroxyl pathway which becomes rate
de-IAll calculations in this thesis refer to 250 C and standard pressure, unless otherwise specified.
2We assumed equal diffusivities for the charged species to eliminate the potential term in the