Publisher’s version / Version de l'éditeur:
Vous avez des questions? Nous pouvons vous aider. Pour communiquer directement avec un auteur, consultez la première page de la revue dans laquelle son article a été publié afin de trouver ses coordonnées. Si vous n’arrivez pas à les repérer, communiquez avec nous à [email protected].
Questions? Contact the NRC Publications Archive team at
[email protected]. If you wish to email the authors directly, please see the first page of the publication for their contact information.
https://publications-cnrc.canada.ca/fra/droits
L’accès à ce site Web et l’utilisation de son contenu sont assujettis aux conditions présentées dans le site LISEZ CES CONDITIONS ATTENTIVEMENT AVANT D’UTILISER CE SITE WEB.
Internal Report (National Research Council of Canada. Institute for Research in
Construction), 1987-11
READ THESE TERMS AND CONDITIONS CAREFULLY BEFORE USING THIS WEBSITE.
https://nrc-publications.canada.ca/eng/copyright
NRC Publications Archive Record / Notice des Archives des publications du CNRC :
https://nrc-publications.canada.ca/eng/view/object/?id=792ce66a-7e64-4f35-82f4-d7144f711b40 https://publications-cnrc.canada.ca/fra/voir/objet/?id=792ce66a-7e64-4f35-82f4-d7144f711b40
NRC Publications Archive
Archives des publications du CNRC
For the publisher’s version, please access the DOI link below./ Pour consulter la version de l’éditeur, utilisez le lien DOI ci-dessous.
https://doi.org/10.4224/20358600
Access and use of this website and the material on it are subject to the Terms and Conditions set forth at
Statistics of building fires: availability and use
Kim, A. K.
c . 2
B L
DG. National Research Conseil nationalI*
Council Canada de recherche* CanadaInstitute for lnstitut de Research in recherche en Construction construction
STATISTICS
OF
BUILDING FIRE
AVAILABILITY AND USE
A.K. Kim
Internal
Report No.
562
Date of issue: November 1987
ANALYZED
This is an internal report of the Institute for Research in Construction. Although not intended for general distribution, it
may
be cited as a reference in other publications.STATISTICS OF BUILDING FIRES: AVAILABILITY AND USE
by A. K. Kim
INTRODUCTION
Each year in Canada, building fires cause hundreds of deaths, thousands of injuries and hundreds of millions of dollars worth of property damage. The Canadian fire death rate is, unfortunately, among the highest in the industrialized world. To develop effective ways to prevent fires and reduce fire losses, a continuing study of the magnitude and characteristics of the fire problem is required. Experience shows, however, that the available statistical information is not used to its fullest potential.
This paper will examine the present fire data collection system and the types of data collected on building fires, to determine if they are adequate for use by fire researchers, code writers and the fire services.
Recommendations to improve the collection system will be made.
FIRE DATA COLLECTION SYSTEM
System in Canada
In Canada, fire incident data are collected by fire departments using specifically-prepared report forms. The reports are submitted to the provincial fire marshals' or commissioners' office. Information on each
source of ignition, etc.). The fire authority completing the report refers to the fire statistics reporting manual to determine the most appropriate code. In many provinces, information from the fire report is stored in computer files for ready access.
In all provinces, except Saskatchewan and New Brunswick, it is mandatory for local fire departments to report the fire data to the provincial Fire Marshal's or Commissioner's office. But, even in
Saskatchewan and New Brunswick, all local fire departments cooperate with the provincial authority in collecting fire data. Whenever there is a claim, insurance companies in all provinces are also required to report the fire incident to the provincial fire authority.
Prior to 1958, each province had its own fire data reporting system. The lack of uniformity presented considerable confusion in the collection of national data. In 1958, the Association of Canadian Fire Marshals and Fire Commissioners (ACFM6FC) introduced a uniform fire data collection system entitled the Canadian Code Structure on Fire Statistics (CCSFS); all provinces and territories accepted it as a basis for their system. The CCSFS was modified several times and its present version was accepted in
1980. At present, all provinces and territories follow, to some extent, the recommended uniform fire data collection system, yet, there are some
differences in the details.
In collecting fire data, all provinces and territories generally use two forms: a fire incident report form and a casualty report form. The
c a s u a l t y form, i n which d e a t h s and i n j u r i e s a r e r e p o r t e d , i s g e n e r a l l y t h e same f o r a l l p r o v i n c e s . On t h e o t h e r hand, t h e t y p e s of f i r e i n c i d e n t d a t a c o l l e c t e d may v a r y from p r o v i n c e t o province. Some p r o v i n c e s ( s u c h a s A l b e r t a and B.C.) c o l l e c t e x t e n s i v e f i r e d a t a c o v e r i n g a wide range of t h e f i r e i n c i d e n t c a t e g o r i e s , w h i l e o t h e r s c o l l e c t o n l y some b a s i c d a t a u s i n g a few c a t e g o r i e s of t h e recommended CCSFS. Sample c o p i e s of t h e F i r e
Reporting and F i r e C a s u a l t y Reporting forms, used i n t h e p r o v i n c e of A l b e r t a a r e shown i n Appendix A.
Each p r o v i n c i a l F i r e M a r s h a l ' s o f f i c e compiles and p u b l i s h e s some o f t h e c o l l e c t e d d a t a , and submits a n n u a l l y a summary form t o t h e O f f i c e of t h e F i r e Commissioner of Canada (OFCC), which i s r e s p o n s i b l e f o r f i r e
p r e v e n t i o n , f i r e i n s p e c t i o n and f i r e i n v e s t i g a t i o n on Government of Canada p r o p e r t i e s , e x c l u d i n g N a t i o n a l Defence p r o p e r t i e s . This o f f i c e i n t u r n p u b l i s h e s a n a n n u a l composite r e p o r t on f i r e l o s s e s f o r t h e whole of Canada. The OFCC i s , however, n o t r e s p o n s i b l e f o r c o l l e c t i n g and p u b l i s h i n g t h e a n n u a l composite f i r e d a t a r e p o r t , and i t i s n o t mandatory f o r p r o v i n c i a l F i r e Marshals t o submit t h e i r f i r e d a t a t o t h e OFCC. P r e s e n t l y , t h e composite f i r e d a t a a r e c o l l e c t e d and p u b l i s h e d f o r t h e b e n e f i t of t h e g e n e r a l p u b l i c , e s p e c i a l l y t h e f i r e s e r v i c e s , by t h e v o l u n t a r y c o o p e r a t i o n
of t h e p r o v i n c e s , t e r r i t o r i e s and OFCC.
System i n t h e U.S.A.
I n t h e U.S.A., t h e N a t i o n a l F i r e Data Center of t h e F e d e r a l Emergency Management Agency (FEMA) compiles and p u b l i s h e s f i r e s t a t i s t i c s . To improve
uniformity in fire incident reporting, in 1978 FEMA established the National Fire Incident Reporting System (NFIRS), which provides a basis for
collecting data by fire scenario and property use. The categories of data used in NFIRS are selected from the National Fire Protection Association
(NFPA) Standard 901 "Uniform Coding for Fire Protection". NFIRS collects information on this uniform set of key data elements using standardized terminology. At present, approximately three-fourths of all states are voluntarily involved in NFIRS. Local fire departments in each of the participating states submit the incident reports to the respective State
fire authority, and the state authority sends an annual report on fire losses to NFIRS. NFIRS compiles and analyzes the fire data received and then extrapolates those data to estimate the annual fire losses in the United States. It is the only data base in the U.S.A. capable of
addressing national patterns for fires of all sizes by specific fire cause.
Information on large fires (property loss of $ 1 million or more) or fires with multiple deaths (3 or more) is also compiled in the Fire Incident Data Organization (FIDO) of NFPA, a computerized data bank. In addition, FIDO deals with a selection of smaller fires as technical interests dictate. The strength of FIDO is its depth of details on individual incidents. Since
1977, NFPA has also been involved in the National Fire Survey, which sends fire survey forms to a random sample of approximately 3000 local fire
departments (one-tenth of the fire departments in the U.S.A.), and receives data from those departments on all fire incidents. Once a year, NFPA
provides the service of analyzing and providing fire statistics in requested categories for a fee.
System in the United Kingdom
In the U.K., the Home Office compiles and publishes the statistics on fires attended and reported on by local fire brigades. The fire statsitcs published by the Home Office do not include other fires, for example, those in which no call was made to the service or those which were attended only by workers' fire brigades. Information on fires involving large financial losses is collected by the Fire Protection Association. The British
Insurance Association also publishes general information on financial losses f rom fires.
NEEDS FOR FIRE STATISTICS
In developing programs for fire research, evaluating fire service practices and assessing the need for changes to building codes, there is a great need of statistical data on building fires.
A
good fire research program should be potentially "cost-effective" in terms of lives saved and property protected. To meet this objective,statistical information on the characteristics of fires, the nature and extent of damage, the effectiveness of fire prevention method, and efficacy of fire fighting procedures is required.
Fire statistics provide the fire services with information to indicate trends, to evaluate the effectiveness of fire prevention and suppression measures, to assess the impact of new methods, and to indicate those areas that may require further attention.
For code writers, fire statistics are needed for fire risk assessment, to provide the information on areas where a fire hazard exists and to
quantify the effectiveness of the fire protection measures. Fire statistics also assist code writers in assessing the code requirements against real fire experience.
At present, fire statistics are seldom utilized to their full potential
.
by fire researchers and the writers of building and fire codes. The primary reason seems to be a lack of published data on many specific subjects. Some of the provinces do collect extensive fire data, but they are insufficiently broken down and are not published in a way demanded by practice.
Discussions with fire researchers and building code writers revealed that more detailed data would be needed than those presently published in the general fire statistics. For example, the following data are in great demand :
-
fires reaching flashover and losses associated with them,-
causes of fire deaths and injuries,-
performance of fire detection and fire suppression systems,-
effectiveness of fire doors and other rated closures,-
effectiveness of the fire fighting procedures used by fire services*,-
effect of plastic building components on building fires and on fire fighting techniques*,-
effectiveness of a building's fire safety plan*,-
fires in electrical rooms,-
incidents of structural failure during fires, and-
fires during power failure.Data on most of the above subjects have already been collected in many provinces by the present data collection system, but, even in those
provinces, they are not published. Also, a few of the provinces do not analyze the collected data thoroughly, and the data are not stored in a computer file for ready access.
Among the above subjects, information on those which are marked with an asterisk could be more effectively obtained from fire departments than from general data banks, because they are difficult to put in a form suitable for a questionnaire.
THE USE OF STATISTICS ON BUILDING FIRES
Even though the published Canadian fire statistics are not detailed enough for technical use, they are useful in showing general trends in fire incidents, fire losses and fire casualties. For example, one can see that
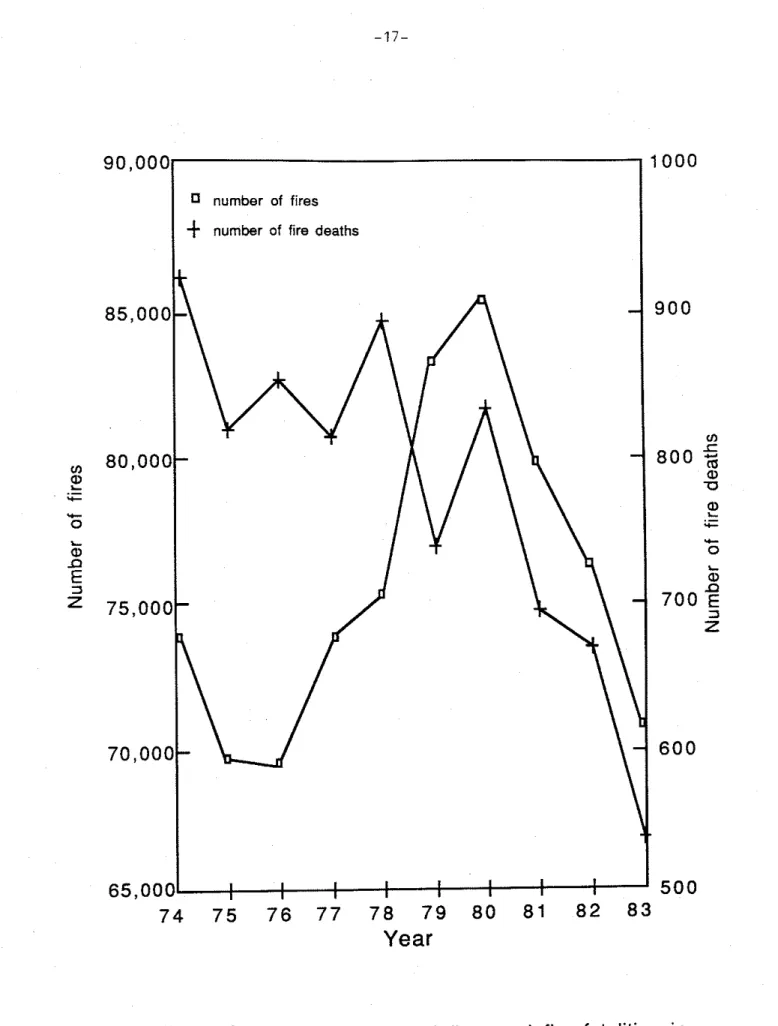
according to "Fire Losses in Canada, 1983" there were 70,953 reported fires, resulting in $815 million property loss, 4,008 injuries and 539 deaths, significantly less than in 1982. Fire statistics over the last 10 years show that the annual number of fires did not change much between 1974 and
1983, but fire deaths were substantially reduced (Fig. 1). There was a drop of 40% in fire deaths between 1974 and 1983, even though the population increased by 11%. This impressive decrease is probably due in part to recent home fire safety efforts, including the installation of smoke
detectors in residential properties. Fire losses could further be reduced by concentrating fire prevention efforts on those problems that cause most of the losses. Over the last 10 years, approximately 50% of all Canadian fires, including outdoor fires, have occurred in the "Residential"
properties. When only building fires are considered, residential fires account for 80% of all fires. In 1983, there were 34,517 fires, or 49% of the total fires, in this occupancy group resulting in 488 deaths: 90% of the nation's fire fatalities. This finding indicates that home fire safety still remains the key to any major improvement in the overall fire death picture.
The published fire statistics in Canada are for general information only. However, more detailed information on fire is stored in computer files in a few provinces and it can be obtained from the provincial
authorities upon request. Some of the statistical data of interest to fire researchers and code writers are included in those files. Unfortunately, these data do not reveal national trends. Yet, the provincial fire data,
even with a small data base, can sometimes give an insight into some unusual fire problems.
One of the subjects on which fire data are needed is pre-flashover and post-flashover fires and losses associated with them. Such data were
obtained from three provinces (Alberta, British Columbia and Manitoba) for 1983 and 1984 and are shown in Table l(a). The statistics show that more than 60% of all fires were confined to the room of fire origin. It also shows that the property losses and deaths for the cases where the fire was confined to the room of origin are generally less than 15% of the total. In contrast, almost 60% of fire deaths occurred in fires in which the entire building was involved. This finding indicates the importance of the
detection and control of a fire at an early stage and of confining the fire to the room of its origin.
Another subject of interest is the cause of fire casualties. Data on this subject were obtained from four provinces and are shown in Table l(b). It shows that the largest percentage of fire deaths occurred while the victims were asleep. This suggests that with properly installed and functioning smoke detectors, many of these victims could have been saved.
Statistics on the performance of fire detection systems are of interest to many people. Some data on smoke detector performance in British Columbia for 1984 and 1985 are shown in Table l(c). In 1985, approximately 56% of fires occurred in buildings with no smoke detectors. This percentage is perhaps high, because many fires in dwellings with smoke detectors may have
been d e t e c t e d and e x t i n g u i s h e d a t a n e a r l y enough s t a g e , s o t h a t t h e o c c u p a n t s d i d n o t f e e l t h e need t o r e p o r t them t o t h e f i r e department.
Among t h e f i r e i n c i d e n t s i n d w e l l i n g s w i t h smoke d e t e c t o r s , i n o n l y 51% d i d t h e smoke d e t e c t o r f u n c t i o n p r o p e r l y . The r e a s o n f o r smoke d e t e c t o r f a i l u r e v a r i e d from removal of b a t t e r i e s t o improper l o c a t i o n w i t h i n t h e d w e l l i n g u n i t .
F i r e r e s e a r c h e r s and code w r i t e r s need i n f o r m a t i o n on t h e mechanisms o f v e r t i c a l and h o r i z o n t a l f i r e spread. Data on v e r t i c a l and h o r i z o n t a l f l a m e s p r e a d were o b t a i n e d from A l b e r t a and Manitoba f o r 1983 and 1984 and a r e shown i n T a b l e s I ( d ) and l ( e ) , r e s p e c t i v e l y . Table l ( d ) shows t h a t among t h e known avenues of v e r t i c a l f i r e s p r e a d , i n a d e q u a t e f i r e s t o p p i n g and t h e b u i l d i n g e x t e r i o r a r e t h e two most common. According t o Table l ( e ) ,
h o r i z o n t a l f i r e s p r e a d o c c u r s more commonly t h r o u g h concealed c e i l i n g and a t t i c s p a c e s t h a n t h r o u g h any o t h e r known avenues.
I n i t i a l d e t e c t i o n of f i r e i s a n o t h e r s u b j e c t of i n t e r e s t . Table l ( f ) shows f i r e s t a t i s t i c s on i n i t i a l d e t e c t i o n of f i r e s and l o s s e s a s s o c i a t e d w i t h them. The most common means of f i r e d e t e c t i o n i s by p e r s o n a l
d e t e c t i o n . The t a b l e a l s o shows t h a t i n t h e c a s e s where f i r e d e t e c t i o n i s by smoke d e t e c t o r s o r a u t o m a t i c s p r i n k l e r s , t h e p r o p e r t y l o s s p e r f i r e i s much lower t h a n t h e a v e r a g e l o s s , probably because f i r e s o f t e n s t a r t i n remote l o c a t i o n s o r a t h o u r s when no one i s p r e s e n t . I n s u c h c a s e s f i r e d e t e c t i o n by t h e a u t o m a t i c d e t e c t i o n system i s much f a s t e r t h a n p e r s o n a l d e t e c t i o n . Unless a p e r s o n i s p r e s e n t i n t h e immediate a r e a of a f i r e , p e r s o n a l d e t e c t i o n i s d e l a y e d u n t i l t h e f i r e i s i n a n advanced s t a g e , and
thus larger property damage and higher fire fatality will result. It is interesting to note, however, that the number of injuries per incident in fires detected by an automatic system is slightly higher than the average, even though property losses and fire deaths are much lower. A possible explanation is that detectors may reveal an incipient fire that the occupant may try to fight, and suffer injuries that he probably would not have
suffered with a larger, more unmanageable fire.
One may also acquire data on various other subjects (such as source of ignition, action taken to combat the fire, fire service response time and method of fire control by the fire service) from the office of the
provincial fire commissioners in Alberta, British Columbia and Manitoba.
SUMMARY
AND
RECOMMENDATIONSThe need for fire statistics required for the analysis of fire problems was examined. Also, the present data collection system in Canada, U.S.A.
and U.K., and the types of data collected on building fires were studied to
determine if they are adequate for fire researchers, code writers, and the fire services with respect to indicating trends, measuring the effectiveness of fire prevention and fire suppression, evaluating the impact of new safety measures, and pointing to those areas that require further attention.
At present, in Canada, the Canadian Code Structure on Fire Statistics (CCSFS) includes many categories which would give helpful information for solving fire problems. However, there are still other subjects of interest
(such as roof collapse during fires, fire incidents during power failure, and electrical room fires) which are not covered in the CCSFS surveys. Furthermore, some of the present CCSFS categories contain too many
classifications which are unnecessary and make the system difficult to use.
Even though all provinces and territories more or less follow the recommended uniform fire data collection system (CCSFS), the degree of adaptation differs. Among provinces, Alberta collects the most detailed data, using almost all the categories recommended by the CCSFS. Other provinces collect data only in a limited number of the categories of the CCSFS. Some provinces use different coding numbers or slightly different terminology.
To make fire data more useful, the following steps are recommended:
1. The CCSFS should be continuously upgraded, to include subjects of interest to fire researchers, fire services and code writers.
2. All provinces should collect fire data in the same categories, preferably in all the categories recommended by the CCSFS.
3. The report form should be clearly structured and use uniform definitions and terminology.
4 . The report form should be made as simple as possible.
5. The commitment of all participants to report conscientiously should be emphasized.
6. The reported data should be compiled in a computer file for easy access.
,1 . I . I,..
.~:
.
::
.
,.,, , ...,.:..
:..
.,.,""d," .,.d,,,.", .,07",,, $0 t<"",,,< -< ,,,,C.,," ,V,V,,,3.2 .,%,b,7f, " 9 . ,'~.!"d, 1 3 ,
2 0
1NOHd333i . 3 1 < WOOU NvlOiH3W 3 5 N W 8 dn'. 3 3 5
0
1'1NYU3 1VWI3 1st I l i B l > l l d d l ,is 1.11,1 n h rlMs I N J O I 3 M 1 03118n330 1W301 ) Y I 3tl3*&? ~it'v~:di?~k"~\ 3Vll
1 V n N V W l H O d 3 H 3813 3 H I 3 N I S n w 8 0 3 S l H l 3 1 3 l d W 0 3
. ~
-
,,. .. i i l l T
c,.,...,
:- 1...
, I * < >, ',,.,
(13L1V ONV 15318015 NII IHL)I3H r 3 N V e 7 3 J O tlOTVW SSV13 A i U 3 d O S d
I
I
I m N v W 1 u O d 3 e 31113 3 i l Ni 533w 01 11313" M O l 3 B SLi38WnN 03LI
D O N S3A i l N 3 W l 8 V d 3 0 3 H I 3 l V d l 3 1 N n W 3 H 1 01 0 3 1 U O d 3 U 3M1-1 3 H l S V M
1 1 1 / I 1 1 1
A10 SOSN32 ON NO1I'IIIIIS3?,NI
A ~ N O 3 s n ~ 1 1 3 - 1 0 8 0 3 (91 !430NfllOil-3 SY1V30 191 8 3 0 h n i O l l H 3 S318"TNI
T I JJ w n o d IWOd38 ~ 1 ' 1 v n s w 3 3.13 v 3 1 3 ? d A 0 3 0 3 t l U n 3 3 0 S H I V ~ O 80 S ~ ~ V ~ T N I 11 7-101
1 1 ( 1 1 1 1
L13iS"TOV AIt7Vdl31NnA 6 0 N 3 W N31107iU3 ..3i%OM N 3 W ' v 1 0 1 N3LlO?lY3 W3WOMA SiF;~i?.lTC XCPCRT S i l A l L I : i S i l U I I I f I E D FOR EACH FIRE CASUALIY I D E A l H OR INJURY)
I A R O U I I
i , ~ nrr/ic ,.rrri. s ~ s v < t < s orvcslon
,,RE Y * c V t N l l o n Bil&r.I *
I -101 10808 99 rWt
FlRE CASUALTY REPORT
r l R t MUUBTR s u r ~ t r:
t D U O l l r O N AIBLYIA 7 % OG2DATE OF FIRE DAY
MONTHI
//
II
1
DAY OF/ /
8 I SATURDAY SUNOAVI 1-
1
I
INVESII'IITIOIIr
MOI
S U R N A M ENAME OF VICTIM INiTlAiS
1 1 1 1 1 l 1 1 1 1 ~ 1 I ~I I ~
I m m
I DEATH 2 hliNOR lNJURI 1 SIRETkGHTER
NATURE OF CASUALTY
(
I
3 LlGHT INJURY 1 SERIOUS l N J U R ICOMPLETE THIS FORM USING THE FlRE REPORT M A N U A L
1
I I I I IIs10l:l
WHERE NECESSARY CHOOSE APPROPRIATE CODE A N D PLACE I N SPACES PROVIDED
w
CONDITION OF CASUALTY LOCATION OF FIREI I - Asleep ai ,*me of fcre
12 - Bedridden or other phrsical hand~cap
13 - lmpamrment by alcohol drugs or rnedlcallon
14 - wake and no phrslcal or mental impairment at m e lime of fire
15
-
Under ie5,ra*o, 0, delenoon16 - Too young 10 r e a c t $ 0 Itre emergency
1 7
-
Menlal handicap isenllel. 18 - Left unal(ended Ich8ldren)
1 9 - Condc?,on of casualty unclarslfred
1 0
-
Condifmon of casualty unknownI
w
TYPE OF FABRIC OR MATERIALNOTE I( c a ~ u a i l y a s ~ h v x i a l e d cade under N o t ApDi#cable. cade 4 0
I
41 - Cotton
42 -Wool
43 - Oihet natural ltbre
4 5 - Orher rynlhelrc lsbre
4 6 -Mixture of fibres 47 R u b b e r
4 8 - P I ~ S I I C or PI~LIIF foam
4 9 -Type of Fabrtc or Materm1 lgnaled unclarrrfied
4 0 - ~~~e of Fabrac or ~ a r e r l a l lgnated not appllcable
/
w
ACTION OF CASUALTYw
CAUSE OF FAILURE TO ESCAPEI
21 - inlured wnmie attempting l a escape
22 . ~ ~ e i e x e r t ~ o o . heart attack
23 - Volunrar$ly entered ar rernnloed for rescue purposes
24 . voivntarlly entered or rematned lor f ~ r e l ~ g n ! ~ n g 25 - v ~ l ~ n t a r t ~ y entered or remamed to save personal property
26 - LOSS of ludgment or panic
2 7 ~ e c e ~ ~ e d d e t a ~ e d warnmg
28 -. o l d noiacl
29 - A c t ~ o n of c a ~ u a l l y unclasrtf~ed
2 0 - Actban o l casually . unknown
w
IGNITION OF CLOTHING OR OTHER FABRICSNOTE If Caruallv a s ~ h y i s a f e d Code under "Not Applicable". code 3 0
31 - Outer clalhlng
32 - Sleepwear
33 - Underclolhlng
34 - Coslume
35 - Beddlng or bed linen
36 ~ M a t t r e s s or ptllow
37 Upholrlerad l u r n l l v r e
3 8 Rvgr
30 !ynl!lorr "t ctothlng <rr Otllcr ~ a b t j c r ~ ~ n c l a r r ~ l ~ d 30 ig69~llon 14 C l ~ ~ t h s n q la Ollll?r F.obrlc\ *lo# .11>1,l1~dbl*
51 -rrapped by rapid spreading of fore smoke through vertical
openings rlasrways eleualors
52 - irapped by r a v ~ d rpreadxng d f~rezrrnoke ~ n r o u g h harlzonral
Oprnlng*
53 - M q h llame S p r e a d o f c o m b u ~ l ~ b l e lnlerlor f,n,rh o l walls cell,ngl
or fl00IL
5 4 - Bumldnng collapse
5 5 - Fallmng debrls
56 - Explorton
57 - E.S! blocked locked of obrtructed
58 -Outdoor fcre ~ n c l ~ d e r forest brush Inter
5 9 - Cause 01 Failure to EscaDe unclass818ed
5 0 - Cause of Fablure lo Escape unknown
Figure
1.
Annual number of fires and fire fatalities in
Canada over the last
10
years.
90,000
-
900
V) V) a,??
-
-0 +-
0 L a,n
E
375,000-
65,000-
I I I I I I I I 1 I I I I I 1 I500
74 75 76 77 78 79
80 81
82 83
Year
number of f~res$
number of fire deathsTable l ( a )
E x t e n t of Fire/Damage (Combined F i r e Data from A l b e r t a , B.C., and ~ a n i t o b a )
(I)
1983 Confined t o o b j e c t of o r i g i n Confined t o p a r t of room of o r i g i n Confined t o room of o r i g i n Confined t o f l o o r a r e a of o r i g i n Confined t o b u i l d i n g of o r i g i n Extended beyond b u i l d i n g of o r i g i n O t h e r s TOTAL-
# of f i r e s 3226 3222 1177 614 2549 430 708 11966 > X of t o t a l 1.4 4.1 8.1 11.5 62.2 12.2 0.7 100.0 X of t o t a l 27.3 26.9 9.9 5.1 21.3 3.6 5.9 100.0 f i r e i n j u r y 89 190 116 78 249 46 20 788Z
of t o t a l 2.6 6.1 5.0 5.2 67.4 11.3 2.4 100.0 p r o p e r t y l o s s 6,745,000 15,584,000 12,775,000 13,368,000 173,415,000 29,067,000 6,200,000 257,154,000 Confined t o o b j e c t of o r i g i n Confined t o p a r t of room of o r i g i n Confined t o room of o r i g i n Confined t o f l o o r a r e a of o r i g i n Confined t o b u i l d i n g of o r i g i n Extended beyond b u i l d i n g of o r i g i n Others TOTAL p r o p e r t y l o s s 4,268,000 13,872.000 14,175,000 18,403,000 134,541,000 25,684,000 6,757,000 217,700,000 X of t o t a l 11.3 24.1 14.7 9.9 31.6 5.8 2.5 100.0 f i r e d e a t h 2 6 12 17 92 18 1 148I
of f i r e s 3085 2940 1048 557 2694 469 893 11686 X of t o t a l 2.0 6.4 6.5 8.4 61.8 11.83.1
100.0 X of t o t a l 26.4 25.1 9.0 4.8 23.1 4.0 7.6 100.0 f i r e i n j u r y 108 199 161 124 272 74 18 956 X of t o t a l 11.3 20.8 16.8 13.0 28.5 7.7 1.9 100.0 f i r e d e a t h 3 16 24 13 106 141
177 X of t o t a l 1.7 9.0 13.6 7.3 59.9 7.9 0.6 100.0Table &(b)
Condition of Fire Casualty (Combined Fire Data from Alberta, B.C., Manitoba and Saskatchewan)
(I)
1983injury total death total
-
Asleep at the time of Eire 153 17.8 49 27.8
Bedridden or other physical handicap 7 0.8 6 3.4
Impairment by alcohol or drugs 51 5.9 34 19.3
Under restraint or deteation 0 0.0 0 0.0
Mental handicap (senile) 2 0.2 4 2.3
Left unattended (children) 18 2.1 14 8.0
Others 627 73.1 69 39.2
TOTAL 858 100.0 176 100.0
L
Asleep at the time of fire
Bedridden or other physical handicap Impairment by alcohol or drugs
Under restraint or detention Mental handicap (senile) Left unattended (children) Others TOTAL fire injury 145 4 56 1 0 21 767 994 % o f total 14.6 0.4 5.6 0.1 0.0 2.1 77.2 100.0 fire death 86 7 40 0 1 14 61 209 % o f total 41.1 3.3 19.1 0.0 0.5 6.7 29.2 100.0
- N O P - O - O
.
. . .
0 0 0 0 0 0 0 0 09
O* 9 O, a r l a w r l c n D . 4 m 424 0.4- a 0 G u w m o d a n a u C m d u m a W C l O ~ ~ a d m I0 1 8 8 : g g
d U W l I l t o n o a C U C U W W W W Y a m m a a a c u I u > u u u u a a J r l m m m m w Y U > > > > C C U d d d d o a a 6 U U L I Y d Y U U U U U O~emmamzid
a m u u u u m E uri o o o o m o o W 4 Z Z Z Z O Z ~ G o x a d u b 4 u a a m u r l U U d A o m m d-4,-5
u a 0 a 4 a w r r c a a r l m m * O d D m U C u w m w d a n a u c m d u m a w c a o s m a d w U aS Z 8 Z g g
d u w l l t l O U u a e o E U W V U W Y a m a a a a c u I u > u u u u a w d m m m m w u u > > > > c C U d . . l d d 0 a C I e O u U U U d Y U o u U u O Z E m m m m m e , u w - a m u u u u m F u.4 0 0 0 0 n o c W d Z Z Z Z O Z Cw P a M a l B r l Y c a m a 0 4.d w a a w a l rl a rl o a
*
5
: e ,
Z U
e
0 U O 4 W C I m m ~m 0 m ",m u * u u U W W h O X E U 4 C 4 0 4 - 4 ~~~~~~3 w a e ' 3 5 m m a a a w L . 1 o u ~ . a o a o w 4 L. 0
*
W C r s 0 C C U O c a c r o cTable l(f)
Initial Detection (Combined Fire Data from Alberta and B.C.)
(I) 1983
Smoke alarmldetector Heat alarm/detector
Automatic sprinkler system
Automatic system
-
other thansprinkler
Visual sighting or other means of personal detection Others
TOTAL
C
of fires 517 86 90 16 7235 468 8412 fire injury 53 8 4 1 532 6 604 Smoke alarmldetector Heat alarmldetectorAutomatic sprinkler system
Automatic system
-
other thansprinkler
Visual sighting or other means of
% of total 6.1 1.0 1.1 0.2 86.0 5.6 100.0 % of total 6.3 0.8 0.8 0.2