HAL Id: hal-00946159
https://hal.archives-ouvertes.fr/hal-00946159
Submitted on 13 Feb 2014
HAL is a multi-disciplinary open access
archive for the deposit and dissemination of
sci-entific research documents, whether they are
pub-lished or not. The documents may come from
teaching and research institutions in France or
abroad, or from public or private research centers.
L’archive ouverte pluridisciplinaire HAL, est
destinée au dépôt et à la diffusion de documents
scientifiques de niveau recherche, publiés ou non,
émanant des établissements d’enseignement et de
recherche français ou étrangers, des laboratoires
publics ou privés.
Effect of rising motion on the damped shape oscillations
of drops and bubbles
Benjamin Lalanne, Sébastien Tanguy, Frédéric Risso
To cite this version:
Benjamin Lalanne, Sébastien Tanguy, Frédéric Risso. Effect of rising motion on the damped shape
oscillations of drops and bubbles. Physics of Fluids, American Institute of Physics, 2013, vol. 25, pp.
1-22. �10.1063/1.4829366�. �hal-00946159�
To link to this article : DOI: 10.1063/1.4829366
http://doi.wiley.com/10.1063/1.4829366
To cite this version: Lalanne, Benjamin and Tanguy, Sébastien and Risso,
Frédéric Effect of rising motion on the damped shape oscillations of drops
and bubbles. (2013) Physics of Fluids, vol. 25 (n° 112107). pp. 1-22. ISSN
1070-6631
This is an author-deposited version published in:
http://oatao.univ-toulouse.fr/
Eprints ID : 10913
Any correspondance concerning this service should be sent to the repository
administrator:
staff-oatao@listes-diff.inp-toulouse.fr
Effect of rising motion on the damped shape oscillations
of drops and bubbles
Benjamin Lalanne, S ´ebastien Tanguy, and Fr ´ed ´eric Risso
Institut de M´ecanique des Fluides de Toulouse, CNRS & Universit´e de Toulouse, Toulouse, France
The objective of this work is to determine the effect of the rising motion on the dynamics of inertial shape oscillations of drops and bubbles. We have carried out axisymmetric direct numerical simulations of an ascending drop (or bubble) using a level-set method. The drop is initially elongated in the vertical direction and therefore performs shape oscillations. The analysis is based on the decomposition of the inter-face into spherical harmonics, the time evolutions of which are processed to obtain the frequency and the damping rate of the oscillations. As the drop accelerates, its shape flattens and oscillations no longer take place around a spherical equilibrium shape. This causes the eigenmode of oscillations to change, which results in the ap-pearance of spherical harmonics of high order that all oscillate at the same frequency. For both drops and bubbles, the frequency, which remains controlled by the potential flow, slightly decreases with the rising velocity. The damping rate of drops, which is controlled by the dissipation within boundary layers at the interface, strongly in-creases with the rising velocity. At terminal velocity, the damping rate of bubbles, which results from the dissipation by the potential flow associated with the oscillating motion, remains close to that of a non-rising bubble. During the transient, the rate of deformation of the equilibrium shape of bubbles can be comparable to the oscillation frequency, which causes complex evolutions of the shape. These results extend the description of shape oscillations to common situations where gravity plays a role. In particular, the present conclusions are useful to interpret experimental results where the effect of the rising motion is often combined with that of surfactant.
I. INTRODUCTION
The size of drops (or bubbles) is a crucial feature in dispersed two-phase flows since it affects heat and mass transfers through the interfacial area, influences their motion through the drag and added-mass forces, and is of major importance in breakup and coalescence phenomena. In general, interfacial tension tends to maintain a spherical shape, whereas gravity and hydrodynamic stresses cause deformations. When the drop shape is disturbed, it may either rupture or relax toward its equi-librium shape by performing damped oscillations, which are characteristics of the proper dynamics of the interface. In an unsteady flow, the drop shape results from the coupling between the interfa-cial dynamics and the time-varying hydrodynamic stresses to which the interface is submitted. The knowledge of the frequencies ωland the damping rates βlof the natural oscillations of the interface is therefore crucial for those who are interested to predict the breakup in unsteady flows. For a bubble immersed in a homogenous turbulence and in the absence of gravity,1it has been shown that
the breakup rate depends on the power spectral density of the turbulent fluctuations at the frequency of the main mode of oscillation (l = 2) of the interface and on the damping coefficient of this mode. Later,2,3the breakup probability of droplets in a strongly inhomogeneous turbulent flow has
been predicted from the response of an oscillator, of parameters ω2and β2, forced by the turbulent
fluctuations. A similar approach,4 known as Taylor Analogy Breakup (TAB), is implemented in the KIVA code and commonly used by engineers for numerical simulations of sprays. However,
the expressions of ωland βl are only known for a drop oscillating around a spherical equilibrium
shape.5–8 This constitutes a severe limitation for who has to deal with situations where the drop
is subjected to a continuous deforming force since these timescales can be strongly affected by a deviation from sphericity. For instance, the oscillating frequency of a drop in a uniaxial straining flow9is a decreasing function of the strength of the flow, and even vanishes when the maximal stable
deformation is reached.
The motivation of the present work is to extend the knowledge of the interface dynamics to cases where drops and bubbles are free to move under the action of gravity. From a fundamental point of view, the analysis of these situations reveals the physical mechanisms coupling translational motion and shape dynamics. Moreover, it provides the basic physical parameters describing the interface response, which are required to predict deformation and breakup of drops and bubbles in unsteady configurations, such as turbulent flows.
First, let us recall the fundamentals of the dynamics of a non-spherical drop that is released in a fluid at rest in the absence of buoyancy. In the limit of small deformation, the evolution of the interface is expressed as a sum of modes,
r = R +X
l≥2 X
−l≤m≤l
al,mYl,m(θ, φ − φl,m0 ) cos(ωlt) exp(−βlt), (1)
where R is the radius of the non-deformed drop, Yl, mis the spherical harmonic of polar wavenumber land azimuthal wavenumber m, al, m, and φl,m0 are the initial amplitudes and phases of mode (l,m). The eigenfrequencies ωland damping rates βldepend on l (but not on m), on the oscillating Reynolds number Reosc=√ρcRσ /µc, on the density ratiobρ = ρd/ρc, and on the viscosity ratiobµ = µd/µc (where σ is the interfacial tension, ρc and ρd are the density of the continuous and dispersed phases, respectively, and µcand µdtheir dynamic viscosity). Note that the Ohnesorge number, Oh = 1/Reosc, could be equivalently used. Assuming potential flow, a good approximation of the frequency is obtained:5
ωlLamb= s
(l − 1)l(l + 1)(l + 2)σ
(ρd(l + 1) + ρcl) R3 . (2)
The theoretical values of the frequencies and damping rates accounting for viscous effects, ωt hl and βlt h, have been determined by solving the linearized Navier-Stokes equations.6–8 In general,
they are solutions of an implicit characteristic equation, but explicit expressions are available for large Reynolds numbers. Rigorously, ωlt h and β
t h
l correspond to the asymptotic solution that is reached after the vorticity had time to diffuse from the interface,10but in practice they give accurate
predictions even for the first period of oscillation, provided the Reynolds number is not too small. Several theoretical,11,12 numerical,13,14 and experimental15,16 works considered nonlinear ef-fects for finite deformations. They described several couplings between modes and showed an effect of the amplitude on the frequency of the oscillations. However, the statistics of the deformation and the breakup of bubbles1or drops2,3immersed in a turbulent flow were reproduced well by comput-ing the response of the second mode of the linear theory to the stochastic turbulent fluctuations, in situations where buoyancy plays a minor role. The linear theory thus proved to be useful to address the breakup in turbulent flows.
The major limitation of the available theory to deal with complex flows rather comes from the fact that it does not account for buoyancy and surfactants. The damping rate of the oscillations of a drop of heptane rising in water has been shown to be significantly increased because of the presence of surface-active impurities.17Also, contrary to what is observed in microgravity conditions,1bubbles
rising in a uniform turbulent water flow were not observed to experience surface-tension-driven oscillations after having been deformed by an intense turbulent eddy.18
The objective of this work is to characterize the oscillations of drops or bubbles made of pure fluids rising under the action of buoyancy. In this context, there exist only two theoretical results, which relate the frequency of the modes to the equilibrium shape of the interface: a calculation for a bubble rising in a liquid by means of the potential theory19and a viscous prediction for a deformed
t = 0 t = 0.5 T2th t = T t = 2 T t = 10.6 T2th 2 th 2 th
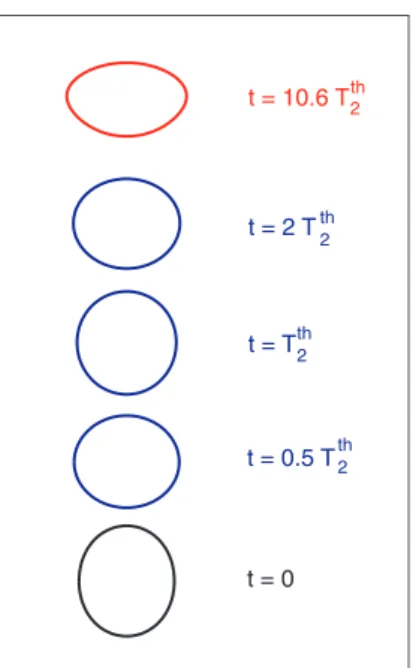
FIG. 1. Example of drop shape evolution from initial condition (black) to steady state (grey (red)) at ReOSC=100, Bo =
1.400 (Re∞=270).
bubble or drop.20As far as we know, there is no theoretical result concerning the damping rate. On the experimental side, the level of contamination of the interfaces is very hard to control, especially in liquid-liquid situations for which there is no experimental work with rising drops where the measured drag coefficient is that of a drop with clean interface. Here, the problem is addressed by means of axisymmetric numerical simulations. A drop or bubble is released in a liquid at rest. The initial shape is described by axisymmetric mode l = 2 with a positive amplitude and is thus approximately a prolate ellipsoid elongated in the vertical direction. A typical example of the evolution of the drop shape is given in Fig.1. This configuration is similar to experiments in which a drop is released from a capillary.17After the release, the drop or bubble accelerates and performs shape oscillations
around an average flattened shape that evolves in time. It finally reaches a terminal velocity and a steady spheroidal oblate shape with its minor axis oriented in the vertical direction. The damped oscillations occurring during the transient stage are analyzed in order to determine which modes are involved and to measure the oscillation frequencies and damping rates.
In addition to the oscillating Reynolds number, the density ratio, and the viscosity ratio, the simulations involve two supplementary dimensionless groups: the initial deformation a2(t = 0)/R
and the Bond number, Bo = (ρc − ρd)g(2R)2/σ . Note that it can be useful to use the terminal rising Reynolds number, Re∞=2RρcV∞/µc, instead of the Bond number, even if it is based on the
bubble terminal velocity V∞which is not a priori known. Our purpose being to study the effect of
the rising motion upon shape oscillations in the absence of nonlinear coupling between modes, the initial deformation is chosen small enough so that the results of the linear theory are obtained in the absence of buoyancy.
Considering what we know from the case without buoyancy, the case of a gas bubble in a liquid and that of a liquid drop in another liquid have to be distinguished. If the mode frequencies ωt hl , which are controlled by a potential mechanism, are in both cases approximated well by ωLamb
l , the damping rates βlt h are very different. For the bubble, the damping comes from the dissipation of the potential flow and scales as µc/ρcR2, whereas for a drop in another liquid it results from the
dissipation within the boundary layers that develop on both sides of the interface and scales as (µc/ρcR2)√Reosc. The influence of the rising motion is thus expected to be different too and we
will consider the two following typical situations: (ρ =b 0.99,bµ =1) further referred as the drop case, and (bρ =10−3,bµ =0.016) further referred as the bubble case.
Numerical simulations using level-set and ghost fluid methods have been carried out for three different oscillating Reynolds numbers (Reosc=50, 100, 200) and various rising Reynolds numbers
Re∞ranging from 50 to 600 (0.4 ≤ Bo ≤ 3.9) for the drop case and 50 to 300 (0.1 ≤ Bo ≤ 2.4) for the bubble case. This corresponds to a Weber number, W e∞=ρcV∞2 2R/σ = 1/2 (Re∞/Reosc)2,
ranging from 3 × 10⁻³to 4.
The paper is organized as follows. SectionIIdescribes the numerical code, its validation in the present context, and the post-processing. SectionIIIpresents the results of the drop case, while Sec. IVis devoted to the bubble case. SectionVsummarizes the main findings concerning the effect of the rising motion on the frequencies and damping rates of shape-oscillation modes.
II. NUMERICAL METHOD AND VALIDATION A. Numerical model
Axisymmetric simulations of a rising drop (or a bubble) experiencing shape oscillations are carried out using the level-set method by means of our numerical code DIVA.21,22We briefly present
the outline of this method. The interface is numerically described by the zero-level curve of a continuous function φ, which is defined as the algebraic distance to the interface. Its displacement in a velocity field U is computed by solving an advection equation:
∂φ
∂t +U.∇φ = 0.
The droplet motion is calculated by solving the incompressible Navier-Stokes equations by means of a projection method: ∂U ∂t +(U.∇)U + ∇ P ρ(φ) = ∇.(2µ(φ)D) ρ(φ) +g , ∇.V = 0 ,
where P is the pressure, µ the dynamic viscosity, ρ the density, g the acceleration of the gravity, and Dthe tensor of rate of deformation.
In these equations, ρ, µ, and P are discontinuous across the interface. The normal stress balance at the interface assumes that
[P]Ŵ=σ κ +2 · µ∂Un ∂n ¸ Ŵ ,
where Un is the velocity normal to the interface, n is the coordinate in the direction normal to the interface, σ the surface tension, and κ the interface curvature.
To handle the discontinuity of the pressure at the interface and calculate accurately its derivatives, a ghost fluid method has been implemented: the jump condition is extrapolated in one ghost cell on each side of the interface. The numerical formulation for the viscous term and the pressure jump at the interface follows the method detailed in Ref.23.
An algorithm of redistantiation is used to ensure that φ is a distance function at each time step, which needs the steady state of the following equation to be reached:
∂d
∂τ =sign(φ)(1 − |∇d|) , where d(x, t, τ )τ =0 =φ(x, t ); τ is a fictitious time.
These partial differential equations are discretized using the finite volume technique on a staggered grid. Spatial derivatives are estimated with a second order central scheme, while a fifth order WENO scheme is used for the convective terms, which ensures that solution is robust. Temporal derivatives are approximated with a second-order Runge-Kutta scheme.
TABLE I. Drop case: Relative errors in the frequency and the damping rate of mode 2 for a drop that oscillates in the absence of gravity.
Number of grid points ReOSC
in a radius 20 50 100 200 300 Frequency 16 0.42% − 0.07% − 0.51% − 0.43% − 0.60% 32 0.26% 0.06% 0.07% − 0.27% − 0.17% 64 0.74% 0.19% 0.01% − 0.09% − 0.11% Damping rate 16 0.22% 0.18% 0.91% 5.67% 7.78% 32 − 1.46% − 0.68% − 0.45% − 0.07% 0.64% 64 − 2.17% − 1.15% − 1.07% − 0.76% − 0.62% B. Validation
The numerical method has been validated on two situations: (1) the shape oscillations of drops or bubbles in the absence of gravity and (2) a weakly deformed rising bubble.
Simulations of drops and bubbles oscillating in the absence of gravity have been carried out for 20 ≤ ReOSC≤ 300. The initial condition corresponds to harmonic 2 with an amplitude a2=0.075R,
which ensures to remain in the linear regime of oscillation. TablesIandIIshow the errors in the determination of the frequency and the damping rate by comparison with the prediction, ω2t h and
β2t h, of the linear theory.8 Note that these values include both errors associated with the numerical simulation and errors in the determination of ω2and β2 from the time evolution of the amplitude
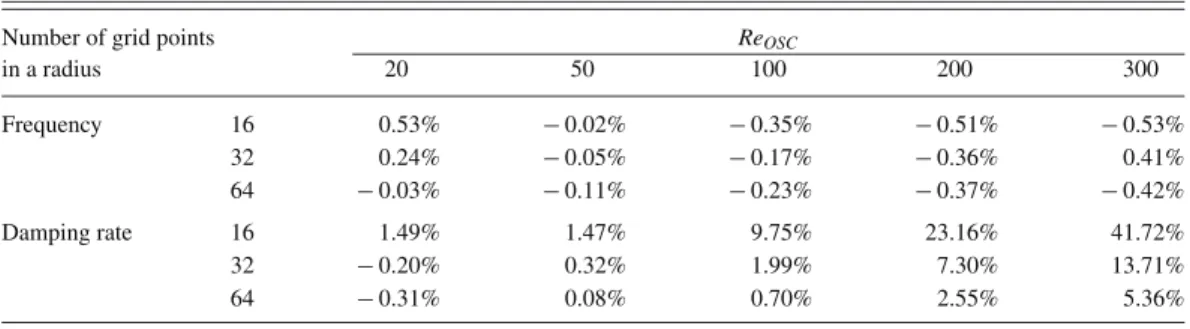
of harmonic 2 (see Sec.II C). Various computational grids with, respectively, 16, 32, and 64 nodes in a drop (or bubble) radius are presented. In any case, the accuracy is better for the frequency than for the damping rate because β2 is of the second order in such a range of Reynolds numbers. A
satisfactory accuracy is obtained for 32 nodes in a radius in the range of Reynolds numbers, 50 ≤ ReOSC≤ 200, that will be investigated in this study.
The second validation case is based on the terminal velocity of non-oscillating rising bubbles. Tests have been done by using computational grids with 4, 8, 16, and 32 nodes in a radius. The simulations consider spherical bubbles that are released in a liquid at rest. Bond numbers smaller than 0.025 have been considered to ensure that bubbles remain almost spherical. Five rising Reynolds numbers from 20 to 100 have been investigated. For each case, the drag coefficient Cdis determined after the bubble has reached its terminal velocity. TableIIIpresents relative errors in Cdby compar-isons with predictions for spherical bubbles: Mei et al.24for Re∞=[20, 40] and Moore’s theory25
for Re∞=[60, 80, 100]. The results show that a satisfactory accuracy is obtained from 16 nodes in
a radius.
In the rest of this work, axisymmetric simulations of rising and oscillating drops or bubbles are performed on a 256 × 512 grid with 32 nodes in a radius. It is worth mentioning that several similar simulations have been done with the JADIM code,26,27which is based on a volume of fluid method.
Comparisons with the present results, which are available in Ref.28, show a very good agreement.
TABLE II. Bubble case: Relative errors in the frequency and the damping rate of mode 2 for a bubble that oscillates in the absence of gravity.
Number of grid points ReOSC
in a radius 20 50 100 200 300 Frequency 16 0.53% − 0.02% − 0.35% − 0.51% − 0.53% 32 0.24% − 0.05% − 0.17% − 0.36% 0.41% 64 − 0.03% − 0.11% − 0.23% − 0.37% − 0.42% Damping rate 16 1.49% 1.47% 9.75% 23.16% 41.72% 32 − 0.20% 0.32% 1.99% 7.30% 13.71% 64 − 0.31% 0.08% 0.70% 2.55% 5.36%
TABLE III. Bubble case: Relative error in the drag coefficient of a spherical bubble rising at terminal velocity. Reference values are given by the correlation of Mei et al.24for Re
∞=[20, 40] and by Moore’s theory25for Re∞=[60, 80, 100].
Error on CD
Re∞ Bo 4 nodes in R 8 nodes in R 16 nodes in R 32 nodes in R 20 0.025 +64.0% − 5.0% − 1.2%
40 0.025 +129.5% − 3.5% − 1.6% +2.0%
60 0.025 +167.5% +2.7% +2.1% +5.9%
80 0.0125 +784.6% +2.7% − 3.7% +2.7% 100 0.0125 +840.6% +6.2% − 3.7% +2.0%
C. Post-processing of the drop shape
The drop contour in spherical coordinates, r(θ ), is obtained at each time step from the zero-value line of the distance function. The successive contours are then post-processed in order to obtain parameters describing the interface dynamics: velocity V (t ) of the drop centre, ratio χ (t) of the horizontal to vertical maximal drop dimensions, and amplitudesbal(t ) of spherical harmonics in the following decomposition:
r(θ, t ) =ba0+ 10
X l=2
bal(t ) Pl(cos(θ )), (3)
where Plare the Legendre polynomials,ba0is almost constant owing to the conservation of the drop
volume since we consider only small deformations, andba1is set to zero by choosing the drop centre as
origin of the coordinates. The series is stopped at l = 10, which is enough for an accurate description of the present drop shapes. As the drop accelerates, its equilibrium shape evolves under the action of hydrodynamic forces and the shape oscillations, which result from the initial deformation, no longer occur around a sphere, but around an oblate spheroid that flattens more and more. In order to discriminate the global evolution of the shape from the oscillations, eachbal(t ) is time-averaged over a moving window of one oscillation-period span centered on t. It is thus decomposed in a time-varying average shape hbal(t )i and an oscillating component:
bal(t ) = hbal(t )i + al(t ). (4)
The same decomposition is carried out for the aspect ratio χ (t).
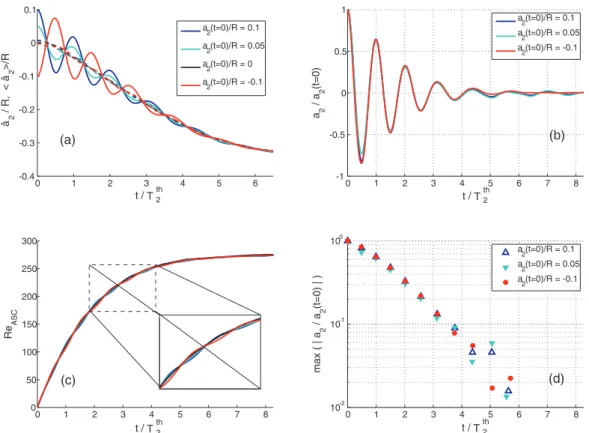
Examples of time evolutions of the drop parameters are shown in Fig.2for case (ReOSC=100, Bo =1.400, Re∞=270) with various initial amplitudes of deformation. Note that time is normalized by the period, T2t h =2π/ω2t h, of mode 2 in the absence of gravity.
Figures2(a)and2(b)present the decomposition of harmonic 2. Figure2(c)shows the instanta-neous rising Reynolds number, ReASC=2RρcV(t )/µc. Figure2(d)is a semi-log plot of the local maxima of |a2(t)| that are reached at instants ti. A careful examination of Fig. 2(b) reveals that
the frequency ω2 of the oscillations is not constant. Moreover, Fig.2(d)shows that the values of
log (|a2(ti)|) do not lay on a straight line, which means that the damping coefficient β2is also a
func-tion of time. In the following, the frequency and the damping rate will be determined at each instant corresponding to a local extremum of a2(t): ω2(ti) = 2π /(ti +1− ti − 1) and β2(ti) = [log (|a2(ti − 1)|) − log (|a2(ti +1)|)]/(ti +1− ti − 1). (Note that the results at t0=0 and t1are discarded to remove edge
effects resulting from the time-averaging procedure.)
D. Linearity of the oscillations
The objective of this work is to determine the effect of the rising motion on the drop shape oscillations in the linear regime. The smaller the deformation, the smaller nonlinear effects. But, the larger the deformation, the more accurate the description of the oscillations. We have therefore to choose the largest initial deformation that allows results independent of it.
0 1 2 3 4 5 6 7 8 -1 -0.5 0 0.5 1 a 2 / a 2 (t=0) 0 1 2 3 4 5 6 7 8 0 50 100 150 200 250 300 Re ASC 0 1 2 3 4 5 6 7 8 10-2 10-1 100 max ( | a 2 / a 2 (t=0 ) | ) 0 1 2 3 4 5 6 -0.4 -0.3 -0.2 -0.1 0 0.1 t / T2 th â 2 / R, < â 2 >/R a2(t=0)/R = 0.1 a2(t=0)/R = 0.05 a2(t=0)/R = -0.1 a2(t=0)/R = 0.1 a2(t=0)/R = 0.05 a2(t=0)/R = 0 a2(t=0)/R = -0.1 a2(t=0)/R = 0.1 a 2(t=0)/R = 0.05 a 2(t=0)/R = -0.1 t / T2 th t / T2 th t / T2 th (a) (b) (c) (d)
FIG. 2. Time evolution of a rising drop at ReOSC=100 and Bo = 1.400 (Re∞=270) for different initial amplitudes a2(t =
0)/R ={ − 0.10, 0, 0.05, 0.10}. (a) Harmonic ba2[—] and its time-varying average hba2i [- - -]. (b) Oscillating component a2
obtained by subtraction of hba2i. (c) Instantaneous rising Reynolds number ReASC. (d) Maxima and minima of a2(t)/a2(t = 0).
Figure2compares results obtained for a2(t = 0)/R ={ − 0.10, 0, 0.05, 0.10}. Figure2(a)shows
that the average deformation of cases with either an initial prolate (a2(t = 0)/R = 0.05 or 0.10) or
oblate (a2(t = 0)/R = −0.10) shape is similar to that of the case with an initial spherical shape (a2(t =
0) = 0). Moreover, all cases with non-zero initial deformation show similar evolutions of harmonic 2 (Fig.2(b)) and of rising velocity (Fig.2(c)) up to t = 4.5 T2t h. For larger times, a2becomes lower
than 1/5 of the mesh-grid spacing (≈0.005R), which does not allow an accurate determination of its local extrema (Fig.2(d)). The frequency and the damping have been computed while a2 is larger
than this threshold.
For all the cases considered above, the oscillations clearly belong to the linear regime. For the rest of this study, the initial amplitude is set to a2(t = 0)/R = 0.10 for drops and a2(t = 0)/R = 0.075
for bubbles.
III. RESULTS FOR A LIQUID DROP IMMERSED IN ANOTHER LIQUID
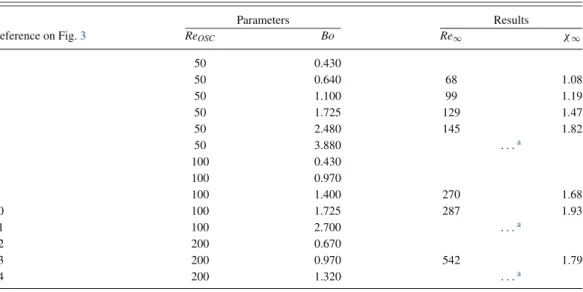
The drop case corresponds to both density and viscosity ratios close to unity (bρ =0.99,bµ =1). Three Reynolds numbers of oscillation (ReOSC=50, 100, and 200) and various Bond numbers (0.4 ≤ Bo∞≤ 3.9) have been investigated, corresponding to rising Reynolds numbers in the range 50 ≤ Re∞≤ 600 (TableIV).
A. Velocity, mean shape, and modes of oscillation
Time evolutions of the drop velocity, ReASC, and the aspect ratio, χ , are reported in Fig.3for all investigated cases. The initial condition corresponds to a drop at rest (ReASC=0), the shape of which is elongated in the vertical direction (χ < 1). As the drop accelerates, χ globally increases
TABLE IV. Drops: Parameters of the simulations (ReOSCand Bo), corresponding to the cases of Fig.3. The Reynolds number
of rising and the aspect ratio of the terminal shape are given when the terminal velocity can be considered as reached in the simulations.
Parameters Results
Reference on Fig.3 ReOSC Bo Re∞ χ∞
1 50 0.430 2 50 0.640 68 1.08 3 50 1.100 99 1.19 4 50 1.725 129 1.47 5 50 2.480 145 1.82 6 50 3.880 . . .a 7 100 0.430 8 100 0.970 9 100 1.400 270 1.68 10 100 1.725 287 1.93 11 100 2.700 . . .a 12 200 0.670 13 200 0.970 542 1.79 14 200 1.320 . . .a
aSelf-sustained oscillations are present.
and experiences oscillations. Concurrently, the velocity shows only slight oscillations, indicating a very weak influence of shape oscillations upon the drop velocity. At the highest rising Reynolds numbers, self-sustained oscillations of both shape and velocity are observed. These oscillations are not characteristic of the proper dynamics of the interface since they are forced by hydrodynamic instabilities that develop within the drop wake. Moreover, even though imposing the axial symmetry is relevant when the axisymmetric solution is stable, it is unphysical when describing such a path instability. Therefore, we will stop considering the results as soon as these self-sustained oscillations appear. We are confident concerning the results in the stable case because they have been proved to be independent of the mesh spacing and validated by comparison with another code.
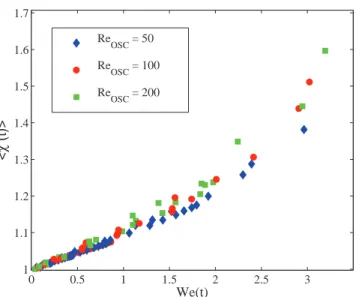
Figure4shows the instantaneous average aspect ratio hχ(t)i as a function of the instantaneous Weber number W e(t ) = ρcV2(t )2R/σ , for all simulated drops. The results nicely gather close to a
master curve, which is linear up to W e(t ) ≈ 1.5 and hχ(t)i ≈ 1.15. As expected in this range of rising Reynolds numbers, this confirms that inertia associated to the translational motion is responsible for the average drop deformation.
The aspect ratio gives a global information about the shape. A more detailed description is obtained from the decomposition into spherical harmonics, as illustrated in Fig.5where the time evolutions of harmonics 2, 3, and 4 are plotted for one of the largest Weber number investigated: W e∞=3.0 for ReOSC=100 and Bo = 0.970. Consider first the average drop shape (dashed lines in Fig.5(a)). The magnitude of all harmonics starts from zero (spherical shape) and then regularly increases up to the terminal shape. Harmonic 2 is clearly dominant and takes negative values since the drop is flattened. Harmonic 3, which accounts for the fore-aft asymmetry, is weak and negative: hba3i ≈ 0.1 hba2i at terminal velocity for all considered Weber numbers. Harmonic 4 is moderate and
positive, but its magnitude relative to that of harmonic 2 increases with the Weber number to reach hba4i ≈ 0.3 |hba2i| for W e∞ =3.5, indicating that the shape becomes more complex as the Weber
number increases.
We consider now the oscillations. Figure5(b)shows the time evolution of spherical harmonics. Owing to the chosen initial condition, harmonic 2 is dominant all along the simulation. However, harmonics 3 and 4, which are absent at the start of the simulation, are generated during the first period of oscillations. Then, from the second period, a2, a3, and a4are observed (1) to oscillate at
the same frequency, (2) to decay at the same rate, and (3) to have constant phases relative to each other. Because we have taken care to operate in the linear regime, the existence of higher harmonics is not the consequence of nonlinear interactions between modes. The reason is that the eigenmodes
0 2 4 6 8 0 50 100 150 t / T 2 th Re ASC (t) 0 2 4 6 8 1 1.5 2 2.5 (t) 0 5 10 0 100 200 300 Re ASC (t) 0 5 10 1 1.5 2 2.5 (t) 0 5 10 0 100 200 300 400 500 600 Re ASC (t) 0 5 10 1 1.5 2 2.5 (t) Re OSC=50 Re OSC=100 ReOSC=200 t / T2th t / T2th t / T 2 th t / T 2 th t / T 2 th 2 1 3 4 5 6 1 2 3 4 5 6 7 7 8 9 10 11 8 9 10 11 12 13 14 12 13 14
FIG. 3. Drops: Time evolutions of the rising Reynolds number, ReASC, and the aspect ratio, χ , for ReOSC={50, 100, 200}
and various Bo. The parameters of each case are given using the numerical labels in TableIV.
of shape oscillations are modified as the average shape varies. Whereas spherical harmonics are the eigenvectors of the oscillations around a spherical equilibrium shape, the eigenvectors of the oscillations around an equilibrium shape that involves several spherical harmonics (hba2i, hba3i, hba4i)
involves itself several spherical harmonics (a2, a3, a4).19The fact that a single frequency, a single
damping rate and a single phase are observed after the initial transitory stage suggests that a single mode is present. Following Meiron,19we will label it mode 2 by continuity with the corresponding eigenmode at W e = 0. Expressed in this new basis, shape oscillations involve this single mode. Nevertheless, this new basis is not suitable to describe the equilibrium shape.
Since harmonic 2 is predominant during the initial stage of the simulation and sufficient to characterize the eigenmode that controls the final stage, it is relevant to focus on its frequency and damping rate.
B. Frequency and damping rate
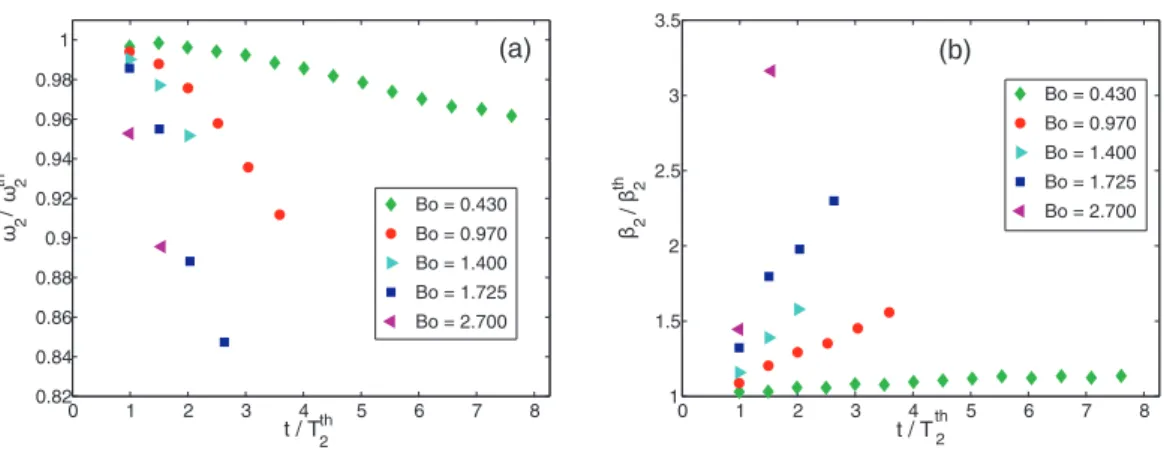
Figure6shows examples of time evolutions of ω2 and β2 for ReOSC =100 and various Bo.
0 0.5 1 1.5 2 2.5 3 1 1.1 1.2 1.3 1.4 1.5 1.6 1.7 We(t) < χ (t)> Re OSC = 50 Re OSC = 100 Re OSC = 200
FIG. 4. Drops: Aspect ratio of the average shape hχ(t)i against the instantaneous Weber number W e(t) for all investigated cases.
gravity. Then, as the drop accelerates, the frequency slightly decreases (−16% at Bo = 1.725), whereas the damping rate strongly increases (+230% at Bo = 1.725). The larger the rising velocity, the larger the deviations. This suggests investigating whether there exists a simple relation between these deviations and the instantaneous velocity. In Fig.7(a)(respectively, 7(b)), the values of ω2/ωt h2
(respectively, β2/β2t h) for all cases and instants are plotted against the instantaneous Weber number, W e(t ), which is proportional to the square of the ratio of the rising velocity to the oscillating velocity: ReASC(t )/ReO SC∼ V (t)/Rωt h2 . Thereby, both frequency and damping rates are gathered
around a master curve. Even though a certain scattering indicates that other factors – such as Bond number, drop acceleration, or motion history – also play a role, the deviations are mainly controlled by the instantaneous velocity. It is worth mentioning that at small deformation, the present results show a deviation in the frequency of oscillation as ω2/ωt h2 =1 + ha2i/R, whereas the theory of
Subramanyam20 predicts a much weaker deviation as ω
2/ωt h2 =1 + 1/8ha2i/R. This theory is
clearly not able to tackle the complexity of this problem.
0 2 4 6 8 -0.25 -0.2 -0.15 -0.1 -0.05 0 0.05 0.1 t / T2th â l / R Harmonic 2 Harmonic 3 Harmonic 4 0 2 4 6 8 -0.1 -0.05 0 0.05 0.1 a i / R t / T2th Harmonic 2 Harmonic 3 Harmonic 4 (a) (b) l = 2 l = 4 l = 3 l = 2 l = 3 l = 4
FIG. 5. Drops: Decomposition in spherical harmonics for case ReOSC=100 and Bo = 0.970 (Re∞=246, W e∞=3.0). (a)
0 1 2 3 4 5 6 7 8 1 1.5 2 2.5 3 3.5 t / Tth2 2 / 2 th Bo = 0.430 Bo = 0.970 Bo = 1.400 Bo = 1.725 Bo = 2.700 0 1 2 3 4 5 6 7 8 0.82 0.84 0.86 0.88 0.9 0.92 0.94 0.96 0.98 1 t / Tth 2 2 / 2 th Bo = 0.430 Bo = 0.970 Bo = 1.400 Bo = 1.725 Bo = 2.700 (a) (b)
FIG. 6. Drops: Time evolution of oscillation properties for ReOSC=100 and various Bo. (a) Normalized frequency ω2/ωt h2 .
(b) Normalized damping rate β2/β2t h.
C. Discussion of mechanisms
The rising motion has a strong impact on the damping rate, whereas it slightly alters the frequency. This difference in behavior can be explained by a difference of physical mechanism. The frequency is controlled by the potential flow associated with the oscillatory deformation of the interface. Deviations in the frequency are caused by the evolution of the eigenmode as equilibrium shape changes. On the other hand, the dissipation is controlled by the vorticity generation within the boundary layers that develop at the interface as the interface oscillates: at ReOSC =100, the contribution of the term proportional to the square root of the oscillating Reynolds number represents 90% of the damping rate for a drop in the absence of gravity.
More insight in the mechanism responsible for the damping can be gained from the examination of the vorticity field. Let us compare the five cases defined in TableV, which correspond to the same oscillating Reynolds number and are considered at an instant where the amplitude of the shape oscillation is minimum and the associated kinetic energy is maximum: D0O SC, a drop oscillating in the absence of gravity; DSO SC, a drop that rises slowly with a damping rate close to the value in the absence of gravity; DFO SC, a drop that rises rapidly and shows a strong deviation in the damping rate (fast drop); DSno O SCand DFno O SC, the same cases as DSO SCand DFO SC but without initial deformation, so with negligible shape oscillations.
0 0.5 1 1.5 2 2.5 3 3.5 4 0 0.1 0.2 0.3 0.4 0.5 0.6 0.7 0.8 0.9 1 We(t) 2 / th ReOSC= 50 ReOSC= 100 ReOSC= 200 0 0.5 1 1.5 2 2.5 3 3.5 4 1 1.5 2 2.5 3 3.5 We(t) 2 / th ReOSC= 50 ReOSC= 100 ReOSC= 200 (a) (b) 2 2
FIG. 7. Drops: (a) Normalized frequency and (b) damping rate against the instantaneous Weber number for all considered cases and instants. Continuous lines [—]: Fitting curves ω2/ω2t h= −0.0112 W e
2
(t) − 0.0218 W e(t) + 1.00 and β2/β2t h=
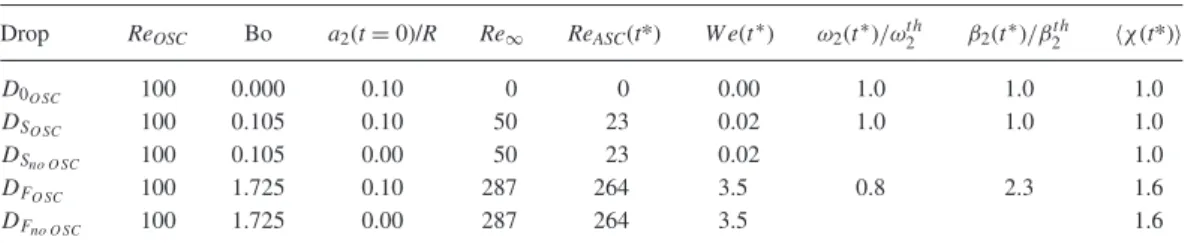
TABLE V. Drops: Parameters of the selected cases for examination of vorticity fields at t∗=(3 + 1/4) T2t h.
Drop ReOSC Bo a2(t = 0)/R Re∞ ReASC(t*) W e(t∗) ω2(t∗)/ωt h2 β2(t∗)/β2t h hχ(t*)i
D0O SC 100 0.000 0.10 0 0 0.00 1.0 1.0 1.0
DSO SC 100 0.105 0.10 50 23 0.02 1.0 1.0 1.0
DSno O SC 100 0.105 0.00 50 23 0.02 1.0
DFO SC 100 1.725 0.10 287 264 3.5 0.8 2.3 1.6
DFno O SC 100 1.725 0.00 287 264 3.5 1.6
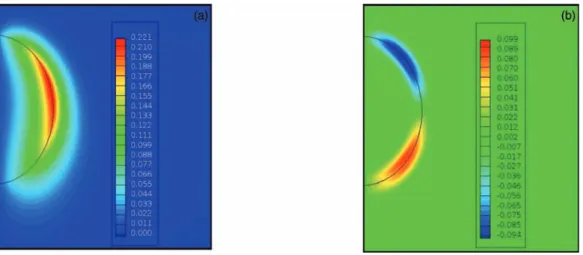
Figure8(a)shows the vorticity field of the non-rising drop D0O SC, while Fig.8(b)shows that of the slow-rising oscillating drop DSO SC. The two vorticity fields have a very different structure. The vorticity of the non-rising case is anti-symmetric about the drop equator and takes a negative extremum value at θ = π /4 and a positive one at θ = 3π /4, which are the locations of the nodes of the shape oscillation where the tangential fluid velocity is maximum. By contrast, the vorticity of the rising oscillating case keeps the same sign all over the flow field and shows a single maximum. Moreover, the magnitude of the vorticity of the rising case is more than twice that of the non-rising case. Figure9(a)shows the vorticity of the slow-rising non-oscillating case DSno O SC. Its structure and magnitude are similar to that of rising oscillating case, which means that the production of vorticity by the translational motion dominates that by the oscillating motion, even though the rising velocity remains moderate and the wake has not yet achieved its development. Figure9(b)presents the subtraction of the vorticity field of the slowly rising case without oscillation (DSno O SC, Fig.9(a)) from that of the slowly rising case with oscillation (DSO SC, Fig.8(b)). The result is very similar to that of the non-rising case (D0O SC, Fig.8(a)), which leads to the conclusion that the vorticity generated by the oscillatory motion and the vorticity generated by the rising motion do not influence each other. For a slowly rising bubble, the damping rate remains the same as that of a non-rising drop, even though the vorticity generated by the translation is larger than the vorticity produced by the shape oscillation.
Figure10(a)shows the vorticity field corresponding to the rapidly rising and oscillating case DFO SC. At the considered instant, the drop has almost reached its terminal velocity and a developed wake is present. The maximum vorticity is 70 times larger than that of the non-rising case D0O SC. Figure10(b)shows the subtraction of the vorticity field of the rapidly rising case without oscillation (DFno O SC, not presented) from that of the rapidly rising case with oscillation (DFO SC, Fig.10(a)). Contrary to what observed in the slowly rising case (Fig. 9(b)), Fig. 10(b) is totally different from the non-rising case (Fig.8(a)). When the rising motion is fast, the vorticity associated to the
FIG. 8. Drops: (a) Vorticity field for a non-rising oscillating drop (D0O SC), normalized by ω
t h
2 . (b) Vorticity field for a slowly
rising oscillating drop (DSO SC), normalized by ω
t h
FIG. 9. Drops: (a) Vorticity field for a slowly rising non-oscillating drop (DSno O SC), normalized by ω t h
2. (b) Vorticity field
of the slowly rising oscillating drop (DSO SC, Fig.8(b)) minus that of the slowly rising non-oscillating drop (DSno O SC,
Fig.9(a)), normalized by ω2t h.
oscillatory motion is no longer independent of the vorticity associated to the translational motion; the corresponding boundary layers interact, leading to an increase of the damping rate of the shape oscillations.
IV. RESULTS FOR A GAS BUBBLE IMMERSED IN A LIQUID
For the bubble case, density and viscosity ratios correspond to those of air in water (bρ =0.001, b
µ =0.016). Three Reynolds numbers of oscillation (ReOSC=50, 100, and 200) and various Bond numbers (0.1 ≤ Bo∞≤ 2.4) have been investigated, corresponding to rising Reynolds numbers in
the range 50 ≤ Re∞≤ 300 (TableVI).
A. Velocity, mean shape, and oscillations
Time evolutions of the bubble velocity, ReASC, and the aspect ratio, χ , are reported in Fig.11for all investigated cases. The initial condition is similar to that of drops: bubble at rest (ReASC=0) and
FIG. 10. Drops: (a) Vorticity field for a rapidly rising and oscillating drop (DFO SC), normalized by ω
t h
2 . (b) Vorticity field of
the rapidly rising and oscillating drop (DFO SC, Fig.10(a)) minus that of the rapidly rising but non-oscillating drop (DFno O SC),
TABLE VI. Bubbles: Parameters of the simulations (ReOSCand Bo), corresponding to the cases of Fig.11. The Reynolds
number of rising and the aspect ratio of the terminal shape are given when the terminal velocity has been reached before the end of the simulations. Please note that case 9 appears twice in Fig.11: once with a2(t = 0)/R = 0.075, once with a2(t = 0)/R
= −0.075.
Parameters Results
Reference on Fig.11 ReOSC Bo Re∞ χ∞
1 50 0.260 2 50 0.670 89 1.23 3 50 1.050 110 1.41 4 50 1.510 127 1.66 5 50 2.360 144 1.99 6 100 0.066 49 1.01 7 100 0.380 8 100 0.590 9 100 1.050 257 1.81 10 100 1.270 11 100 1.640 12 200 0.066 13 200 0.260 14 200 0.590
elongated in the vertical direction (χ < 1). By contrast with drops, the rising velocity V of bubbles experiences oscillations of significant amplitudes at the same frequency as shape oscillations. Its time evolution has been computed by using the balance between the added-mass, drag, and buoyancy forces that act on a spheroidal bubble (under the assumption ρd≪ ρc):
ρc 4 3πR 3 d CMV dt = −CD πR2 2 ρcV 2 − ρc 4 3πR 3g . (5)
At each instant, the added-mass coefficient is given by CM = β0 2 − β0
, with β0 =(ζ2+1)ζ cot−1ζ −
ζ2and ζ = (χ2− 1)−1/2, where χ is the instantaneous aspect ratio issued from the direct numerical
simulation. For the drag coefficient, we use the expression given by Moore29 which is valid in this range of rising Reynolds number and aspect ratio: CD= 48
ReASC G(χ ) " 1 + H(χ ) Re1/2ASC # , where G(χ ) and H(χ ) are two functions of the aspect ratio. Dotted lines in Fig.11show the time evolutions of ReASCobtained by solving Eq.(5)for the case ReOSC=100. The agreement between this elementary force balance and the direct numerical simulation is very good. It is worth noting that using the instantaneous aspect ratio, χ (t), or the average one, hχ(t)i, has negligible influence on the computed rising velocity. We can therefore conclude that the coupling between shape oscillations and rising velocity results from the variations of the added-mass coefficient, as previously stated by de Vries
et al.:30 as the bubble stretches, the added-mass coefficient decreases and the bubble acceleration
increases; as the bubble flattens, the added-mass coefficient increases and the bubble acceleration decreases. As a consequence, even though there are periods during which the bubble does not accelerate, the kinetic energy of the liquid that is entrained in the bubble rising motion regularly increases.
Figure12shows the instantaneous average aspect ratio hχ(t)i as a function of the instantaneous Weber number W e(t ), for all simulated bubbles. Similarly to drops, the results nicely gather around a master curve, confirming the predominant role of inertia associated to the translational motion in the determination of the average shape. The present results match the prediction of the potential theory by Benjamin31
(plain line) only for small deformations (hχ(t)i < 1.1), whereas they are in good agreement with the experimental correlation (dotted line) by Legendre et al.32 in the whole range of considered W e.
0 2 4 6 0 50 100 150 Re ASC (t) 0 2 4 6 1 1.5 2 (t) 0 2 4 6 0 50 100 150 200 250 300 Re ASC (t) 0 2 4 6 1 1.5 2 (t) 0 1 2 3 4 0 100 200 300 Re ASC (t) 0 1 2 3 4 0.8 0.9 1 1.1 1.2 1.3 (t) Re OSC=50 Re OSC=100 Re OSC=200 t / T 2 th t / T 2 th t / T 2 th t / T 2 th t / T 2 th t / T 2 th 1 2 3 4 5 1 2 3 4 5 6 7 8 9 10 11 6 7 8 9 10 11 12 13 14 12 13 14
FIG. 11. Bubbles: Time evolutions of the rising Reynolds number, ReASC, and the aspect ratio, χ , for ReOSC={50, 100,
200} and various Bo. The parameters of each case are given using the numerical labels in TableVI.
The time evolutions of spherical harmonics 2, 3, and 4 are presented in Fig.13for a representative case at W e∞≈ 3.6, for ReOSC=100 and Bo = 1.270 . The average bubble shape is shown by dashed lines in Fig.13(a). Its evolution follows similar trends as in the drop case: hba2i is negative and its
magnitude increases; hba3i is weak and negative; hba4i increases by taking moderate positive values.
Also, the ratios hba3i/hba2i and hba4i/hba2i at terminal velocity are similar for drops and bubbles.
However, for same W e∞and Re∞, larger values of |hba2i| are reached for bubbles than for drops.
Bubbles and drops therefore take the same average shapes, but the maximal deformation and the rate of deformation of bubbles are larger.
We consider now the oscillations around the average shape. At small Weber number, harmonic 2 remains dominant all along the simulation: a3 and a4are more than 5 times smaller than a2 for W e∞≤ 0.7. At larger W e, the time evolutions of the harmonics show two stages, as illustrated in Fig.13(b)for W e∞≈ 3.6. Until t = 1.5 T2t h, harmonic 2 decreases fast while higher harmonics
grow. After this initial stage, the amplitudes of harmonics 2, 3, and 4 are of the same order of magnitude and no longer evolve relative to each other. As observed for drops, all harmonics oscillate at the same frequency – close to ω2t h – and with the same damping rate. For the same reasons, we
0 0.5 1 1.5 2 2.5 3 3.5 1 1.1 1.2 1.3 1.4 1.5 1.6 1.7 1.8 1.9 2 < χ (t)> We(t) Re OSC = 50 ReOSC = 100 Re OSC = 200 Benjamin Legendre & al
FIG. 12. Bubbles: Aspect ratio of the average shape hχ(t)i against the instantaneous Weber number W e(t) for all investigates cases. Comparisons with the relations by Benjamin31and Legendre et al.32
the corresponding eigenmode of the oscillations around a spherical shape. A major difference with drops is that its decomposition brings into play the different harmonics with significant amplitudes. Another capital difference will be revealed by the examination of the frequency and the damping rate. Prior to discussing their time evolution in Sec.IV B, an important conclusion should be drawn from the previous analysis. The frequency ω2of harmonic 2 is representative of shape oscillations
during the whole simulation, whereas its damping rate β2is sufficient to characterize the evolution
of the energy of shape oscillations only during the final stage when a single mode is present. During the transitory stage where higher harmonics are growing, β2is not representative of the evolution of
the total energy of oscillations.
B. Frequency and damping rate
Figure14shows examples of time evolutions of ω2and β2 for ReOSC=100 and various Bo.
Evolutions of β3and β4are also plotted for case Bo = 1.05 (Re∞=257). Frequency and damping
rate are again functions of time.
Concerning frequency (Fig.14(a)), trends are similar to drops. The frequency decreases as the drop accelerates: the larger the velocity, the larger the deviation with respect to the theoretical
0 1 2 3 4 5 -0.4 -0.2 0 0.2 t /Tth 2 âl / R Harmonic 2 Harmonic 3 Harmonic 4 0 1 2 3 4 5 -0.08 -0.06 -0.04 -0.02 0 0.02 0.04 0.06 0.08 a l / R th 2 t /T th 2 th 2 (a) (b) Harmonic 2 Harmonic 3 Harmonic 4 Harmonic 2 Harmonic 3 Harmonic 4 l = 2 l = 3 l = 3 l = 2 l = 4 l = 4
FIG. 13. Bubbles: Decomposition in spherical harmonics for cases ReOSC=100 and Bo = 1.270 (Re∞≈ 270, W e∞≈ 3.6).
0 2 4 6 0.75 0.8 0.85 0.9 0.95 1 2 / 2 th Bo = 0.066 Bo = 0.380 Bo = 1.050 Bo = 1.270 0 2 4 6 1 1.5 2 2.5 3 2 / 2 th Bo = 0.066 Bo = 0.380 Bo = 1.050 Bo = 1.270 0 2 4 6 -1 -0.5 0 0.5 1 1.5 2 2.5 l / th 2 Harmonic 2 Harmonic 3 Harmonic 4 (a) (b) (c) t /T 2 th t /T 2 th t /T 2 th
FIG. 14. Bubbles: Time evolution of oscillation properties for ReOSC=100 and various Bo. (a) Normalized frequency
ω2/ωt h2 . (b) Normalized damping rate β2/β2t h. (c) Normalized damping rates β2/β2t h, β3/βt h2, β4/β2t hfor case Bo = 1.050
(Re∞=257, W e∞=3.3).
value in the absence of gravity. However, the effect remains moderate since the maximum observed deviation is less than 15%. In Fig.15(a), the values of ω2(t )/ω2t hfor all cases and instants are plotted
against the average aspect ratio hχi(t). The results gather around the potential prediction of Meiron,19
who calculated the eigenmodes of a non-spherical bubble that rises at terminal velocity (Note that a similar collapse of the results is obtained by plotting ω2(t )/ω2t hagainst W e(t )). Despite the residual
scattering that is probably due to the fact that the bubbles are accelerating fast, the good agreement with Meiron’s theory indicates that observed frequency deviations correspond to the evolution of the eigenmodes of oscillations as the bubble shape changes.
Concerning damping rate, behaviour of bubbles is totally different from drops. At low Bond number, β2/β2t hremains close to unity during the entire simulation, whereas at large Bo, it presents a
high value at the beginning of the acceleration stage and then decreases towards unity as the bubble approaches its terminal velocity (Fig.14(b)). Consistent trends are observed for β3/β2t hand β4/β2t h:
at low Bo, a3 and a4 remain close to zero, whereas at large Bo, β3/β2t h and β4/β2t h start from a
strong negative value to tend towards unity (Fig.14(c)). The instantaneous values of β2, β3, and
β4are clearly not correlated to the instantaneous bubble velocity. These results can be understood
by considering the evolution of the average bubble shape from the initial state until the final stage when the bubble rises at constant velocity. At t = 0, the bubble is at rest and its equilibrium shape is spherical: shape oscillations are thus characterized by a frequency ωt h2 , a damping rate β
t h
2 , and
eigenvectors that are the spherical harmonics. As the bubble accelerates, the bubble flattens more and more and the eigenmodes of oscillation have to continuously adapt to the evolving equilibrium
1 1.5 2 2.5 3 0 0.2 0.4 0.6 0.8 1
< >
2 / 2 th -0.7 -0.6 -0.5 -0.4 -0.3 -0.2 -0.1 0 1 1.5 2 2.5 3 3.5 4 4.5*
2 / 2 th (b) (a) ReOSC= 50 ReOSC= 100 ReOSC= 200 Meiron Re OSC= 50 Re OSC= 100 Re OSC= 200FIG. 15. Bubbles: Parameters of bubble oscillations for all considered cases and instants. (a) ω2(t)/ωt h2 against the
instan-taneous average aspect ratio hχi(t). [—] Fitting of Meiron’s result:19ω/ωth=0.0006hχi4− 0.0102hχi3+0.0745hχi2− 0.3077hχi + 1.2428. (b) β2(t)/β2t hagainst the normalized rate of change of the average shape: τ∗= Rβ1t h
2
dh ˆa2i
dt . [—] Fitting
FIG. 16. Bubbles: Rate of dissipation normalized by ρc(ωt h2 R) 2βt h 2 at time t∗=4T t h 2 +3T t h
2 /4 for ReOSC=100. (a) Case B0O SCin the absence of gravity. (b) Rapidly rising bubble BFO SC at Bo = 1.050 (Re∞=257, ReASC(t*) = 246).
shape. As the eigenvectors deviate more and more from the spherical harmonics, the oscillation, which was initially entirely conveyed by harmonic 2, is distributed over several harmonics. If this description is correct, the rate βlat which the amplitude of each mode evolves should be prescribed
by the average shape. Figure15(b)shows the values of β2(t )/β2t h for all cases and instants against
the rate of change of h ˆa2i normalized by the damping rate of mode 2 in the absence of gravity: 1
Rβt h2 dh ˆa2i
dt . All points nicely collapse on a master curve, which supports the proposed interpretation. It is remarkable that β2/β2t hreaches unity when the equilibrium bubble shape is steady. Even though
the bubble rises fast, the damping rate of the final mode is close to the value in the absence of gravity.
C. Discussion of mechanisms
In this range of Reynolds numbers, both the shape oscillation and the rising motion of a bubble are mainly controlled by potential mechanisms. At ReOSC =100, the asymptotic development of Miller and Scriven6for an oscillating bubble in the absence of gravity shows that 98% of the damping
rate results from the dissipation within the potential flow. At ReASC=200, Moore’s calculation25
shows that the potential flow contributes for 82% of the drag force of a spherical rising bubble. The predominance of the potential flow in the dissipation mechanism is illustrated in Fig.16where the rate of dissipation is plotted for oscillating bubbles at ReOSC =100. For a non-rising bubble (Fig.16(a)), one notes that the maximum dissipation is located at the poles where the velocity normal to the interface is maximum. For a fast rising bubble (Fig.16(b)), we observe that the dissipation is localized in the region of potential flow in front of and besides the bubble, whereas the contribution of the wake is negligible.
We consider now the different contributions of the mechanical energy. The potential energy of the surface that is associated with the bubble deformation, Esurf(t) = σ (S(t) − 4πR2), is
calcu-lated from the area S(t) of the bubble interface at each instant t. The kinetic energy of the fluid, Ekin(t), is calculated from the fluid velocity U(r, z, t) by integration of 12ρU2 over the
computa-tional domain. The work of gravity is obtained from time integration of the bubble rising velocity, Egr av(t ) = 43πR31ρg
Z t
0
V(τ ) dτ (with 1ρ = ρc− ρd). We will consider the five cases presented in TableVII: B0O SC is the reference case of a bubble that oscillates in the absence of gravity; BSO SC corresponds to a slowly rising bubble which remains almost spherical and for which β2 remains
always close to β2t h; BFO SC is a rapidly rising bubble that deforms significantly; BSno O SC and BFno O SC are similar to BSO SC and BFO SC without initial deformation.
TABLE VII. Bubbles: Parameters of the selected cases for examination of the different contributions of the mechanical energy. In this table, t∞represents the steady state.
Bubble ReOSC Bo a2(t = 0)/R Re∞ W e∞ ω2(t∞)/ωt h2 β2(t∞)/βt h2 hχi(t∞)
B0O SC 100 0.000 0.075 0 0.0 1.0 1.0 1.0
BSO SC 100 0.066 0.075 49 0.12 1.0 1.1 1.0
BSno O SC 100 0.066 0.000 49 0.12 1.0
BFO SC 100 1.050 0.075 257 3.30 0.9 1.0 1.8
BFno O SC 100 1.050 0.000 257 3.30 1.8
In an attempt to reveal the dynamics of the shape oscillations, we have subtracted from each contribution of the mechanical energy (Esurf(t), Ekin(t), and Egr av(t )) of a rising and oscillating case
(BSO SCor BFO SC) the same contribution of the corresponding non-oscillating case (BSno O SCor BFno O SC).
The results are denoted 1Esurf(t), 1Ekin(t), and 1Egr av(t ) and compared to the values, E0sur f(t ) and
Eki n0 (t ), of the case without gravity B0O SC.
Figure 17 shows the results for the slowly rising bubble. For these parameters, the energy associated with the rising motion is of the same order of magnitude as that associated with the oscillatory motion and the bubble shape remains spherical (hχi = 1.0). The results show that 1Egr av is negligible at all instants, 1Esurf(t) matches Esur f0 (t ), and 1Ekin(t) matches E
0
ki n(t ). The oscillations of the rising bubble are thus similar to that of a non-rising bubble. The kinetic energy and the surface energy are in antiphase. In view of the fact that they are quadratic with respect to the amplitude, they are oscillating at 2ω2and decreasing as exp ( − 2β2t). Moreover, β2≈ β2t hbecause
the oscillatory motion is not significantly altered by the rising motion.
Figure18shows the results for the rapidly rising bubble. In this case, the rate of dissipation of energy is two orders of magnitude higher than that of the non-rising bubble (Fig.16). We observe that 1Egr avremains small, which means that the oscillating and the non-oscillating bubbles rise almost
0 1 2 3 4 5 6 0 0.1 0.2 0.3 0.4 0.5 0.6 0.7 0.8 0.9 1 t / Tth2 Esurf Esurf Ekin Ekin Egrav
FIG. 17. Bubbles: Contributions to the mechanical energy of the shape oscillations normalized by the initial surface energy
Esurf(t = 0). [—] 1Esurf(t), 1Ekin(t), and 1Egr av(t) for the slowly rising bubble. [- - -] Esur f0 (t) and E0ki n(t) for the non-rising
0 0.5 1 1.5 2 2.5 3 3.5 4 -2 -1 0 1 2 3 t / Tth 2 1 2 3 4 -1 0 1 E kin E kin E surf E surf Egrav
Normalizedby Esurf (t) for BFno OSC
E kin E surf Normalizedby E surf(t=0) for BFOSC
FIG. 18. Bubbles: Contributions to the mechanical energy of the shape oscillations normalized by the initial surface energy
Esurf(t = 0). [—] 1Esurf(t), 1Ekin(t), and 1Egr av(t) for the rapidly rising bubble. [- - -] E0sur f(t) and E
0
ki n(t) for the non-rising
bubble B0O SC. Inset: 1Esurf(t) and 1Ekin(t) normalized by the surface energy for the rapidly rising and non-oscillating bubble
BFno O SC.
at the same velocity. 1Esurf(t) and 1Ekin(t) should thus be representatives of the energy associated with the oscillating motion. Their time evolution shows two different stages. During the first period of oscillation, the bubble is still almost spherical and 1Esurf(t) and 1Ekin(t) are similar to Esur f0 (t ) and E0
ki n(t ), like for the case of the slowly rising bubble. After the second period of oscillation, as the bubble deforms significantly, the period of oscillation of 1Esurf(t) and 1Ekin(t) doubles and their amplitude increases first significantly for eventually decaying at a rate close to β2t h. 1Esurf(t) and
1Ekin(t), which are still in anti-phase and of similar amplitude, oscillate now around an almost zero average. The mechanical energy of the oscillation, which is the sum of the kinetic and the surface energy, is therefore no more related to their peak-to-peak amplitude. Let us compare the evolution of the surface energy for the oscillations around a spherical and a non-spherical bubble. For sake of simplicity, we only consider harmonic 2. Examine first the case of a sphere. Each time the amplitude a2vanishes the bubble is a sphere and the surface energy is minimum. Each time a2reaches a positive
(prolate shape) or negative (oblate shape) extremum, the surface energy is maximum. The surface energy is therefore oscillating at twice the frequency of the amplitude a2. Examine now the case of
an oblate equilibrium shape. Maximum surface energy is still reached when a2reaches its negative
minimum since the bubble is then more oblate than the equilibrium shape. But minimum surface energy is now reached when a2reached its positive maximum, since the bubble is then less oblate
than at the equilibrium, which corresponds to an intermediate deformation. The frequency of surface oscillation is therefore the same as the frequency ω2of amplitude a2. This is an original situation: the
bubble experiences oscillations around a non-spherical equilibrium shape while the corresponding mechanical energy remains at each instant close to the surface energy of the equilibrium shape. Of course, (1) a non-spherical equilibrium shape and (2) a kinetic energy smaller than the value reached when the bubble passes by the equilibrium shape are possible because the bubble is rising. Such a behavior thus shows the limits of a description of the shape oscillation independently of the rising motion. Since 1Esurf(t) and 1Ekin(t) are not representative of the energy of the oscillation, it is not easy to draw conclusion from their rapid increase between 0.75 and 2 T2t h. The inset of
BFno O SC. With this normalization, 1Esurf(t) and 1Ekin(t) show regularly damped oscillations with an
initial amplitude close to unity. This suggests that their amplitude is controlled by the deformation of the average shape.
V. CONCLUDING REMARKS
The objective of this work was to determine the effect of the rising motion on the linear shape oscillations of drops and bubbles. We have computed the behavior of drops and bubbles that were initially deformed and released from rest in a liquid in the presence of gravity. As the bubble or drop rises, it is flattened by the action of hydrodynamic forces associated with the rising motion. Oscillations therefore no longer occur around a spherical equilibrium shape, which causes an evolution of the eigenmodes of oscillation. This is the major cause of the slight decrease of the oscillating frequency, which remains well predicted by the potential theory. When terminal shape and velocity are reached, a single mode that involves several spherical harmonics is present.
Two major differences between drops and bubbles have been observed. First, bubbles that have negligible mass experience larger accelerations. For similar oscillating and rising Reynolds numbers, bubbles deform more and faster. Also, owing to the variations of the added-mass coefficient, shape oscillations of bubbles cause much stronger velocity oscillations than those of drops. Second, the damping coefficient shows a totally different behavior. In the case of drops, the damping results from the dissipation within the boundary layers that develop on both sides of the interface. As the rising velocity increases, the boundary layers associated with the oscillating motion are affected by the boundary layers associated with the rising motion, and the damping rate increases. In the case of bubbles, the damping arises from the dissipation by the potential flow, which is weakly affected by the flow associated to the rising motion. At terminal velocity, the damping is close to the value in the absence of gravity.
We can now wonder what are the consequences of the rising motion on shape oscillations of drops or bubbles in practical situations.
For millimeter-sized drops of common fluids, the Weber number based on the rising velocity can hardly be larger than unity. The present results show that the deviations from the case without rising motion are low: less then 5% for the frequency and 20% for the damping rate. The well-known theoretical expressions obtained by assuming the absence of gravity therefore provide a good estimation of the interface timescales, which justified a posteriori their use for the prediction of the breakup probability in turbulent flows in Ref.2. Nevertheless, it is worth mentioning that this is only true provided surface-active contaminants are absent, since they can increase three times the damping rate through a Marangoni effect.17
For bubbles at terminal velocity, the frequency – which is given by Meiron’s theory – and the damping rate are also weakly affected by the rising velocity. However, during transient stages when the equilibrium shape of the bubble is changing at a rate comparable to the oscillating frequency, complex and sudden changes in the amplitude of the spherical harmonics can be observed. This occurs when a deformed bubble is released from rest. That could also be the case when a bubble impacts a strong turbulent eddy. In a turbulent flow, the theoretical values obtained in the absence of gravity are therefore reliable to predict the relaxation of the shape after the interaction with a strong turbulent eddy. However, the response to this interaction is much more damped, in agreement to what has been observed in Ref.18.
1F. Risso and J. Fabre, “Oscillations and breakup of a bubble immersed in a turbulent field,”J. Fluid Mech.372, 323–355
(1998).
2S. Galinat, F. Risso, O. Masbernat, and P. Guiraud, “Dynamics of drop breakup in inhomogeneous turbulence at various
volume fractions,”J. Fluid Mech.578, 85–94 (2007).
3R. Maniero, O. Masbernat, E. Climent, and F. Risso, “Modeling and simulation of inertial drop break-up in a turbulent
pipe flow downstream of a restriction,”Int. J. Multiphase Flow42, 1–8 (2012).
4P. J. O’Rourke and A. A. Amsden, “The TAB method for numerical calculation of spray droplet breakup,” SAE Tech. Pap.
Ser. 218, 872089 (1987).
5H. Lamb, Hydrodynamics (Cambridge University Press, Cambridge, 1932).
6C. A. Miller and L. E. Scriven, “The oscillations of a fluid droplet immersed in another fluid,”J. Fluid Mech.32, 417–435
7P.-L. Marston, “Shape oscillation and static deformation of drops and bubbles driven by modulated radiation stress –
Theory,”J. Acoust. Soc. Am.67, 27 (1980).
8A. Prosperetti, “Normal mode analysis for the oscillations of a viscous liquid drop in an immiscible liquid,” J. Mec. 19,
149–182 (1980).
9I. S. Kang and L. G. Leal, “Bubble dynamics in time-periodic straining flows,”J. Fluid Mech.218, 41–69 (1990). 10A. Prosperetti, “Free oscillations of drops and bubbles: The initial-value problem,”J. Fluid Mech.100, 333–347 (1980). 11J. A. Tsamopoulos and R. A. Brown, “Nonlinear oscillations of inviscid drops and bubbles,”J. Fluid Mech.127, 519–537
(1983).
12H. Azuma and S. Yoshihara, “Three-dimensional large-amplitude drop oscillations: Experiments and theoretical analysis,”
J. Fluid Mech.393, 309–332 (1999).
13O. A. Basaran, “Nonlinear oscillations of viscous liquid drops,”J. Fluid Mech.241, 169–198 (1992).
14T. Watanabe, “Numerical simulation of oscillations and rotations of a free liquid droplet using the level set method,”
Comput. Fluids37, 91–98 (2008).
15E. Becker, W. J. Hiller, and T. A. Kowalwski, “Experimental and theoretical investigation of large-amplitude oscillations
of liquid droplets,”J. Fluid Mech.231, 189–210 (1991).
16T. G. Wang, A. V. Anilkumar, and C. P. Lee, “Oscillations of liquid drops : Results from USML-1 experiments in space,”
J. Fluid Mech.308, 1–14 (1996).
17N. Abi Chebel, J. Vejraˇzka, O. Masbernat, and F. Risso, “Shape oscillations of an oil drop rising in water: Effect of surface
contamination,”J. Fluid Mech.702, 533–542 (2012).
18F. Ravelet, C. Colin, and F. Risso, “On the dynamics and breakup of a bubble rising in a turbulent flow,”Phys. Fluids23,
103301 (2011).
19D. I. Meiron, “On the stability of gas bubbles rising in an inviscid fluid,”J. Fluid Mech.198, 101–114 (1989).
20S. V. Subramanyam, “A note on the damping and oscillations of a fluid drop moving in another fluid,”J. Fluid Mech.37,
715–725 (1969).
21S. Tanguy, T. M´enard, and A. Berlemont, “A level set method for vaporizing two-phase flows,”J. Comput. Phys.221,
837–853 (2007).
22S. Tanguy and A. Berlemont, “Application of a level-set method for simulation of droplet collisions,”Int. J. Multiphase
Flow31, 1015–1035 (2005).
23M. Sussman, K. M. Smith, M. Y. Hussaini, M. Ohta, and R. Zhi-Wei, “A sharp interface method for incompressible
two-phase flows,”J. Comput. Phys.221, 469–505 (2007).
24R. Mei, J. F. Klausner, and C. J. Lawrence, “A note on the history force on a spherical bubble at finite Reynolds number,”
Phys. Fluids6, 418–420 (1994).
25D. W. Moore, “The boundary layer on a spherical gas bubble,”J. Fluid Mech.16, 161 (1963).
26T. Bonometti and J. Magnaudet, “An interface capturing method for incompressible two-phase flows: Validation and
application to bubble dynamics,”Int. J. Multiphase Flow33, 109–133 (2007).
27A. Blanco and J. Magnaudet, “The structure of the axisymmetric high Reynolds number flow around an ellipsoidal bubble
of fixed shape,”Phys. Fluids7, 1265 (1995).
28J. Gordillo, B. Lalanne, F. Risso, D. Legendre, and S. Tanguy, “Unsteady rising of clean bubble in low viscosity liquid,”
Bub. Sci. Eng. Tech.4, 4–11 (2012).
29D. W. Moore, “The velocity of rise of distorted gas bubbles in a liquid of small viscosity,”J. Fluid Mech.23, 749 (1965). 30J. de Vries, S. Luther, and D. Lohse, “Induced bubble shape oscillations and their impact on the rise velocity,”Eur. Phys.
J. B29, 503–509 (2002).
31T. B. Benjamin, “Hamiltonian theory for motion of bubbles in an infinite liquid,”J. Fluid Mech.181, 349–379 (1987). 32D. Legendre, R. Zenit, and J. R. Velez-Cordero, “On the deformation of gas bubbles in liquids,”Phys. Fluids24, 043303