HAL Id: inserm-00628502
https://www.hal.inserm.fr/inserm-00628502
Submitted on 4 Oct 2011
HAL is a multi-disciplinary open access
archive for the deposit and dissemination of sci-entific research documents, whether they are pub-lished or not. The documents may come from teaching and research institutions in France or abroad, or from public or private research centers.
L’archive ouverte pluridisciplinaire HAL, est destinée au dépôt et à la diffusion de documents scientifiques de niveau recherche, publiés ou non, émanant des établissements d’enseignement et de recherche français ou étrangers, des laboratoires publics ou privés.
High glucose increases susceptibility to
oxidative-stress-induced apoptosis and DNA damage in
K-562 cells.
Jan Hruda, Vladimir Sramek, Xavier Leverve
To cite this version:
Jan Hruda, Vladimir Sramek, Xavier Leverve. High glucose increases susceptibility to oxidative-stress-induced apoptosis and DNA damage in K-562 cells.. Biomedical papers of the Medical Faculty of the University Palacký, Olomouc, Czechoslovakia, 2010, 154 (4), pp.315-20. �inserm-00628502�
HIGH GLUCOSE INCREASES SUSCEPTIBILITY TO OXIDATIVE-STRESS-INDUCED
APOPTOSIS AND DNA DAMAGE IN K-562 CELLS
Jan Hruda
a,b*, Vladimir Sramek
b, Xavier Leverve
aa INSERM U884Laboratoire de Bioénergétique Fondamentale et Apliquée, Université J. Fourier, Grenoble, France b Department of Anaesthesia and Intensive Care, St. Anne’s University Hospital, Masaryk University, Brno, Czech Republic
E-mail: jan.hruda@fnusa.cz
Received: August 17, 2010; Accepted: November 11, 2010
Key words: K-562 cells/Oxidative stress/Apoptosis/Energy substrates/Hyperglycemia/DNA damage
Aim. The study was carried out to evaluate the effect of several substrates on oxidative stress induced apoptosis and in K-562 cells.
Methods. Glucose at 5, 11 and 30 mM concentrations was tested, as well as 5 mM glutamine and 5 mM fructose. The cells were exposed to tert-butylhydroperoxide (tBH) and apoptotic cells were evaluated by flow cytometry with FITC-Annexin V and propidium iodide. The effect of glucose concentration on DNA damage was evaluated using hydrogen peroxide and electrophoretic “DNA comets” assay at 5 mM and 30 mM glucose concentrations.
Results. The exposure of cells to tBH resulted in increased number of apoptotic cells, and this effect was prevented by administration of an antioxidant – N-Acetyl cysteine. Rising concentrations of glucose added to the toxic effect of tBH; we also observed some toxic effect of fructose and no effect of glutamine. We found higher susceptibility to hydrogen peroxide induced DNA damage with 30 mM glucose concentration.
Conclusion. Hyperglycemia increases the cell’s susceptibility to oxidative stress and it also amplifies oxidative DNA damage. Glutamine – when used as a sole energetic substrate – showed no protective effect against oxidative stress.
INTRODUCTION
In the past decade considerable evidence has been shown that there is a tight link between energy metabo-lism of the cell, oxidative stress, and apoptosis1,2.
Glycolysis is a universal metabolic pathway provid-ing energy by convertprovid-ing glucose into pyruvate. Under aerobic conditions pyruvate is oxidized to CO2 and H2O in mitochondria providing ATP by oxidative phosphoryla-tion. Using O2 as final acceptor of electrons makes the breakdown of glucose a lot more efficient than in the case of lack of oxygen when pyruvate is converted to lactate. At the same time, however, it generates oxidative stress.
Oxidative stress is a result of overproduction of reac-tive oxygen species (ROS) which are produced in aerobic organisms by electron transport chain of mitochondria. The ROS are highly reactive agents readily attacking mac-romolecules including nucleic acids. Under physiological conditions, the complex I of the electron transport chain seems to be the major site of ROS production3,4.
Apoptosis is energy-demanding cellular death which is regulated in several ways5. Mitochondria play a key role in the signalling pathway resulting in apoptosis6. Once the cascade is activated by the cell death stimuli (e.g. TNF-α), caspases-8 and -10 are cleaved to their ac-tive forms and mitochondria release cytochrome C and Apoptosis Inducing Factor into the cytoplasm7. Released cytochrome C then activates the initiator caspase-9 which consequently activates the effector caspases-3 and -7.
These effector caspases are also directly activated by the initiator caspases-8 and -10. Prolonged oxidative stress as well as DNA damage are some of the triggers of apoptosis that have been identified.
We hypothesized, that the susceptibility of the cell to oxidative stress and apoptosis is affected by the metabolic state of the cells. For this reason the ability of the cell to withstand the toxic effect of an oxidizing agent may vary significantly when different substrates are metabolised as a source of energy. In clinical practise a similar situa-tion occurs in intensive care when a patient with varying blood glucose control and energy substrate availability is exposed to oxidative insults (e.g. ischaemia/reperfusion, hyperoxaemia, etc.).
MATERIAL AND METHODS
Cell culture and experimental condition
The K-562 commercial cell line was used in this ex-periment. The cells were cultured in RPMI-1640 medium supplied with 10% bovine fetal serum and 1% L-glutamine-streptomycine. They were maintained in the exponential growth phase by regular centrifugation and resuspension in fresh RPMI medium.
To avoid alteration of results by the constituents of RPMI medium the cells were centrifuged and resuspend-ed in experimental mresuspend-edium for the experiment. This was prepared individually based on Krebs‘ medium and
con-316 J. Hruda, V. Sramek, X. Leverve
Table 1. The percentage of surviving cells at different glucose and tBH concentrations.
Glucose tBH Median 95% Confi dence
interval Min – Max 5 Mm 0 93.7 91.6 – 94.0 89.6 – 94.2 250 μM 89.1 88.0 – 90.7 86.9 – 92.5 500 μM 68.6 66.7 – 69.8 65.9 – 71.0 11 mM 0 92.9 91.1 – 93.8 89.7 – 94.7 250 μM 90.0 87.3 – 90.8 85.4 – 91.3 500 μM 64.5 59.5 – 68.1 53.4 – 72.1 30 mM 0 87.6 85.5 – 88.6 83.7 – 90.2 250 μM 77.0 71.3 – 78.7 67.2 – 81.5 500 μM 55.8 39.2 – 60.1 25.9 – 62.3 Glucose concentration p<0.01 tBH concentration p<0.01 Glucose-tBH interaction p<0.01
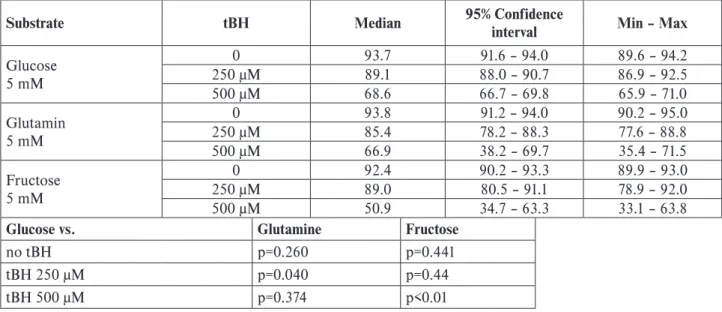
Table 2. The percentage of surviving cells at different tBH concentrations with different substrates.
Substrate tBH Median 95% Confidence
interval Min – Max Glucose 5 mM 0 93.7 91.6 – 94.0 89.6 – 94.2 250 μM 89.1 88.0 – 90.7 86.9 – 92.5 500 μM 68.6 66.7 – 69.8 65.9 – 71.0 Glutamin 5 mM 0 93.8 91.2 – 94.0 90.2 – 95.0 250 μM 85.4 78.2 – 88.3 77.6 – 88.8 500 μM 66.9 38.2 – 69.7 35.4 – 71.5 Fructose 5 mM 0 92.4 90.2 – 93.3 89.9 – 93.0 250 μM 89.0 80.5 – 91.1 78.9 – 92.0 500 μM 50.9 34.7 – 63.3 33.1 – 63.8
Glucose vs. Glutamine Fructose
no tBH p=0.260 p=0.441
tBH 250 μM p=0.040 p=0.44
tBH 500 μM p=0.374 p<0.01
Table 3. “Tail moments” in DNA comets assay at two different glucose concentrations and exposure to hydrogen peroxide. The differences between all groups are statistically significant (p<0.01).
Glucose Ox.stress Median 95% Confidence
interval Min – Max
5 mM – 0.022 0.20 – 0.61 0.001 – 0.720
H2O2 7.481 1.18 – 3.63 5.28 – 9.85 30 mM – 3.223 0.83 – 2.57 1.85 – 5.28 H2O2 47.672 4.54 – 13.99 32.81 – 56.56
taining 24 mM NaHCO3, 120 mM NaCl, 4.8 mM KCl, 1.2 mM KH2PO4, 1.2 mM MgSO4, and 1.2 mM CaCl2.
All chemicals were purchased from Sigma-Aldrich, ex-cept for FITC-Annexin purchased from Molecular Probes via Interchim dealer.
Flow cytometry experimental protocol
The experimental medium was supplied with either 5 or 11 or 30 mM glucose, or 5 mM fructose, or 5 mM glutamine. An 8 hrs incubation in these media was fol-lowed by 20 min exposure to 250 or 500 μM tert-butylhy-droperoxide (tBH) with a control group not exposed to
0 20 40 60 80 100 control tBH 1000μM tBH 1000μM NAcC 1mM tBH 1000μM NAcC 2mM tBH 1000μM NAcC 4mM % s u rv iv in g c e lls
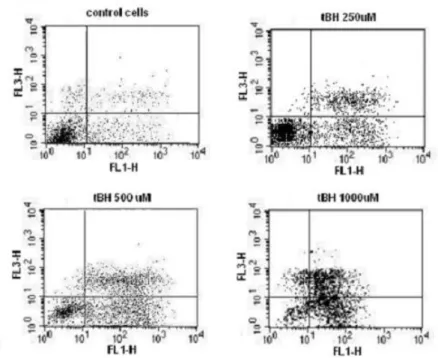
Fig. 1. Cytometric detection of apoptosis with Annexin-FITC (FL1-H) and propidium iodide (FL3-H) – cells exposed to different concentrations of tBH; glucose 11 mM. The principle of the staining is based on high affinity of Annexin to phosphatidylserine (PhS). In normal cells, PhS is present solely on the cytoplasmic surface of the cell membrane where it cannot be accessed by Annexin. During the process of apoptosis, PhS is translocated to the outer layer of the cell membrane and the cell will become positive in Annexin staining. Propidium io-dide (PI) does not pass through intact cell membrane and this is why it can be used to distinguish cells with compromised membrane. A cell positive in Annexin but negative in PI staining (lower right quadrant) can therefore be considered as apoptotic.
Fig. 2. The protective effect of N-Acetyl cysteine – per-centage of viable cells (*p<0.05 vs. tBH 1000 μM) at 1, 2 and 4 mM N-Acetyl cysteine concentra-tions.
tBH. The cells were then centrifuged, washed with fresh RPMI, centrifuged again and resuspended in fresh RPMI. They were incubated overnight for 12 hrs then flow cytom-etry was performed to determine apoptosis.
Double staining with FITC-Annexin and propidium iodide was used to detect apoptotic cells. For flow cy-tometry the cells were harvested by centrifugation and washed with cold phosphate-saline buffer. The cells were then re-centrifuged and resuspended in Annexin-binding buffer containing 10 mM HEPES, 140 mM NaCl and 2.5 mM CaCl2 at 1x10⁶ cells/ml. FITC-Annexin was added to the cell suspension and incubated for 15 min in the dark at room temperature. Propidium iodide was added and cytometry was conducted using 488 nm laser. The FSC, SSC, FL1 and FL3 data was collected; compensation for FL1/FL3 spectral overlap was performed before cytom-etry reading. The Becton Dickinson “FACScan“ analyzer with “CellQuest“ BD acquisition/analysis software was used in this study.
DNA comets experimental protocol
The experimental medium was supplied with either 5 or 30 mM glucose; the cells were incubated in these media for 16 hrs. After the incubation the cell suspen-sion was mixed with low-melt agarose at 37 °C, spread on prepared agarose-covered glass slides and cooled to 4 °C. The slides were then exposed to 1 mM Hydrogen Peroxide (H2O2) for 5 min with a control group not exposed to H2O2. Hydrogen Peroxide was then washed off by
three-fold rinsing in PBS and the cells were lysed on the slides with a solution containing 2.5 M NaCl, 100 mM EDTA, 10 mM Tris-Base, 10% DMSO and 1% Triton X-100 de-tergent. Subsequently electrophoresis was conducted for 30min at 25V/300mA. To visualize DNA fragments, the slides were stained with propidium iodide in a dark chamber and observed at 488 nm excitation wavelength in a fluorescence microscope (Fig. 3). Recorded images were analysed with the CometScore software available as freeware from TriTek corporation at http://autocomet. com/products_cometscore.php. “Tail moment” was used
318 J. Hruda, V. Sramek, X. Leverve
to imply the extent of DNA damage, as it includes both length of the tail and percentage of DNA contained in the tail8. Tail moment was calculated automatically by the evaluation software.
Statistical Analysis
A two-way ANOVA was applied to determine the statistical significance of the effect of glucose and tBH concentrations on the percentage of surviving cells. The Mann-Whitney U test was used to compare the effect of different substrates and the results of the DNA comets assay. All statistical tests were performed at the 5% signifi-cance level. All the results were obtained using Statistica software, StatSoft, Inc. (2007). STATISTICA (data analy-sis software system), version 8.0. www.statsoft.com.
Fig. 3. DNA Comet assay. DNA damage is clearly visible as “comet tail” and can be evalu-ated by special software.
Fig. 4. The metabolic connection between glucose and glutathione: pentose phosphate shuttle – an alternate pathway of glucose breakdown – is a key source of the reduced form of NADP necessary to restore the reduced form of glutathione. High glucose concentrations lead to inhibition of the pentose phosphate shuttle together with increased glucose flux through the glycolytic pathway. Thus high glucose concentrations lead to increased susceptibility to oxidative stress. (GS-SG oxidized glutathione, GSH reduced glutathione).
Due to the non-normal character of the data (0–100%) variance homogenity was violated. A Box-Cox transfor-mation was used to normalise the variance and data analysis was repeated. The results of the analysis of the transformed data were identical.
RESULTS
The results of flow cytometry measurements are pre-sented as the percentage of viable cells (detected by flow cytometry using Annexin-FITC and PI staining) after the final incubation of the experimental protocol. There were nine separate incubations and measurements for each par-ticular condition. We observed a clear toxic effect of tBH
(Fig. 1). N-Acetylcysteine, a potent antioxidant clearly prevented the effect of tBH (Fig. 2). There was no effect on the viability of the cells if N-Acetylcysteine in 1, 2 and 4 mM concentrations was used without tBH (data not shown). In this way we confirmed that cell death was oxidative-stress related in our experiment layout.
The set of experiments with 5, 11 and 30 mM glu-cose as energetic substrate showed statistically significant (p<0.01) decrease in percentage of surviving cells with rising tBH concentration. At 0, 250 and 500 μM tBH con-centrations statistically significant (p<0.01) decrease in percentage of surviving cells was found with rising glucose concentration. At the same time we proved (p=0.007) that high concentrations of glucose add to the cytotoxicity of tBH (Table 1).
We found no significant change if 5 mM glutamine was used, compared to 5 mM glucose. With 5 mM of fruc-tose there was no significant difference in cell mortality at 0 and 250 μM tBH concentrations, but the toxicity of high tBH concentrations was even more expressed (Table 2).
The results of DNA comets assay are presented as “Tail moment”. Four separate incubations for each condi-tion were performed with two slides prepared from each incubation and 50 cells evaluated on each slide. We found significantly greater DNA damage (p<0.01) in cells incu-bated with 30 mM glucose compared to 5 mM glucose in both hydrogen peroxide and control group (Table 3).
DISCUSSION
In this study tBH had cytotoxic, apoptosis-inducing and dose-dependent effect on K-562 cells. We proved that high glucose concentrations add to the effect of tBH. As it was prevented by N-Acetyl cysteine – an antioxidant – it is clearly related to oxidative stress. The explanation for this may be the metabolic linkage between glucose break-down and antioxidant protection of the cell (Fig. 4). Since tBH oxidizes the -SH groups it attenuates the cell’s abil-ity to protect against oxidative stress rather than directly inducing it. The -SH group is a key structure of action in glutathione – one of the most important mechanisms of cellular antioxidant defense. Reduced glutathione is essential for the breakdown of hydrogen peroxide via glutathione peroxidase. Once oxidized in this reaction, glutathione forms dimers and can only be restored with the reduced form of NADP. The source of reduced NADP within the cell is the pentose phosphate shuttle, an alter-nate metabolic pathway of glucose sharing its first step with glycolysis9. The next step of the pentose phosphate shuttle is catalysed by specific enzyme glucose-6-phospho-dehydrogenase which is notably inhibited by high glucose concentrations10. This is why high concentrations of glu-cose lead to increased glycolysis, mitochondrial metabolic activity and subsequently ROS production but at the same time they block production of NADP, thus attenuating the antioxidant protection of the cell. We suggest that in this way, high glucose concentration increases the toxic effect of an oxidizing agent. This finding is in agreement with other authors’ observations that high rate of
sub-strate influx to mitochondria induces cell sensitivity to oxidant-induced apoptosis11. The DNA damage observed in cells at high glucose concentrations can be explained in the same way as the additive effect of glucose to tBH – increased ROS production together with insufficient restoration of glutathione12.
Fructose enters the glycolytic pathway down the flow at the level of triose-phosphates and therefore bypasses the first step of glycolysis – its most important regula-tory mechanism13. As a result, the breakdown of fructose proceeds in a fast and rather uncontrolled manner and increases mitochondrial ROS production. This is probably not substantial under otherwise stable conditions but may become critical when the cell has to challenge further oxi-dative insults. This is a possible explanation why fructose proved to be toxic to cells only at high levels of tBH.
Glutamine has been reported to have certain anti-oxi-dant and anti-apoptotic capabilities14,15.In our experiment, however, we found no protective effect of glutamine. The reason for this might be that glutamine was used here as the only available substrate for the cells and not just added as extra treatment.
The concentration of glucose of 30 mM is quite high, and may already have considerable osmotic effect. To en-sure that this effect did not falsify our results, we conduct-ed a limitconduct-ed series of experiments with mconduct-edia containing 5 mM D-glucose and 25 mM L-glucose which is not me-tabolized by the cells16. The results were similar to those obtained with 5 mM D-glucose only (data not shown).
CONCLUSION
We conclude, that higher glucose concentrations in culture media increase the demands of the antioxidative mechanisms and thereby make the cell more susceptible to oxidative-stress-induced apoptosis. The same effect also results in amplification of oxidative-stress-induced DNA damage in cells cultivated in high glucose media.
ACKNOWLEDGEMENT
The authors thank to Cecile Cottet and Christiane Chauvin from INSERM U844 for their willing help with flow cytometry and cell culture.
The authors claim no conflict of interests. The study was funded by INSERM; all the equipment used came from INSERM U884 laboratory.
REFERENCES
1. Ježek P, Hlavata L. Mitochondria in homeostasis of reactive oxygen species in cells, tissues and organism. The International Journal of Biochemistry & Cel Biology 2005;37:2478–2503.
2. Leverve XM. Mitochondrial function and substrate availability. Crit Care Med 2007;35(9 Suppl):S454–60
3. Leverve XM, Fontaine E. Role of substrates in the regulation of mitochondrial function in situ. IUBMB Life 2001;52(3–5):221–9
320 J. Hruda, V. Sramek, X. Leverve
4. Magder S. Reactive oxygen species: toxic molecules or spark of life? Critical Care 2006;10:208
5. Steven HW. To die or not to die: an overview of apoptosis and its role in disease. JAMA 1998;279:300–307
6. Cavalli LR, Liang BC. Mutagenesis, tumorigenicity and apoptosis: are mitochondria involved? Mutation Research 1998;398:19–26 7. Reed JC, Green DR. Remodeling for Demolition: Changes in
Mitochondrial Ultrastructure during Apoptosis. Molecular Cell 2002;9:1–9
8. Heaton PR, Ransley R, Charlton CJ, Mann SJ, Stevenson J, Smith BH, Rawlings JM, Harper EJ. Application of single-cell gel electro-phoresis (comet) assay for assessing levels of DNA damage in ca-nine and feline leukocytes. J Nutr 2002;132(6 Suppl 2):598S-603S. 9. Wamelink MM, Struys EA, Jakobs C. The biochemistry, metabo-lism and inherited defects of the pentose phosphate pathway: a review. J Inherit Metab Dis 2008;31(6):703–17.
10. Leverve X. Hyperglycemia and oxidative stress: complex re-lationships with attractive prospects. Intensive Care Med 2003;29(4):511–4.
11. Jeong D, Kim TS, Cho IT, Kim IY. Modification of glycolysis af-fects cell sensitivity to apoptosis induced by oxidative stress and mediated by mitochondria. Biochemical and Biophysical Research Communications. 2004;313:984–991
12. Hollins DL, Suliman HB, Piantadosi CA, Carraway MS. Glutathione regulates susceptibility to oxidant-induced mitochon-drial DNA damage in human lymphocytes. Free Radical Biology & Medicine 2006;40:1220–1226
13. Mayes PA. Intermediary metabolism of fructose. Am J Clin Nutr 1993;58(5 Suppl):754S-765S.
14. Chang WK, Yang KD, Chuang H, Jan JT, Shaio MF. Glutamine protects activated human T cells from apoptosis by up-regulating glutathione and Bcl-2 levels. Clin Immunol 2002;104(2):151–60. 15. Petronini PG, Urbani S, Alfieri R, Borghetti AF, Guidotti GG. Cell
susceptibility to apoptosis by glutamine deprivation and rescue: survival and apoptotic death in cultured lymphoma-leukemia cell lines. J Cell Physiol 1996;169(1):175–85.
16. Bühler I, Walter R, Reinhart WH. Influence of D- and L-glucose on erythrocytes and blood viscosity. Eur J Clin Invest 2001;31(1):79– 85.