HAL Id: hal-01387691
https://hal.archives-ouvertes.fr/hal-01387691
Submitted on 26 Oct 2016
HAL is a multi-disciplinary open access
archive for the deposit and dissemination of
sci-entific research documents, whether they are
pub-lished or not. The documents may come from
teaching and research institutions in France or
abroad, or from public or private research centers.
L’archive ouverte pluridisciplinaire HAL, est
destinée au dépôt et à la diffusion de documents
scientifiques de niveau recherche, publiés ou non,
émanant des établissements d’enseignement et de
recherche français ou étrangers, des laboratoires
publics ou privés.
Distributed under a Creative Commons Attribution| 4.0 International License
Mechanical characterization of rubber from one
heterogeneous test
Thomas Guélon, Evelyne Toussaint, Jean-Benoit Le Cam
To cite this version:
Thomas Guélon, Evelyne Toussaint, Jean-Benoit Le Cam. Mechanical characterization of rubber from
one heterogeneous test. Sixth European Conference on Constitutive Models for Rubber (ECCMR VI),
Sep 2009, Dresde, Germany. pp.193-198. �hal-01387691�
Mechanical characterization of rubber from one
heterogeneous test
T. Guélon
Laboratoire d’Ingénierie pour les Systèmes Complexes (LISC), Aubière cedex, France
E. Toussaint & J.-B. Le Cam
Laboratoire de Mécanique et Ingénieries (LaMI) Blaise Pascal University (UBP), French Institute for Advanced Mechanics (IFMA), Campus de Clermont-Ferrand / les Cézeaux, Aubière Cedex, France
ABSTRACT: The present study deals with the mechanical characterization of elastomeric materials. Classically, three homogeneous tests are considered to identify constitutive parameters, namely Uniaxial Tensile (UT), Pure Shear (PS) and Equibiaxial Tensile (ET) tests. Here, a new method is proposed: it consists in inducing the three previous homogeneous tests from only one heterogeneous mechanical test. For this purpose, a conventional tensile machine is used and a new apparatus is designed to be adapted on the machine. The test-induced heterogeneity is discussed related to two criteria based on the existence of UT, PS and ET and on the distribution of the maximal principal elongation at each material points of the sample surface. Experimentally, kinematic fields are provided on the sample surface by an image correla-tion code suitable for large deformacorrela-tions. Finally, an inverse technique, so-called Virtual Field Method, is used to identify the material parameters in the framework of the Mooney hyperelasticity.
Kinematic fields are provided by a Digital Image Correlation software suitable for large deforma-tions: CorreliLMT (Hild 2002). Constitutive
param-eters are identified using an inverse method called the virtual field method.
2 CHOICE OF THE SAMPLE GEOMETRY AND THE LOADING CONDITIONS
In this section, a heterogeneous test that com-bines UT, PS and ET from a conventional tensile machine is presented. A numerical approach is used to choose the sample geometry and the load-ing conditions in order to generate sufficient het-erogeneity of the kinematic fields. Criteria used to estimate Test-Induced Heterogenity (TIH) are defined and the chosen sample geometry and load-ing conditions are presented.
2.1 Test-induced heterogenity
We analyse the heterogenity induced by the test using the I1 – I2 diagram where I1 and I2 are the first
and second invariants of the right Cauchy-Green tensor C (Holzapfel 2000). This diagram allow us to determine the loading condition applied at 1 INTRODUCTION
The behaviour of rubber-like materials is generally modelled in the framework of hyperelasticity. Numerous constitutive relations are available in the literature (Marckmann and Verron 2006). The identification of the material parameters that govern the constitutive equations is still a dif-ficult task. Classically, three homogeneous tests are considered to identify constitutive parameters, namely uniaxial tensile (UT), pure shear (PS) and equibiaxial tensile (ET) (Ward and Hadley 1993), (Sasso et al. 2008) and a trade-off between the dif-ferent sets of values obtained for each type of test must be found. These tests are based on the strong assumption of homogeneity of the kinematic fields induced by each test.
In the present work, a new approach based on a heterogeneous test that simultaneously generates the three types of strain states abovementioned is pro-posed. For that purpose, the authors propose to design and adapt a new apparatus on a conven-tional uniaxial tensile machine that generates a het-erogeneous strain state. The sample geometry and the loading conditions are defined beforehand by numerical investigations. Two criteria are defined to discuss the heterogeneity induced by the test.
each material point of the kinematic fields. In this diagram (see Fig. 1), the three curves UT, PS and ET are plotted. The localization of any point in this diagram indicates the corresponding loading condition: it can be only one of the three previous loadings or a combination of two of them.
In order to characterize TIH, we propose two criteria. Firstly, the test has to generate the three homogeneous loading conditions, namely UT, PS and ET. Secondly, for each loading condition, i.e. UT, PS and ET, a distribution of the maximal principal stretch ratio (defined as the ratio between actual and initial lengths) has to be observed and must be sufficiently large considering the chosen constitutive equations and its field of validity. In the following, these criteria are used to choose both sample geometry and loading conditions.
2.2 Sample geometry and loading conditions In the present study, a uniaxial tensile machine is used. In order to generate heterogeneity in the kinelatic fields, a change in geometry (for instance by adding notches or holes) could be considered. However, because of large deformations, the strain state obtain in an elastomer tends to be homogene-ous, i.e. TU, whatever the geometry. So, numerical investigations are carried out to choose both sam-ple geometry and biaxial loading conditions that generate a high heterogeneity level. The sample geometry and the loading conditions applied are presented in Figure 2. The sample geometry, which corresponds to a three branch sample, is 2 mm thick, 60 mm high and the branches are 20 mm in width. The bottom branch is clamped, the loading is carried out by applying prescribed displacement following the axis of the two other perpendicular branches.
A Finite Element Analysis is performed using the Ansys 10.0 package to discuss the TIH. Ele-ment type plane 182 is used to ensure the incom-pressibility assumption. The mesh is composed of 640 elements. For the sake of simplicity, we have chosen the Mooney strain energy density (Mooney 1940):
W=C I1( 1− +3) C I2( 2−3) (1) where C1 and C2 are the material parameters. Their
values are chosen equal to 0.4 MPa and 0.04 MPa, respectively, which are typical values for carbon black filled natural rubber.
Figure 3 shows that in the (I1 – I2) diagram,
the three homogeneous tests are satisfactorily represented and distributed. The corresponding maximum principal elongation (see Fig. 4) of each loading case at the sample surface is deduced from Figure 3.
Global stretch ratios (defined as the ratio between actual and initial sample lengths) of 1.71 and 1.42 are prescribed following the horizontal and the vertical axes, respectively. The equiva-lent maximum stretch ratio is higher for UT than
Figure 1. Three basic loading cases.
Figure 2. Sample geometry and loading conditions.
for PS and ET. This is explained by the fact that PS and ET are obtained by the extension of the branches. From Figure 4, one can conclude that each loading case is satisfactorily represented in terms of distribution of the maximum principal stretch ratio.
3 EXPERIMENTAL SET-UP
The numerical configuration is now used to per-form the test with a conventional uniaxial testing machine. To prescribe a biaxial loading condition, a new apparatus is designed. It is presented in the first part of this section. Then, the measurement of the displacement fields is precisely described.
3.1 New apparatus
The testing machine, referred to as MTS 858 Elastomer Test System, has a loading capacity of 15 kN. The loading cell is 1 kN capacity. A new tensile apparatus is designed to be adapted to the uniaxial tensile machine. It allows to generate ET at the sample centre. This apparatus is mounted on the left testing machine column (see Fig. 5).
Figure 6 presents a picture of the apparatus. It is composed of four parts:
• part A allows the apparatus to be fixed on one of the two columns;
• part B is a grip in which the horizontal branch of the sample is fixed;
• part C corresponds to a helical slide that ensures the horizontal branch of the sample to be stretched;
• part D is a ruler used to measure the horizontal displacement of the grip.
In practise, the two vertical branches of the sample are fastened on the grips of the conventional testing machine, then the branch perpendicular to the previous ones is fastened on the apparatus grip.
3.2 Measurement of the kinematic fields
Digital Image Correlation (DIC) technique is used to measure the displacement fields at the sample surface. For that purpose, images are shot with a cooled 12-bit dynamic CCD camera with 1376 × 1040 squared pixels and CORRELILMT
software is used. The DIC technique is well-suited for measuring large strains and has already been used in the case of elastomeric materials (Chevalier et al. 2001). To determine the displacement field of a given image with respect to a reference image, one considers a set of sub-images (i.e., a square region that contains N × N pixels). This set is referred to as Zone of Interest (ZOI). A suitable correlation function is used to calculate the displacement of the centre of a given ZOI in two images captured at different stages of an experiment. In the present work, special attention is paid to the choice of the size of the ZOIs that define the region of inter-est (ROI). Here, the size of the ZOI is equal to 16 pixels with a shift of 16 pixels. This parameter characterises the measurement grid. To improve the image contrast, white paint is sprayed on the sample surface before testing.
Figure 4. Numerical TIH visualization: maximum value of the principal stretch ratio.
Figure 5. Experimental set-up.
4 IDENTIFICATION OF THE MATERIAL PARAMETERS
In this section, we present the method used to iden-tify the material parameters of a given model from one heterogeneous test. It must be emphasized that no closed-form solution generally exists for such a problem, thereby meaning that no simple rela-tion between local measurements, load, specimen geometry and unknown parameters is available. Extracting constitutive parameters in this case is a major issue which must be tackled using relevant tools. We propose here to use the so-called Virtual Fields Method (VFM) which has recently be used for characterizing elastomeric materials within the framework of large deformations (Promma et al. 2009).
The VFM relies on the Principle of Virtual Work (PVW) which can be regarded as the global equilibrium of the specimen under study or the weak form of the local equations of equilibrium (Dym and Shames 1973). In case of large deforma-tions, assuming a plane state of stress and neglect-ing body forces such as weight, the PVW can be written as follows: Π: * ( . .). *Π * . . S S U X dS n U dl U K A 0 0 0 0
∫
∂∂ +∫
∂ = ∀ (2)where Π is the first Piola-Kirchhoff stress tensor (PK1), the X s are the Lagrangian coordinates, U* is a kinematically admissible virtual field, S0 is the
surface of the specimen in the initial configuration the boundary of S0 and n the unit vector
perpen-dicular to this boundary. Considering the Mooney strain energy density, one can express the stress components as functions of the actual strain com-ponents. This leads to the following equation:
C A U X dS C B U X dS n U dl U K A S S S 1 0 2 0 0 0 0 0 : * : * ( . .). * * . . ∂ ∂ + ∂ ∂ = = ∀
∫
∫
∫
∂ Π (3)where A and B are quantities depending on the components of the deformation gradient ten-sor F. This equation is linear with respect to the unknown parameters C1 and C2. In the integrands
above, there are two types of terms: A and B on one hand, ∂U*∂X on the other hand. A and B are directly deduced from the full-field measure-ments whereas ∂U*∂X is derived from the virtual field U*. At this stage, the idea consists in writing the PVW with two different virtual fields U*. Since actual strain fields are heterogeneous, this leads to two independent equations where C1 and C2
are unknown. They are obtained by inverting the linear system.
Choosing at best the two virtual fields is a key issue in the method. In the present case of large deformations and hyperelasticity, it has been decided to use the following heuristic method. A large number of virtual fields is first randomly generated. Then, the set of two virtual fields that leads to the best conditioning of the linear system (assessed with the condition number) is finally cho-sen for identification purposes. Those two virtual fields provide parameters less sensitive to noisy data. In the present work, virtual fields have been defined piecewise (Toussaint et al. 2006) because of the particular shape of the specimen. Four sub-regions are used to mesh the specimen because of its particular shape. The virtual displacement defined in each of the four sub-regions is described by polynomial shape functions multiplied by the virtual displacement of the nodes defining the corners of the sub-regions. These shape functions are similar to those employed in the finite element method. Figure 7 presents an example of opti-mized initial fields used for identifying C1 and C2
for the maximum global stretch ratios.
5 RESULTS
5.1 Experimental kinematic fields
The biaxial tensile test is carried out by prescrib-ing a 25 mm displacement along both the x- and y- directions shown in Figure 2. The correspond-ing global stretch ratios are 1.71 and 1.42 along the x- and y-directions, respectively. In order to avoid the well-known stress accommodation (Mullins 1948; Meunier et al. 2008; Godin et al. 2009)
Figure 7. Example of one optimized virtual fields (dot-ted line) used for identifying C1 and C2. The maximum global stretch ratios is superimposed with the virtual mesh (solid line).
over the first mechanical cycles, three cycles are first carried out with the same maximum stretch ratio, thereby partially stabilizing the mechanical response of the specimen. Images are stored for every 1 mm of prescribed displacement in both directions. The material considered here is a car-bon black filled natural rubber. Its composition and some of its mechanical properties are given in Table 1.
A typical view of the horizontal and vertical dis-placement fields obtained for the maximum pre-scribed global stretch ratios is shown in Figure 8.
Differentiating these fields provides the four components of the displacement gradient. They are obtained by using a centered finite differences scheme. In the present case, 740 experimental points are processed. This number is close to the number of elements used for numerical simulations and makes it easier to compare numerical and experi-mental TIH visualizations (see Figs. 3 and 9).
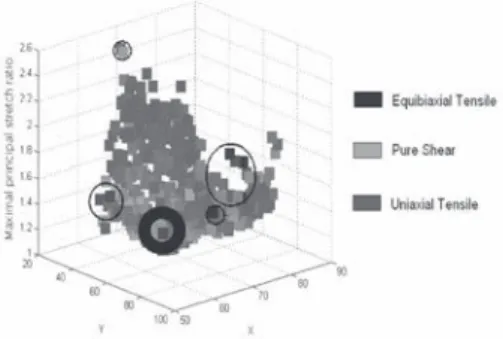
The states of strain of the three homogeneous tests (UT, PS and ET) are represented and the equivalent maximum stretch ratio is higher for UT than for PS and ET. Figure 10 presents the maxi-mum principal stretch ratio for each ZOI.
Here, each loading case is satisfactorily repre-sented in terms of maximum stretch ratio distri-bution. With regard to the previous analysis and numerical prediction, the TIH satisfies the two criteria used to define a sufficient level of TIH. Some points are encircled in Figures 9 and 10. They correspond to points taht are located at the border of the sample i.e. to zones for which there are insufficient measurement points to obtain an efficient image correlation. To summarize, these experimental results are in good agreement with the numerical prediction in terms of TIH.
5.2 Identification results
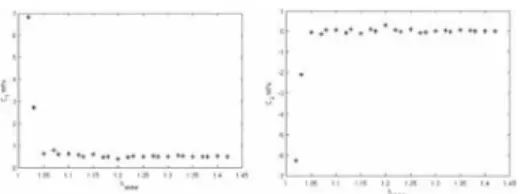
Identification results are presented in Figure 11 for each step of the loading. This step is equal to 1 mm along both the x- and y- directions. C1 and
C2 are calculated at each loading step. The global stretch ratio reported along the horizontal axis in Figure 11 is that prescribed along the y- direction.
Apart from stretch ratios inferior to 1.05, both
C1 and C2 remain approximately constant while the
global stretch ratio increases, thereby showing that the Mooney strain energy density presently used correctly describes the actual mechanical response
Table 1. Material formulation (parts per hundred rubber) and mechanical properties. Components NR Rubber 100 Zinc oxide 9.85 Oil 3 Carbon black 34 Sulfur 3 Stearic acid 3 Antioxidant 2 Accelerators 4 Density 1.13 Shore A hardness 58
Stress at break (MPa) 22.9 Elongation at failure 635
Figure 8. Displacement fields.
Figure 9. Loading cases in the (I1 – I2) plane.
Figure 10. Experimental TIH visualization: maximum value of the principal stretch ratio.
of the specimen. The mean values of C1 and C2
deduced from these curves are 0.509 MPa and 0.012 MPa, respectively. These values are accept-able with regard to thermodynamic considerations (Ball 1977). It should be noted that only the loading steps corresponding to a global stretch ratio along the y- direction ranging between 1.05 and 1.42 are considered here. In fact, identifying C1 and C2 in
the domain of low stretch ratio leads to unreliable results. This is explained by the fact that the mate-rial parameters are not sufficiently activated in this domain. It should be noted that this observation is valid whatever the law considered.
6 CONCLUSION
The aim of the present paper is to propose an alter-native to the classical method of identifying con-stitutive parameters of rubber. For that purpose, only one heterogeneous test is performed. Sample geometry and loading conditions are chosen using numerical simulations in order to involve UT, PS and ET at the sample surface. The test-induced heterogeneity is discussed related to two criteria. To perform the heterogeneous test, a new appara-tus is designed and is adapted on a conventional tensile machine. Displacement fields are measured on the specimen surface using the DIC technique.
Unknown constitutive parameters are then deduced from these fields using a suitable iden-tification procedure: the Virtual Fields Method extended to hyperelasticity. Results obtained are in agreement with theoretical and numerical expecta-tions, thus confirming the feasibility of the present approach. An interesting perspective would be to identify parameters governing more complicated constitutive models. For instance, it could be inter-esting to take into account the significant change in volume observed under extension in such a material (Le Cam and Toussaint 2008).
REFERENCES
Ball, J. (1977). Convexity conditions and existence theo-rems in nonlinear elasticity. Arch. for Ration. Mech.
An. 63, 337–403.
Chevalier, L., S. Calloch, F. Hild, and Y. Marco (2001). Digital image correlation used to analyze the multiax-ial behavior of rubber-like matermultiax-ials. Eur. J of Mech.
A-Solid 20(2), 169–187.
Dym, C.L. and I.H. Shames (1973). Solid Mechanics
A Variational Approach. McGraw-Hill Book Company.
Godin, N., S. Chaki, J. Courbon, S. Deschanel, S. Gillet, and B. Gautier (2009). Acoustic emission potenti-alities for characterization of mullins effect in natural rubber materials filled with carbon black. Polymer
Testing 28, 103–105.
Hild, F. (2002). Correlilmt: a software for displacement field measurements by digital image correlation. Tech-nical Report 254, LMT. Internal report.
Holzapfel, G.A. (2000). Nonlinear Solid Mechanics.
A continuum approach for engineering. J. Wiley and
Sons.
Le Cam, J.-B. and E. Toussaint (2008). Volume variation in stretched natural rubber: competition between cavi-tation and stress-induced crystallization.
Macromol-ecules 41(20), 7579–7583.
Marckmann, G. and E. Verron (2006). Comparison of hyperelastic models for rubberlike materials. Rubber
Chem. Technol. 79, 835–858.
Meunier, L., G. Chagnon, D. Favier, L. Orgéas, and P. Vacher (2008). Mechanical experimental characteri-zation and numerical modelling of an unfilled silicone rubber. Polymer Testing 27, 765–777.
Mooney, M. (1940). A theory of large elastic deforma-tion. J. Appl. Phys. 11, 582–592.
Mullins, L. (1948). Effect of stretching on the properties of rubber. Rubber Chem. Technol. 21, 281–300. Promma, N., B. Raka, M. Grédiac, E. Toussaint, J.-B. Le
Cam, X. Balandraud, and F. Hild (2009). Application of the virtual fields method to mechanical characteri-zation of elastomeric materials. Int. J. Solids Struct.
46, 698–715.
Sasso, M., G. Palmieri, G. Chiappini, and D. Amodio (2008). Characterization of hyperelastic rubber-like materials by biaxial and uniaxial stretching tests based on optical methods. Polymer Testing 27, 999–1004. Toussaint, E., M. Grédiac, and F. Pierron (2006). The
virtual fields method with piecewise virtual fields. Int.
J Mech. Sci. 48, 256–264.
Ward, I.M. and D.W. Hadley (1993). An Introduction
to the Mechanical Properties of Solid Polymers. John
Wiley and Sons Ltd. Figure 11. Identification of the material parameters C1