Design and implementation of Negative Authentication System
The MIT Faculty has made this article openly available.
Please share
how this access benefits you. Your story matters.
Citation
Dasgupta, Dipankar, Abhijit Kumar Nag, Denise Ferebee, Sanjib
Kumar Saha, Kul Prasad Subedi, Arunava Roy, Alvaro Madero,
Abel Sanchez, and John R. Williams. “Design and Implementation
of Negative Authentication System.” International Journal of
Information Security 18, no. 1 (November 21, 2017): 23–48.
As Published
https://doi.org/10.1007/s10207-017-0395-8
Publisher
Springer Berlin Heidelberg
Version
Author's final manuscript
Citable link
http://hdl.handle.net/1721.1/121000
Terms of Use
Creative Commons Attribution-Noncommercial-Share Alike
(will be inserted by the editor)
Design and Implementation of Negative Authentication
System
Dipankar Dasgupta · Abhijit Kumar Nag · Denise Ferebee · Sanjib Kumar Saha · Kul Prasad Subedi · Arunava Roy · Alvaro Madero · Abel Sanchez · John R. Williams
the date of receipt and acceptance should be inserted later
Abstract Modern society is mostly dependent on on-line activities like official or social communications, fund transfers and so on. Unauthorized system access is one of the utmost concerns than ever before in cyber sys-tems. For any cyber system, robust authentication is an absolute necessity for ensuring security and reliable access to all type of transactions. However, more than 80% of the current authentication systems are password based, and surprisingly, they are prone to direct and in-direct cracking via guessing or side channel attacks. The inspiration of Negative Authentication System (NAS) is based on the negative selection algorithm. In NAS, the password based authentication data for valid user-s iuser-s termed auser-s pauser-suser-sword profile or user-self-region (pouser-sitive profile); any element other than the self-region is
de-D. Dasgupta
The University of Memphis E-mail: [email protected] A. K. Nag (Corresponding Author)
Texas A&M-Central Texas E-mail: [email protected] D. Ferebee
The University of Memphis E-mail: [email protected] S. K. Saha
The University of Memphis E-mail: [email protected] K. P. Subedi
The University of Memphis E-mail: [email protected] A. Roy
The University of Memphis E-mail: [email protected]
A. Madero
Massachusetts Institute of Technology E-mail: [email protected]
A. Sanchez
Massachusetts Institute of Technology E-mail: [email protected] J. Williams
Massachusetts Institute of Technology E-mail: [email protected]
fined as non-self-region in the same representative s-pace. The anti-password detectors are generated which covers most of the non-self-region. There are also some uncovered regions left in the non-self-region for induc-ing uncertainty to the attackers. In this work, we de-scribe the design and implementation of three approach-es of NAS and its efficacy over the other authentication methods. These three approaches represent three differ-ent ways to achieve obfuscation of password points with non-password space. The experiments are conducted with both real and simulated password profiles to jus-tify the efficiency of different implementations of NAS. Keywords Cyber-security · levels of abstraction · security event · passwords · authentication · negative authentication · hashing · salting
1 Introduction
Online activities, sensitive data transfers, official com-munication, activities containing delicate personal in-formation are increasing every day. Authenticity is the highest significant issue than ever before because of in-herent insecurity in online communication and trans-actions. For any computing systems, servers or online storage, proper authentication is an absolute necessi-ty for ensuring legitimate access, privacy, securinecessi-ty, and reliability.
Although password-based authentication systems are the oldest and most popular among all other methods of authentication, it is very vulnerable to a wide variety of attacks. The majority of the password-based authen-tication systems store the positive authenauthen-tication data (password profile) in the database server, and every ac-cess request to that server is authenticated by compar-ing that request with the existcompar-ing password data [33].
One of the basic problems of positive authentication is the risk of malicious access to the password profile. Any person who has stolen files of hashed passwords can of-ten use brute-force methods to find out a password p whose hash value H(p) is equal to the hash value s-tored for a given user’s password, thus allowing him/her to impersonate the legitimate user. Various password cracking methods have been reported to be successful in cracking hashed passwords. Also, a side-channel attack of stealing password profiles is a severe threat to secure authentication and access control. A recent report from SANS Institute [27] illustrates the statistics of cracking different hashed passwords using different approaches. Password cracking was also instrumental, in a recent cyber espionage campaign against the New York Times [30]. A 2008 study [19] of online black markets found a vibrant economy trading in stolen passwords. Due to the widespread re-use of passwords across multiple web-sites [4], an emerging attack model is to compromise accounts by a guessing attack against a low-security website and attempt to re-use the credentials at criti-cal internet sites [2]. In addition to that, other possible scenarios can trigger the attacks on passwords. A large number of naive users choose passwords very poorly. There are many cases that some anonymous person suc-cessfully impersonates at least some users of a system by attempting logins with common passwords [3]. This situation can be avoided by requiring users to use un-common passwords [31].
This paper focuses on designing and implementing a negative authentication system that can easily be in-tegrated with the current password based authentica-tion system by providing an addiauthentica-tional layer before the positive password database. The details of different ver-sions of NAS and their implementations are illustrated in this paper. The experiments are conducted with real-world password data, and the results are described to justify the three different designs of NAS. The paper is separated into seven parts. Section 2 covers the overall concept of Negative Authentication System. Section 3 highlights the three different approaches of NAS at the high level. Section 4 demonstrates the detail insights of these three approaches. Section 5 demonstrates the architectural design to implement the NAS algorithm-s. Section 6 covers the experimental design and dis-cussion of the results. Section 7 shows some significant difference of the NAS approach with Positive Authenti-cation. Section 8 illustrates the reliability and validity of NAS approaches and comparison of other contem-porary password based approaches. Section 9 provides concluding remarks regarding NAS approach.
2 Negative Authentication System (NAS) The idea of Negative Authentication System (NAS) is based on the negative selection algorithm [18, 13, 22, 11]. This idea of the negative selection algorithm is in-spired from the T-cell maturation procedure in the im-mune system. A T-cell is eliminated before deploying functionality if a T-cell in thymus recognizes any self-cell. The fundamental principle of the Negative Selec-tion Algorithm is as follows [10]:
1. Define the set S (Self ) as the regular pattern of activity of a system which needs to be monitored. 2. Generate a set D (Detector ); those must not match
any element from S.
3. The set S is continually monitored for changes. The detector set D is adjusted if any change occurs in S.
Likewise, the negative selection algorithm generates a set of ’detectors’ where no detector has any similari-ty with the ‘self ’set. Here, the ‘self’set consists of the authentication data denoted as ‘password points’and hence ‘detector’set consists of other elements exclud-ing the proper authentication data. Now, the generated detectors are used to detect any other element than the authentication data. These detectors consequently recognize malicious access request by using the same matching rule used for authentication purpose. So, this algorithm requires only available training data, and af-ter that, it can be used as an anomaly detection algo-rithm [10]. Valid credentials or ‘self’set are termed as ‘positive information’, and ‘detector’set are the creden-tials that are non-valid are termed as ’negative informa-tion’. Briefly, user identities are confirmed not by using valid or positive information rather by using of negative information.
Fig. 1: The password space (Self region) and anti-password space (Non-self region) shown in
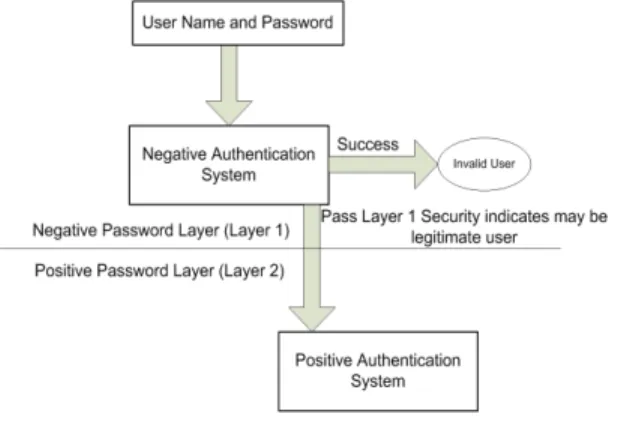
In NAS, ‘self’set or data that contains the password based authentication data for valid users is termed as either password file, self-space or self-region. All other elements that do not belong in the self-region creates the non-self-space or non-self-region. Some elements are created by using NAS to cover those non-self-regions. These elements are either called detectors, anti-passwords or anti-password region. Some areas in the non-self-region are left uncovered to induce ambiguity to the attackers. It is desired to generate detectors to cover most of the non-self-region and thereby increase the detection rate of invalid access requests (Fig. 1).
Fig. 2: Different security layers of NAS separating the detector region and self-region
NAS uses two servers for the validation of the ac-cess request. The self-region and anti-password region are kept in separate servers for enhancement of securi-ty of the authentication system (Fig. 2). The negative detectors that check for guessing attacks are stored on the first server that handles all incoming requests. The first server contains only the detectors and no other in-formation (Fig. 2). Every access request arrives at the first server and is checked with the detectors. If any ac-cess request information is matched with any detector, then that access request is marked as an invalid request. Otherwise, that request is sent to the next server that contains the password based authentication data. This server checks the request, and if it finds a match, then it marks it as a valid request (Fig. 3). In this way, there is no direct communication between the requests and the positive authentication server (second server). But, the communication between the first server and the sec-ond server is transparent to the users. So, the user ex-perience remains the same as the previous method of positive authentication.
This profile represents the negative abstraction of valid credentials and is the problem specific realization of the negative database described by [14]. This nega-tive authentication for a system login application has been tested successfully workable [8]. This negative
ap-Fig. 3: Logical view of negative (anti-password space) and positive (password space)
authentication NAS layers
proach has some benefits over the traditional positive authentication approach. The negative authentication module is supposed to detect and filter out most of the invalid requests, therefore, such guessing request-s have a low probability of accerequest-srequest-sing the porequest-sitive au-thentication module. Furthermore, negative detectors are placed in the front security perimeter. So, the neg-ative detectors become vulnerable to malicious access and hence more vulnerable to offline guessing attacks. But,getting a copy of the negative detectors does not reveal any information to the positive password file due to the ambiguity introduced intentionally in their (de-tectors) generation. Therefore, exposing the negative detector upfront reduces the overall password crack-ing risk. Hence NAS can significantly benefit from side channel attacks of passwords. Also, the password file that contains the authentication data resides in the sec-ond server and is never exposed to the outside of NAS which ensures that the positive profile is safer than be-ing compromised.
3 Different Approaches of NAS
There are different approaches of the Negative Authen-tication System (NAS)based on representation of pass-word space. The main focus of these approaches is to generate negative detectors to cover most of the non-self-region and increase the detection rate of invalid ac-cess requests. Each approach maps the information in different representation space. In this current research, we consider three representational space and develop three approaches for NAS: Real-valued, Binary-valued, and Grid-based. In this paper, the first two approaches are considered non-deterministic in terms of detector
creation while the third approach is a deterministic ap-proach to create the set of detectors. Various apap-proach- approach-es create various sized detectors and provide a different layer of obfuscation against compromise of password data.The details of each of these approaches are dis-cussed in the following subsections.
3.1 Real-valued NAS (R-NAS)
The real valued space model is a hypersphere based non-deterministic model of NAS. This model uses n di-mensional real space model to represent self-region and detectors. Both detectors and self-regions are some hy-percube of n ∈ Z+dimensions [23, 24]. Non-self-region,
not covering any detectors is also of n dimensions. Here, dimension means the encrypted and segmented login information which is clearly shown in Fig. 4a. From Fig. 4a, it is clear that the initial login information are the username and the password. Then using the tech-nique described in Fig. 8, the hashed (encrypted) lo-gin information can be generated. The encrypted lolo-gin information are then divided into n segmented, which can be considered as the dimension. For example, if the length of the encrypted login information is 128 bits and it is segmented into four 32 bit segments, then the di-mension of the space is 4. The normalized value of each segment in the real valued space model is spread over [0,1]. To create the set of detectors, points are chosen from the non-self-region that is not covered by any ex-isting detectors. The radius of the detector is chosen in such a way so that the hypersphere will not overlap with the self-region. The Overlap may be allowed among the detectors. Fig. 4b also shows a 2-dimensional projection of a real space model implementation with self-points (self-region) and detectors. However, the remaining por-tion of Fig. 4b demonstrates the 2-dimensional non-self-region. Here, the real valued space implementation uses Euclidean distance for calculation of the distance between any two points in the space.
3.2 Binary-valued NAS (B-NAS)
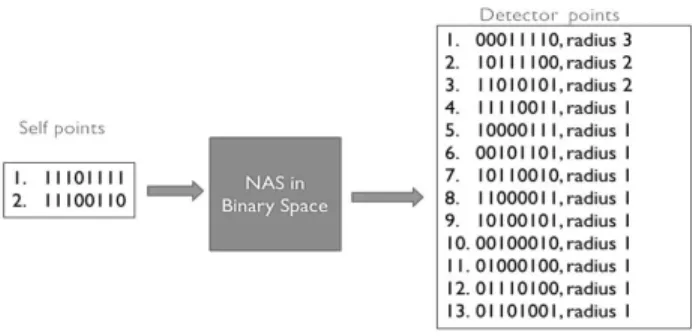
The binary valued space model is hypercube based non-deterministic model of NAS. This model is inspired from the original V-Detector algorithm [24]. Binary val-ued space model is a discrete space model and uses on-ly two values for each dimension; either 0 or 1. This model uses n-dimensional binary space, where n is the length of the representation string (encrypted user formation). Therefore, different username-password in-formation will not be mapped to a same point in the represented binary space. A Total number of elements
in the binary valued space model is 2n, where n is the
dimension of the space. A sample illustration of binary space is shown in (Fig. 5), where n=3. To create the detectors, points are chosen from the non-self-region of the binary space that is not covered by any existing set of detectors. The radius of a detector is chosen in such a way that the hypercube representing that detec-tor will not overlap with the existing self-region. These generated detectors cover some portion of the non-self-region. Overlaps among the detectors may be allowed. This model uses Hamming distance as a distance mea-sure between any two points in the space. The Ham-ming distance between two entities of equal length is the number of positions at which the corresponding bits are different. An example of Hamming distance calculation is shown in (Fig. 6).In Fig. 6, the two eight binary dig-it numbers have four posdig-itions where the bdig-its differ to each other. Hence, the hamming distance between these two numbers are 4.The differed positions are shown in bold in the figure.
Fig. 5: Binary Space in three dimensional space.
Fig. 6: Hamming Distance calculation as a distance measure.
3.3 Grid-based NAS (G-NAS)
Grid based implementation is a deterministic model of NAS [9]. The idea of Grid based approach for NAS is
Fig. 7: Sample display of self-region and detector region in Grid Space. Here gray boxes
are detectors and white boxes are self-points.
inspired from work by Williams et al. 2004. This Grid-based NAS model is designed in a way so that, there is no overlap among the detectors. It represents the pass-word space in a square grid (N × N matrix, where N ∈ Z+). The Grid is stored as a 2-dimensional
in-teger array with a specified dimension. We can choose the optimum grid size to divide the space according to the obfuscation level to be achieved. For example, the size of the grid can be considered as 512 × 512 or 256 × 256 etc. Self-points that are mapped to particular cells are identified by row number and column number), increases the value of that position by 1. Hence, any cel-l as vacel-lue M >= 1, means M secel-lf-points are mapped to that particular grid. The cells for non-self-points are easily identified with the value that they contain (here the value is 0).
We store the (x, y) coordinates of the cell for each password for the positive space, for N username-passwords we store N coordinates and the grid size is stored once for the entire space. The complexity of the algorithm to generate the negative detectors is O(N ) or less. We start at a cell occupied by a positive cell (where M > 0) and define a run connecting series of cells (say along the x-axis) until we hit another positive cell. We encode the run-length of cells using only the beginning and end cell ids. Thus, the storage we require to define the complete negative space will be no greater than 2 × N + some small constant brought in by runs that end on boundaries of the space. If we combine x and y co-ordinate runs, we will get even larger com-pression. Thus, even though the negative space is much bigger than the positive space we can define it for our purposes in terms of the N cells of the positive space.
Detectors are created by scanning the Grid once and keeping track of the cells that have their corresponding M equal to zero. Consecutive cells of corresponding “M equal to zero” in a row are considered as one detector and its run-length is calculated with the number of con-secutive cells. In the Grid based implementation, it is possible to increase or decrease the detectors’ coverage by changing the grid dimension.
Detectors generated from this implementation are stored with their run-length and the starting index. In our implementation, the detectors are saved in row-wise format and each row, the detector is stored with the s-tarting column index and run length. The benefit of using row-wise format is, to find a particular point in the space, the row of that point can be determined eaily from the hashing of the password and the search s-pace is reduced to that specific row to check whether it falls in a detector cell or self-point grid. This approach also compresses the space required to store the total detector region, and the region can be reconstructed easily from the saved information of the detector space. A sample grid based representation is shown in Fig. 7. Fig. 7 shows the self-region and detector region in Grid space. The gray boxes are detectors (negative space) and the white boxes are self-points (positive space) in the sample representation of the grid space. The details of the grid space and generation of positive grids and detector grids are discussed in later section.
4 Implementation of Negative Authentication System (NAS)
All of the approaches discussed in the previous sections were implemented and tested in the lab environmen-t. The self-regions in these implementations consist of username-password points termed as self-points. The Implementation details of the approaches are discussed in the following sections.
Hashed string generation
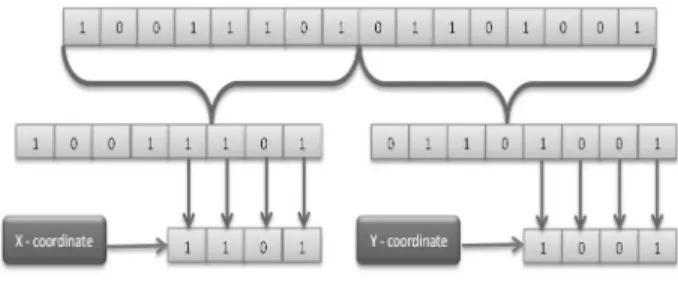
The username and password pairs are converted to cor-responding self-point of the representing space model. Password is hashed with the specified hashing algorith-m. Unique (dynamic) salts are added with hashed pass-words and hashed again. The Corresponding username is added with last hashed output and hashed for the last time after adding a fixed (static) salt. The process is shown in Fig. 8. Self-points are created from these hashed string output using the implementation specific approaches.
Confusion parameter
The derived self-points are usually a single point in the model space. To induce some level of obfuscation, each self-point is surrounded by some of its neighboring re-gions. For real and binary valued space models, every self-point forms a hypersphere having a radius spec-ified in implementations and center as the self-point itself. The higher confusion parameter shrinks the non-self-region but the total number of detectors does not decrease significantly. The number of detectors depends on the interleaving gaps between hyperspheres, rather than by the total area of non-self-region, as long as this total area does not become too small. As the random-ness of hashed self-points are uniformly distributed [35] within the required n-dimensional space (because of the one-way hash function property), the confusion param-eter appears to have little effect on the detector set size [12]. For grid space model, every self-point is mapped to a grid cell and the whole cell is defined as self-cell or self-grid, the size of the self-grids (depends on the grid size) is considered as the confusion parameter for the grid model.
Detector Coverage
Detector coverage can be defined as the volume of the non-self-space covered by the detectors. In the present work, the detector coverage has been normalized be-tween 0 and 1. In this work, the detector coverage has been calculated using the Monte-Carlo simulation tech-nique [28].
4.1 R-NAS Implementation
In real space implementation of NAS, a 4-dimensional real space model is implemented to map the total s-pace. Though the real space model is a continuous space model, in the implementation, only predefined places after the decimal point are considered (typically 3 to 5 places). Self-region is defined by self-points that are hashed output of username and password. Every hashed string is divided into four segments to be mapped into the 4-dimensional real space. Coordinates of the self-point are calculated by normalizing each part of the hashed strings from 0 to 1 (Fig. 9). Each self-point forms a hypersphere with a small radius. This radius is defined as confusion parameter.
The non-self-region is created by the implemented R-NAS algorithm. This algorithm generates the detec-tors to cover the non-self-region. Each detector consists of a center, and a radius and so defines a hypersphere
of 4-dimension. Both self-points and detectors form hy-perspheres. The radius of self-points is defined as con-fusion parameter. The center and radius of detectors are generated in such a way so that detectors can over-lap with each other, but they cannot overover-lap with the region of any self-points. The pseudo-code for the real space implementation algorithm is given in appendix (Fig. 26).The input and output of the detector genera-tion algorithm are mengenera-tioned in the pseudo-code. Code block in line 8-12 checks whether candidate detector, ’x’ falls in the existing list of detectors. If that falls, the failed count will be increased to keep track of to-tal failed attempts. Code block in line 13-18 computes the minimum distance among all the self-points and the candidate detector, x. Code block in line 20-28 checks the overlap with the candidate detector, x with other existing detectors and decides whether it can be includ-ed in the existing detector set. Code block in line 29-32 adds the candidate detector, x to the detector set and checks the termination criteria to exit or not. The final set of detectors is then returned.
4.1.1 Confusion Parameter for R-NAS
This term defines the radius of the self-spheres creat-ed using the self-points in the real space. Accordingly, the value of the confusion parameter controls the vol-ume of self-point. Usually, a small value is chosen for the confusion parameter so that the self-region remains negligible compared to the total space [12]. In the re-al space implementation, confusion parameter is set as the minimum value possible (e.g. if four places after a decimal point is considered, then confusion parameter is set as 0.0001).
4.1.2 Expected Coverage of Non-self space
Expected coverage is the term that controls the portion of non-self-region covered by the detectors and it can be defined as the following ratio:
Sum of detectors’ regions coverage excluding overlap 1 - sum of all self regions’ coverage
In NAS, some region from the non-self-region is not covered by the detectors to induce some obfuscation for the attackers. Generally 98% coverage is targeted while creating the detectors. As the detectors are created with allowing overlap, the actual coverage is smaller than 98%.
4.2 B-NAS Implementation
In binary valued space implementation of NAS, no two points will map to a single point in binary space. Based
on the password points (self-points), which are hashed output of username and password pair, the implement-ed algorithm calculates the non-self-detectors. Each de-tector consists of a center a(∈ non-self-region) and ra-dius r, where all the points from a with r hamming distance are the members of that detector. These gener-ated detectors cover some portion of the non-self-space (negative space). In this implementation, it is assumed that both the self-points and detectors are hyper-cube. Detectors can overlap with each other but they cannot overlap with the volume of self-points. Because of this radius, a self-point or a detector is not a single point in the space; in fact, it is composed of many points in the space. A sample scenario of self-point and detectors in reference to the NAS are given below (Fig. 10). In Fig. 10, two self-points are mentioned with their radius 1. If we set the detectors’ coverage to 60 percent, the count of detectors required to covered the anti-password region is 13, which is shown in the figure along with their individual detector radius.
The pseudo-code for the binary space implementa-tion algorithm is given in Appendix (Fig. 27).
The input and output of the detector generation al-gorithm are mentioned in the pseudo-code. Code block in line 8-12 checks whether candidate detector, ’x’ falls in the existing list of detectors. If that falls, the failed count will be increased to keep track of total failed at-tempts. Code block in line 13-18 computes the mini-mum distance among all the self-points and the candi-date detector, x point. Code block in line 20-26 checks the overlap with the candidate detector, x with other existing detectors and decides whether it can be includ-ed in the existing detector set. Code block in line 28-31 adds the candidate detector, x to the detector set and checks the termination criteria to exit or not. The final set of detectors is then returned. Some relevant terms of B-NAS is discussed in the following subsections: 4.2.1 Confusion Parameter for B-NAS
This term defines the radius of self-points in the binary space. In the binary space implementation, confusion parameter is set to 5 (subtle value in comparison with the total dimension of the space).
4.2.2 Expected Coverage of Non-self space
In binary space, detector coverage is approximated as a normal distribution [26]. For this distribution, mean is N/2 and Standard Deviation ispN/2, where N is the dimension of the space. The coverage of a detector of radius ’r’ (r << N ) is shown pictorially in the Fig. 11. The gray area denotes the coverage (or volume) of the detector in the total representative space.
Fig. 10: Sample detector space Generated using binary implementation of NAS. The configuration are Dimension=8, total
self-points=2, Detectors minimum coverage=0.60, self-point radius=1.
Fig. 11: The gray area shows the volume of the detector with radius r.
4.3 Modification of the self-region for R-NAS and B-NAS
To remove some existing self-points in real and bina-ry space implementations, the marked to be removed self-points are simply removed from the existing set of self-points. If the number of removed self-points exceeds a threshold, then the detector set is generated again to cover up the empty spaces and to create larger detector spheres. The pseudo-code is given in appendix for re-moving a self-point(Fig. 28). According to pseudo-code, if the total number of self-points after the removal is less than a given threshold value, the detector set will be generated again with the given list of self-points. Otherwise, existing detector set can be considered as current detector set.
The case is slightly different if some new self-points are added in the self-region. All detectors are removed that collide with the new self-points and then detectors are generated again with the new self-point set and the existing detector set to cover the vacant non-self-region.
When the number of added self-points crosses a thresh-old limit, the detector set is generated again from the scratch to get rid of the smaller detectors and merge them in larger ones. This idea is shown in the given pseudo-code in Appendix (Fig. 29).
To update some existing points, the old self-point entries are removed and the updated self-self-point entries are added in the self-region. Corresponding step-s for removal and addition of step-self-pointstep-s are taken astep-s described previously. Again, the total detector set is re-generated when the number of self-point update crosses a threshold to minimize the number of smaller detec-tors. This concept is shown in the given pseudo-code in Appendix (Fig. 30).
4.4 G-NAS Implementation
As discussed in the previous section, grid approach uses a two-dimensional N ×N Grid to model the total space. At first, the self-region is mapped to the grid space and later the detectors are formed from the un-occupied non-self-region.
4.4.1 Represent the space in Grid
The Grid is stored as a two dimensional array of in-tegers with a specified dimension. Self-points that are mapped to particular grids (grids are identified by row number and column number), increases the occupancy value of that grid by 1. Hence, any grid of ith row and jth column having occupancy value (Mi,j) greater than
1 means the grid is not empty and some Mi,jself-points
are mapped to that particular grid. The non-self-region grids are easily identified when their occupancy value is 0; indicating no self-points being mapped to that grid. 4.4.2 Confusion parameter in G-NAS
In grid space implementation, there are space size for a two-dimensional N × N Grid is N2grids, but, the total
possible space size is 2n, where n is the length of the
representation string of a self-point. Therefore, every grid is mapped by (2n/N2) possible points. For every
grid containing m self-points, ((2n/N2) -m) ≈(2n/N2)
points are considered as the confusion parameter. 4.4.3 Detection of Non-Self-Region in G-NAS
The grids that are not covered by the self-points are considered as the region. Hence, the non-self-region is created in constant time after getting the grids occupied by self-points. This is one of the advantages of
grid based implementation over other implementation-s of NAS. Detectorimplementation-s can be generated by implementation-scanning the grid once and having consecutive grids in a row with oc-cupancy value 0 considered as one detector. Run-length of each detector is determined by the count of consec-utive grids in the detector.
In grid implementation, non-self-grids cover the to-tal non-self-region. If only a fixed percentage of the anti-password region is desired to be covered, some detectors are marked for removal. In order to do that, detectors with minimum run-length are removed from detector list at first and the new achieved coverage is calculat-ed. This process will go on until the expected coverage is achieved. This whole process can be performed with a single scan of the whole Grid and removing the de-tectors with the given run-length calculated at first. In the Grid based implementation, it is possible to increase or decrease the detectors’ coverage with only a single scan through the Grid. It also indicates another advan-tage over the hypersphere based implementations [24], where the detectors are required to be generated from the beginning to get the necessary coverage value. 4.4.4 Saving the Detector Space
Detectors generated from the grid space implementa-tion are stored by their run-length and starting index. In the implementation presented in this work, the de-tectors are saved in row-wise format and, in each row, the detector is stored with the starting column index and run length. The benefit of using row-wise format is, to find a particular point in the space, the row of that point can easily be determined and the search s-pace is reduced to that row only to check whether it falls in a detector grid or self-point grid. This approach also does the compression of the space to store the w-hole detector region and it can be easily reconstructed from the saved information of the detector space. 4.4.5 Visual representation of a simulation of G-NAS As discussed above, initially self-points are mapped in the grid space. The simulation involves a grid with 32 × 32 dimension and 500 self-points. It uses 256 bit SHA-256 encryption algorithm to get self-points. Then, the detectors are created to cover the non-self-space. After the creation of detectors, some detectors are re-moved from the detector list. This is done so that de-tectors do not cover the entire non-self-region. Some re-gions are left uncovered to induce ambiguity for attack-ers so that they cannot find out the self-region quickly. Fig. 12 shows the generated self-points (dark gray), de-tectors (black) and candidate detector for removal from
detector list (light gray - all detectors with run-length 1 and 2 in this example) in the grid. Only the surviving detectors (black blocks) will be saved for the NAS. To increase the obfuscation level, smaller detectors (light gray blocks) can be omitted for saving space.
Fig. 12: Self-points (dark-gray), detectors(black), and candidate detectors marked for removal (light gray) of run-length up to 2 in the 32 × 32 Grid. Here 390 grids are dark gray grids, 412 grids are black grids, and 222
grids are light-gray grids with run-length 1 and 2.
4.4.6 Mapping of Self-points to Grid
Three different approaches of grid based implementa-tion have been implemented and tested. They are:
– Mod-based approach – Two-layer approach – XOR-based approach
All grids are 2-dimensional with dimensions of 2i×2i,
where the value of i is dependent on the number of user information (self-points). In each of the cases, the hashed self-point string is divided into two halves. But the data in each half is processed differently in these implementations.
4.4.7 Mod-based G-NAS
In this method, each part of the divided hashed string of the self-point is considered. Last i bits are taken from the binary representation of each of the parts. This value denoted by these i bits provides the modulus if the string was divided by 2i. Then both of the
part-ed string is convertpart-ed into corresponding values. This
self-point is mapped in the grid using those comput-ed values. Other bits are simply discardcomput-ed from any computation. Here the projection scheme is fixed for every possible self-points unless the grid dimension is changed.The pseudo-code of the Mod-based projection algorithm showing the above concept is given in ap-pendix (Fig. 31).
An example of the mod based approach of the Grid based implementation is illustrated in the Fig. 13. For example, it is assumed that the hashing function pro-duces a binary string of length 16. The string is divid-ed in two parts. Suppose the dimension of the grid is 16 × 16 (= 24×24). So, the last four bits from each
part is considered. The value of these four bits resem-bles the reminder if the part is divided by 16( =24). In this example, the first part produces (1101)2i.e. 13 and
the second part produces (1001)2, i.e. 9, so, the string
will map to the cell (13, 9) in the grid.
Fig. 13: Mod based approach of mapping points in the Grid.
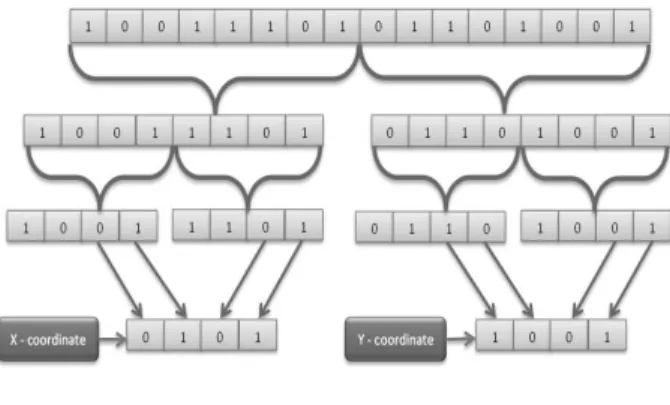
4.4.8 Two-layer based G-NAS
Each part of the divided hashed string is further divid-ed in two equal sub-parts. Last i/2 bits are taken from the binary representation of each of the sub-parts. Both of the i/2 bit length binary substrings are concatenated to from a i bit length binary string. This binary string is converted into corresponding value. The same proce-dure is done with the other part of the hashed string. Both the values are then used to map the self-point in the grid. All other bits are discarded. Again, the projec-tion scheme is fixed for every possible self-points unless the grid dimension is changed. The pseudo-code of the two-layer based projection algorithm showing the above concept is given in appendix (Fig. 32).
An example of the two layer based approach of the Grid based implementation is illustrated in the Fig. 14. For example, it is assumed that the hashing function produces a binary string of length 16. The string is
divided in two parts. Each part is again divided into two equal sub-parts. Suppose the dimension of the grid is 16×16 (= 24×24). So, the last two bits from each
sub-parts is taken in consideration. The same procedure is repeated in the other part of the string. In this example, the first part produces (0101)2, i.e. 5 and the second
part produces (0101)2, i.e., 9. So, the string will map
to the cell (5,9) in the grid.
Fig. 14: Two-layer based approach of mapping points in the Grid.
The pseudo-code of the two-layer based projection algorithm is given in appendix (Fig. 32).
4.4.9 XOR-based G-NAS
Initially, i positions are randomly selected from the hashed string. Then, for each half of the hashed string, every j (power of 2) consecutive bits are XOR-ed and replaced by the result. That leaves each of the halved hashed binary string compressed in a ratio of j to 1. From the compressed string, bits from the selected po-sitions are concatenated. That produces a binary string of length i. This binary string is converted into corre-sponding value. Both values are used to map the self-point mapped in the grid. All the self-self-point hashed string uses the same i positions selected at the begin-ning. More bit information is involved in the mapping of self-points in this projection approach. This projec-tion scheme chooses new random posiprojec-tions every time the scheme is initiated. So this scheme will also produce different projection for the same password in separate implementations. The pseudo-code of the XOR- based projection algorithm showing the above concept is giv-en in appgiv-endix (Fig. 33).
An example of the XOR-based approach of the Grid based implementation is illustrated in the Fig. 15. For example, it is assumed that the hashing function pro-duces a binary string of length 32. This example shows
a scenario with a compression ratio of 2: 1. Every two consecutive bits are XOR-ed to produce the new string. So the new string has a length of 16. The string is di-vided into two parts. Suppose the dimension of the grid is 16 × 16 (= 24×24) and four random bit positions are
1, 4, 6 and 7. So, bits from those positions are taken in order. The same procedure is repeated in the other part of the string. In this example, the first part produces (1111)2 i.e. 15 and the second part produces (0101)2
i.e. 5. So, the string will map to the cell (15, 5) in the grid.
The pseudo-code of the XOR based projection
algo-Fig. 15: XOR based approach of mapping points in the Grid.
rithm is given in appendix (Fig. 33).
5 Architectural Details about Implementing Prototype System
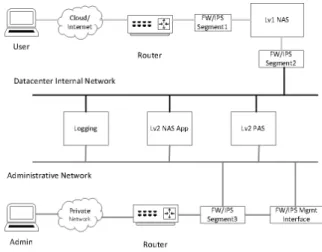
For prototype purposes, all the implementation has been designed and implemented in a virtual infrastructure. Every server and access terminal is deployed as a virtual machine with network interfaces. Through these inter-faces, each VM is connected to virtual switches that represent the network segments as shown in Fig. 16.
In the network layout, there are three main net-work segments, which are administrative netnet-work, data-center internal network, and access network. These net-work segments are created using three Firewalls (FW) / Intrusion Prevention Systems (IPS), which are present in all three segments.
The administrative network is basically a private network consisting of an administrator machine, router-s, FW/IPS Segment 3, and FW/IPS Management In-terface. The administrator device has access to Lv2
Fig. 16: Different Components shown in the Network Layout.
NAS App server to create user accounts as well as to create or update the anti-password database. Any new-ly created or modified user accounts are stored in Lv2 Positive Authentication Server (PAS). These user ac-counts are used to generate anti-password data using Lv2 NAS App server and pushed to Lv1 NAS Server.
The data-center internal network has four compo-nents which are: Logging Server, Lv2 NAS App Serv-er, Lv2 PAS, and FW/IPS Segment 2. Lv2 NAS App Server and Lv2 PAS are mentioned while describing the administrative network, whereas these two components are crucial for the functionality of the system.
As for the access network, it has direct access to the clients from the outside network such as the Inter-net. This network has three components which are Lv1 NAS Server, FW/IPS Segment 1, and router. As men-tioned above, Lv1 NAS Server receives anti-password data from Lv2 NAS App server, and this data is used to validate the authenticity of the clients at the access network.
The NAS is composed of seven different compo-nents. These are as follows:
1. NAS Clients
2. Lvl1 NAS Detector Server 3. Lvl2 NAS Application Server 4. Lvl2 Positive Authentication Server 5. NAS Log Server
6. NAS Scheduler Database 7. NAS Database
The details of each of these components are discussed in the next sections.
5.1 Layer 1 Components 5.1.1 NAS Clients NAS Web Client
The login page requests username and password for users that want to access the system. After the creden-tials are submitted, the page then uses them to generate the self-point for that user using the same process that was used by the Level two server that created the de-tectors. The dynamic salt for each user is looked-up in memcached using the digest that results from hashing the concatenation of user and static salt. After obtain-ing the dynamic salt, it is concatenated to the input password, then it is hashed and the result is concate-nated to the username and hashed again to obtain the digest. Depending on the type of implementation cho-sen, the appropriate algorithm to process the digest is used. The resulting self-point is then compared against the set of detectors to look for a match. If a match is found, the login is unsuccessful. If it does not match any detectors, it passes on to the next layer. The same web page executes a call to a stored procedure on the second layer to get the positive authentication of the user.
The login page returns the result of both the neg-ative and positive authentications along with the sum-mary of the detector results and the self-point. In a production implementation, this data should only be used for diagnostic purposes and the user should only see the result of the authentication, either success or failure.
NAS Windows Client
The Windows 8 Client is running the pGina Creden-tial Provider replacement to allow easy access to the login interface. We have coded a pGina plugin in C# to contact the Lvl1 NAS Detector Server and the Lvl2 Positive Authentication Server. This allows us to use any authentication mechanism on the server and re-turn if the user is allowed or denied access. Due to the simple socket connection of the client, the Lvl1 NAS Detector Server can be reused from previous proof of concept with only minor code changes.
5.1.2 Lvl1 NAS Detector Server
Lvll1 NAS Detector Server is a PHP server that com-municates with Memcached to get the current NAS De-tectors. The user account information that is provided to NAS Windows Client is validated against the detec-tors. If there is a match, the user access is not allowed.
If there is not a match, the user credentials are then compared to the Lvl2 Positive Authentication Server-s (PAS) uServer-ser account information. Currently, we are using a Microsoft Active Directory server for positive authentication.
5.2 Layer 2 Components
5.2.1 Lvl2 NAS Application Server
We implemented the Layer2 Negative Authentication Application (L2NAA) for Linux 2.4/2.6 platform in-cluding CentOS 6.4. The implementation of the L2NAA is designed to manage user account, create an anti-password database, push the anti-anti-password database to Layer 1 Server, view statistics, and logs, and configure input and preference parameters.
5.2.2 Lvl2 Positive Authentication Server
In the NAS architecture, Microsofts Active Directory Server fulfills the requirement of a positive authentica-tion source. As part of the NAS implementaauthentica-tion, Ac-tive Directory LDIF entries were updated to contain the userPassword attribute. This attribute was used to provide the user accounts hashed password. The hashed password will be used to create the self-points needed by the NAS application. In order to use the userPassword attribute (i.e., to make it retrievable by the directory search), we had to set the dSHeuristic to false for the fUserPwdSupport entry.
5.2.3 NAS Log Server
This module shows the number of anti-password based on different algorithms. Logs are stored in ArcSight Logger. Logs stored in ArcSight Logger can be used for future forensic analysis. Arcsight Logger dashboards have been configured to show the most relevant infor-mation from the status messages. Column graphs show users trying to log in in Lvl1NAS and Lvl2PAS. Pie charts show the successful vs. failed login attempts in Lvl1 and Lvl2. Going forward, a better coverage of Lvl1 will reduce the failures in Lvl2.
5.2.4 NAS Scheduler Database
The quartz framework is used to schedule and run the jobs in the system. We have a fixed number of jobs in the system. These jobs are configurable based on the valid ’cron’ expression.
5.2.5 NAS Database
This module is used to generate and store anti-password database using different algorithms such as BNAS, R-NAS, and GNAS.
5.3 Account Creation and Authentication Flow The account creation and authentication processes are shown in Fig. 17. There are two sections below that give a description of the account creation and authentication flow. To achieve an account creation, the administrator must complete the five steps mentioned below to upload the negative database to NAS L1 Server.
When clients request to access resources they go through layers 1 and 2, which is called a client authen-tication process. Below there is a description of this process given in three steps, and there is also an illus-tration found in Fig. 17.
Fig. 17: The Steps of Authentication process in NAS.
5.3.1 Account Creation Flow
The administrator creates user accounts using steps 1, 2, 3, 4, and 5, and these steps are described below:
– 1: After the user account is created, static salt is concatenated with User-name (ID) and password for self-point creation.
– 2: Hashed ID (i.e. static salt, user name, and pass-word) passed to NAS Database.
– 3: User account information is passed to the Positive Authentication System (PAS).
– 4: Detectors are created using the Hashed user in-formation from NAS Database.
– 5: Detector list is passed to NAS L1.
5.3.2 Authentication Process Flow
The clients are authenticated using steps 1’, 2’, and 3’, and these steps are described below:
– 1’: ID and password are provided to NAS Ll for authentication.
– 2’: ID and password are concatenated with static salt (i.e. application private key).This information is converted to a point and checked with the list of detectors. If the point does not fall into any de-tectors, the user credentials are passed through the firewall. Otherwise, this access request is denied. – 3’: PAS user credentials are validated, and if valid,
an authentication token is passed.
6 Experimental Design and Results 6.1 Experimental Setup
A dataset of 33 million user passwords is used as the source of the passwords used for simulations. This dataset is extracted from SkullSecurity [32] website. This is a dataset of exposed user password of RockYou site [7]. As these passwords belonged to a real authentication system, so this dataset can be used to simulate a re-al password-based authentication system. To generate the usernames, another dataset of most common names of U.S. is used [5]. This dataset includes all sur-names with over 0.001% frequency in the US popula-tion during the 1990 census. The performances of each configuration are indicated by the detector coverage. Detector coverage is the percentage of spaces covered by the algorithms. In other sense, it is the probabili-ty of a particular algorithm configuration of detecting an unauthorized user. All rates are calculated from the average of 20 runs by using Monte Carlo Simulation [28] with one hundred thousand trials for each configu-ration. The coverage by the detectors is calculated by using the following ratio:
total number of trials detected by the generated detectors total number of trials
The False rate can also be calculated by subtracting the coverage from 1 (one).
6.2 Evaluation Criteria
Three different implementations of NAS presented in this paper are evaluated based on the following criteri-a:
- The coverage of the approaches with different num-ber of self-points (positive password) with varying their confusion parameter.
- False positive rate.
- The time required generating the set of detectors. - Detection time.
- Detectors’ storage size.
The details results for three different approaches are discussed separately in later subsections. The compari-son of three implemented approaches are illustrated in 6.6.
6.3 R-NAS Results
Experiments for real space implementation of NAS are done with different number of self-points generated from the mentioned dataset. The First experiment was con-ducted to show the relationship between self-point ra-dius and the detector coverage. This experiment was carried out with 1000, 3000 and 5000 self-points. The result is summarized in Table 1 and showed in Fig. 18. From Fig. 18, it can be seen that detector coverage
Fig. 18: Scatter diagram for coverage by detectors with different self-point radius.
decreases slightly with the increment of the self-point radius. This self-point radius is also known as the con-fusion parameter. The reason behind this result is as follows: self-point radius with larger value will occupy more spaces leaving less free spaces, causing detectors to have slightly smaller radius. So the detector
cover-Table 1: Difference in detector coverage with different self-point radius.
Detector Coverage(%) Self-point radius With 1000
self-points With 3000 self-points With 5000 self-points 0.001 79.11 70.25 65.04 0.002 79.23 70.13 64.04 0.004 78.33 67.97 62.93
age decreases a slightly with the increase of self-point radius.
Next result shows the relationship between the ac-tual detector coverage achieved with the expected de-tector coverage by the R-NAS algorithm. The expected coverage was varied from 85% to 98% for 1000, 3000 and 5000 self-points. The result is summarized in Ta-ble 2 and graphically represented in Fig. 19. We get the lower detector coverage value as many detectors are overlapped one another and the overlapping region covers the same space. But in our coverage calculation, only overlaps with two detectors are measured. Hence the actual detector coverage value is lower in compari-son with the expected coverage value.
Fig. 19: Scatter diagram for achieved detector coverage by the generated detectors with
different expected detector coverage.
6.4 B-NAS Results
For binary space implementation, the average count of detectors is compared with different coverage value for detectors. The simulation is done with 1000 and 3000 self-points and two different hashing algorithms. The result is shown in Fig. 20. It is evident from the figure that, with the increase of the password points (self-points), the total number of detectors increases. Also, it
is noted that with the increase of the minimum coverage for a fixed number of self-points, the total number of detectors are increased. Additionally, the dimension of binary space plays a role in the total detector count. It is derived from the figure that, for 256 dimension space, the total number of detectors is less in number than that of 128 dimension space.
The reason is as follows. As the number of self-points and confusion parameter are fixed, for changing 256 di-mension from 128 didi-mension, the total number of points covering the non-self-space are increased exponentially. Hence the detectors created in 256 dimensions have a higher radius which covers more space in comparison with that of 128 dimensions. So the total numbers of detectors are going down in 256 dimensions to cover the same minimum coverage. One further observation is with the increase of self-points, the total number of detectors are also increasing for different encryption al-gorithms.
Fig. 20: Scatter diagram for total number of detectors with different expected coverage
value.
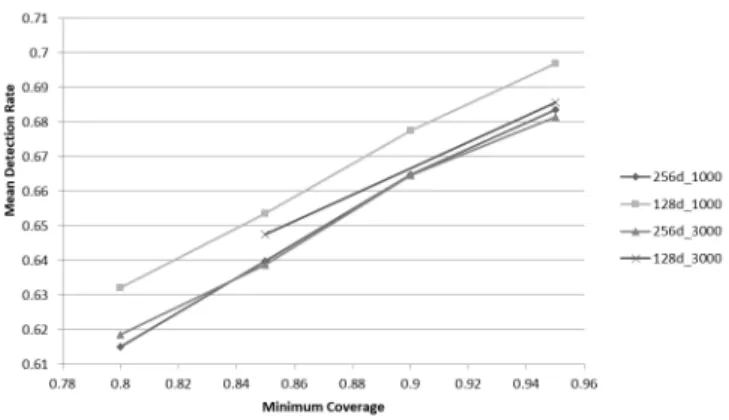
Mean detection rate for B-NAS implementation is compared with various values of minimum coverage. The results are shown in Fig. 21. From Fig. 21, it is clear that the detection rate increases linearly with the increase of minimum coverage. However, the rate of in-crease is not constant in different scenarios. This is
ob-Table 2: Difference in achieved detector coverage with different expected detector coverage
Detector Coverage(%) Self-point radius With 1000
self-points With 3000 self-points With 5000 self-points 85 38.12 31.15 30.08 90 52.08 48.47 47.98 95 67.15 60.32 63.18 98 79.11 70.25 65.04
vious in the sense that with the increase in dimension and number of self-points; the total points covered are increased not in a fixed ratio.
Fig. 21: Scatter diagram for mean detection rate with different expected coverage.
For a fixed dimension, the mean detection rate is higher for smaller self-points. With the increase of the number of self-points, the total non-self-space is re-duced and hence, the generated detectors has more over-lap for higher self-points which causes the detection rate to go down. For a fixed number of self-points, the mean detection rate is higher for 128 dimension than 256 di-mension space. This result can be explained with the help of a total number of detectors count. As the to-tal number of detectors is high for 128 dimensions, the proportion of not covered non-self-space is reduced for this scenario and hence the detection rate goes high.
6.5 G-NAS Results
Experiments were carried out using the dataset men-tioned above to generate the statistical properties of the discussed algorithms. For each simulation, 20000 pass-words and usernames are randomly chosen from the datasets and combined to form the authentication cre-dential (Self-points). SHA-256 is used to hash the au-thentication credentials so that the spread of the hashed
string is even over the space. Along with detector cov-erage, detection rate and false rate are also calculated to indicate the performance of the implementation. The detection rate is the calculated detector coverage with trials. False rate is the percentage of invalid credentials not detected by the detectors. Grid dimension is varied from 26to 211to get the detection rates and false rates for each algorithm.
Different sizes of self-point samples were projected into grids of different dimensions to get the appropriate dimension for a particular size of self-point list. The dimensions of grids are varied from (25×25) to (211×
211). Coverage of the self-region is calculated in each
simulation and results of these simulations are shown in Fig. 22. These simulations are done with the mod based approach. Other two approaches also show very similar pattern with the mod based approach. Another important point is that encryption size does not matter in the self-grid coverage in Grid implementation for any approach. The reason is, always, some specific bits are used from the whole encrypted bit string for mapping. From Fig. 22, the appropriate grid dimension for some specific size of self-points can be found. For example, if the targeted coverage by self-region is below 10%, then for a self-region of 10000 points, the grid dimension will be 29×29 or 512 × 512.
For a given number of password points, the detec-tion rate (the percentage of non-password points is de-tected by the available detectors) increases with the increase of grid dimension. Also, the false positive rate (the percentage of non-password points falls in the self-grids) decreases with the grid dimension.
The trend for detection rate and false positive rate follow the same pattern in the case of removing of some small detectors (ex: removal of detectors with run-length 1 and 2). The Fig. 23 shows the effect of change of Grid size on Detection Rate and False Positive Rate (FPR) without any removal of detectors and removal after de-tectors of RL 1 and RL 2 for a fixed set of 20000 pass-word points in mod based projection. From the Fig. 23, it can be seen that the detection rate graphs before re-moval of any detector, after rere-moval of RL 1 detectors and after removal of RL 2 detectors almost overlapped over each other. It is also true for the false positive rate
Fig. 22: Coverage of self-region in different grid sizes for various sample sizes of self-points for
256 bit encryption.
Fig. 23: Effect of grid size on detection rate and false positive rate without any removal of detectors and removal after detectors of RL 1
and RL 2 for a fixed set of 20000 password points in mod based projection.
graphs. Therefore, from the Fig. 23, it can be concluded that, after removing the small length detectors the grid still shows the same pattern for detection rate and false positive rate as before.
6.6 Comparison Among Approaches of NAS
Each of the different implementations of NAS has its own advantages and disadvantages. Table 3 summarizes the comparison of different methods of NAS. As shown in Table 3, real space and binary space model use prob-abilistic approach for detector generation and maps the same region of the model space for the self-points ev-ery time if the parameters to create the self-points re-main the same. Detectors are generated as hyperspheres
for both models and detectors may overlap each other. To update the existing detectors and self-points, com-parison with all available self-points and detectors is needed for both real and binary space model. The grid space model uses a deterministic approach for detec-tor generation and some variant implementation (XOR method) of grid space model maps different regions for the same set of self-points each time the self-points are generated. Detectors and self-points are generated as non-overlapping grid cells in the grid space and only one comparison with a grid cell is needed to update an existing grid space model.
Table 3 shows the coverage by detectors and num-ber of detectors generated for each space model imple-mentations for ten thousand self-points with SHA-256 hashing. The real and binary space based implemen-tations generate a lot of detectors but achieves detec-tor coverage of about 68%. These two implementations need more space to store higher number of detectors in compared with grid implementation. The grid im-plementation generates relatively small number of de-tectors and achieves great detector coverage of about 90%. Binary and real space implementation have very low false positive while grid space implementation has a relatively higher false positive rate. Grid space imple-mentation generates the same set of detectors for same set of self-points with same configuration parameters but real and binary space implementation will generate different sets of detectors in every run of the algorithm. However, in various runs of G-NAS, the configuration can be changed to set different sets of detectors for the same login information. Binary space implementation maps each different username-password pair to a unique point in the model space. Real space implementation maps 2216 different username-password point to a sin-gle point (for 4 dimensional model considering 4 points after decimal point). Grid implementation maps 2238
different username-password points to a single grid cell (for a 29 ×29 grid) in the corresponding space
mod-els. B-NAS and R-NAS approach require more space and time to generate detectors than G-NAS. G-NAS approach (deterministic solution) can be configured to a specific grid size that can control the amount of space used by the detectors and self-points. Hence, system ad-ministrators can easily tune the parameter (grid size) that best fit the requirement of any system. Moreover, the detection rates of the G-NAS is 95% with 95% level of significance that can be found using χ2-test of the
goodness of fit, which proves the effectiveness and va-lidity of the proposed approach.
In this current implementation, we tested the time requirement (third evaluation criteria) for generating a large number of negative detectors using three different
Table 3: Comparison among different NAS approaches
Binary Space Real Space Grid Based Approach Non-deterministic Non-deterministic Deterministic Mapping All info Curtailed info. (Can be
varied)
Curtailed info. (Can be varied Update of password profile Comparison with all
ex-isting Self-Point and De-tectors
Comparison with all ex-isting Self-Point and De-tectors
Comparison with at most one Self Grid or one Detector
Regeneration of password pro-file
Maps same region for fix points
Maps same region for fix points
Maps different region for self points (Random bit)
Space size Fixed Can be Varied (Decimal places)
Varied (On password profile size) -Small
Detector and Self-point Hypercube Hypersphere Rectangle Overlap of detectors Considered Considered (50% of
ra-dius)
No Overlap
Coverage 62.26% 68.17% 95%(95% level of significance) Dimension of Space 256 4 2
No. of Detectors 116,382 100,000 514 Total Password Space 2256
points 10004 points 218 cells Mapping of points 1:1 1:2216 1:2238 Self-Region Coverage(%) or False Positive Rate (%)
7.85 × 10⁻²² 4.93 × 10⁻⁶ 1.42
Table 4: Time required to create 1 million negative detectors using three versions of NAS
Three Implementa-tions of NAS Time Taken R-NAS 53.17 ms B-NAS 135.35 ms G-NAS 3 ms
Table 5: Time Statistics for verifying 100k authentication requests in the First layer of NAS
approaches Three Im- plemen-tations of NAS Detection time
R-NAS Average: 7.8 ms and Standard deviation: 2.3 ms
B-NAS Average: 6.3 ms and Standard deviation: 2.5 ms
G-NAS Average: 5.2 ms and Standard deviation: 1.3 ms
Table 6: The space required to store 100k detectors in the first layer by three different NAS approaches
Three Implemen-tations of NAS Required Space R-NAS 100k *(5*4 bytes) ≈ 200 MB B-NAS 100k*(32 + 4) bytes ≈ 360 M-B G-NAS 100k*(8 bytes) ≈ 8 MB
versions of NAS. The negative detectors are created in the server side applications and pushed to the first lay-er of NAS to handle all the incoming password request-s. To test the time requirement, we used DELL Pow-erEdge R530 Server with 44 cores at 2.2 GHz and 320 GB RAM. The results are shown in Table 4. According to the table, the required time is quite reasonable for generating 1 million detectors. These generated
detec-tors will be stored in the server side and hence, there is no burden on the client side regarding storage space. In addition, due to lower requirement of detectors’ gener-ation time, system administrators can easily generate a new set of detectors and thereby reduce the chance of compromise the mapping of detector space in the first layer.
To test the average detection time (fourth evalu-ation criteria) required for an authenticevalu-ation request, an experiment is conducted with 1 million detectors in the first layer for 100k authentication requests in three different versions of NAS implementation. This test determines the efficacy of adding one more layer in the actual authentication process. Same server con-figuration is used to run this experiment. The results are shown in Table 5. According to the table, the re-quired time to test 100k authentication requests takes couple of milliseconds. These values signifies that in-corporating a negative layer does not make significant overhead in detecting the authentication attempts for verification.
To compare the usability of NAS approaches, the required space (fifth evaluation criteria) is calculated to store 100k detectors and the results are shown in Table 6. According to the Table, it is clear that there is not much overhead of space for implementing NAS as an authentication approach. As these created detectors will be stored in the server side, the client application performing authentication does not experience any dif-ference in terms of memory requirements.
In summary,the overall detectors coverage is higher with lesser number of detectors in G-NAS in compared with B-NAS and R-NAS for the considered dataset. The coverage values of three approaches can be increased with the decrease of the confusion parameter for
B-NAS and R-B-NAS and with the increase of the grid di-mension for G-NAS. Reducing the confusion parameter triggers a higher number of detectors to be generated in B-NAS and R-NAS. Similarly, increasing the grid di-mension requires generating more grid cells in G-NAS. These issues play a role in determining the value of the last three evaluation criteria mentioned in section 6.2. Table 4 highlights the comparison of three approach-es based on third evaluation criteria. According to the table, G-NAS takes the lowest time to generate the re-quired number of detectors to achieve better negative space coverage. Table 5 and Table 6 show the com-parison of these approaches based on fourth and fifth evaluation criteria respectively. In both cases, G-NAS takes lesser time and space in compared with B-NAS and R-NAS implementation. B-NAS and R-NAS per-form almost equally for last three evaluation criteria.
The above mentioned experimental results proves the efficiency of NAS concept in terms of various e-valuation criteria. These results also demonstrate the validity and reliability (in terms of false positive rate mentioned in Table 3) of the three different implemen-tations of NAS.
6.7 Password cracking test
In order to verify the efficacy of the proposed NAS ap-proach, the password cracking test is designed to simu-late the guessing attacks. 100k different access requests are made to test the NAS approaches and the number of times these requests fall into the self-region are count-ed. Generally, the first layer detects and block all the invalid requests (those which fall into the anti-password space or negative space). The results of password crack-ing test for R-NAS and B-NAS are shown in Table 7 and Table 8.
In R-NAS scenario, for 100k test points, only 1 point pass through the second layer and falls into the self-region. It means one invalid request is considered as a valid request. This scenario happens if the dimension of the space is small (here 3 points) but with the increase of the space dimension, no invalid request has fallen in-to the self-region. For B-NAS no invalid requests fall into the self-region. In general, If the self-radius (confu-sion parameter) is significantly small, the possibility of mapping of the invalid requests fall into the self-points region is very less. Hence, with the proper tuning of the confusion parameter for B-NAS and R-NAS, the password guessing attack can be fully prevented in the proposed approach.
The proposed NAS approach also prevents the side channel attacks. All the access requests are initially ver-ified in the first layer of NAS. If the first layer cannot
catch an incoming request, it moves the request to the second layer for additional checking. From an intruder perspective, the information contained in the first layer is the commonly available information to be compro-mised. First layer of NAS contains only the detectors information and no information regarding the positive password space. In the proposed three implementations of NAS, the total number of detectors are exponential-ly larger in comparison with the number of self-points (passwords). The created set of detectors is hashed out-put. Hence, compromising the set of detectors provide the attackers a list of hashed outputs. The strength of the hashed output can be increased by choosing the higher valued hash functions (SHA-256 or SHA-512). As the chance of hash collision is very few, the proba-bility of the valid passwords having the same hash as the compromised detector points is close to zero. Again as the hashing is considered as an irreversible process, it is not possible for the attackers to get the actual string of characters that construct the detectors.
In addition, the set of detectors are updated on a regular basis (they will change after every run of B-NAS and R-NAS due to the non-deterministic approach) and hence, any extracted information regarding the possible password space may not be applicable after a particular period. Hence, with the incorporation of two layers in NAS and putting only the non-self-information in the first layer, the side channel attack can be significantly reduced. It is true that the proposed NAS may not pre-vent all the types of side-channel attacks but with the two layer based approach, it makes harder to access and compromise the positive information of the legitimate users.Another advantage of this two layer approach is that the unsuccessful access requests can be later be used for forensic analysis to extract any pattern of the attackers to further strengthen the design of NAS.
7 Comparison with Positive Authentication System (PAS)
In our proposed system, the first layer composed of anti-password information (negative detectors). The more secured second layer contains the positive password s-pace. In general, passwords are first hashed and rep-resented in a high dimensional space. According to our design, anti-passwords are less risky to reveal passwords as compared to a hashed password file.
In the case of an offline attack on the first layer, when the attacker gets access to the identification information file, the Anti-P file is less vulnerable to the revelation of the password than the password file. From the password file, the attacker knows which hashes are valid so that