HAL Id: cea-01881325
https://hal-cea.archives-ouvertes.fr/cea-01881325
Submitted on 13 Jan 2021
HAL is a multi-disciplinary open access
archive for the deposit and dissemination of
sci-entific research documents, whether they are
pub-lished or not. The documents may come from
teaching and research institutions in France or
abroad, or from public or private research centers.
L’archive ouverte pluridisciplinaire HAL, est
destinée au dépôt et à la diffusion de documents
scientifiques de niveau recherche, publiés ou non,
émanant des établissements d’enseignement et de
recherche français ou étrangers, des laboratoires
publics ou privés.
contributes to degeneration of midbrain dopamine
neurons
Layal Maatouk, Anne-Claire Compagnion, Maria-Angeles Carrillo-De
Sauvage, Alexis-Pierre Bemelmans, Sabrina Leclere-Turbant, Vincent
Cirotteau, Mira Tohmé, Allen Beke, Michael Trichet, Virginie Bazin, et al.
To cite this version:
Layal Maatouk, Anne-Claire Compagnion, Maria-Angeles Carrillo-De Sauvage, Alexis-Pierre
Bemel-mans, Sabrina Leclere-Turbant, et al.. TLR9 activation via microglial glucocorticoid receptors
con-tributes to degeneration of midbrain dopamine neurons. Nature Communications, Nature Publishing
Group, 2018, 9, pp.2450. �10.1038/s41467-018-04569-y�. �cea-01881325�
ARTICLE
TLR9 activation via microglial glucocorticoid
receptors contributes to degeneration of midbrain
dopamine neurons
Layal Maatouk
1
, Anne-Claire Compagnion
1
, Maria-Angeles Carrillo-de Sauvage
2
, Alexis-Pierre Bemelmans
2
,
Sabrina Leclere-Turbant
3
, Vincent Cirotteau
1
, Mira Tohme
4
, Allen Beke
1
, Michaël Trichet
5
, Virginie Bazin
5
,
Bobby N. Trawick
6
, Richard M. Ransohoff
7
, François Tronche
1
, Bénédicte Manoury
4
& Sheela Vyas
1
In
flammation is a characteristic feature of Parkinson’s disease (PD). We examined the role of
TLR9 and its regulation by glucocorticoid receptors (GRs) in degeneration of substantia nigra
dopamine neurons (DNs). TLR9 agonist, CpG-ODN, induced DN degeneration in mice lacking
GR in microglia but not in controls. TLR9 deletion reduced DN loss in neurotoxin,
1-methyl-4-phenyl-1,2,3,6-tetrahydropyridine (MPTP) mouse model of PD. GR regulates TLR9 activation
during MPTP neurotoxicity as TLR9 antagonist suppressed increased DN loss in microglia/
macrophage GR mutant mice. GR absence in microglia enhanced TLR9 translocation to
endolysosomes and facilitated its cleavage leading to pro-in
flammatory gene expression.
GR-dependent TLR9 activation also triggered DN loss following intranigral injection of
mito-chondrial DNA. Finally, microglial GR sensitivity to A53T-alpha-synuclein induced DN
degeneration as well as decreased microglial GR expression observed in SN of PD brain
samples, all suggest that reduced microglial GR activity in SN can stimulate TLR9 activation
and DN loss in PD pathology.
DOI: 10.1038/s41467-018-04569-y
OPEN
1Institute of Biology Paris Seine, Gene Regulation and Adaptive Behaviors Team, Department of Neuroscience Paris Seine, Sorbonne Université, CNRS UMR
8246 & INSERM U1130, 9 Quai Saint Bernard, F-75005 Paris, France.2CEA, DRF, Institut François Jacob, Neurodegenerative Diseases Laboratory, Molecular Imaging Research Center (MIRCen), CNRS, CEA, Université Paris-Sud, Université Paris-Saclay (UMR9199), F-92265 Fontenay-aux-Roses, France.3 IHU-A-ICM–Neuro-CEB, Plateforme de Ressources Biologiques (PRB), Hôpital de la Pitié-Salpétrière, 47 Boulevard de l’Hôpital, F-75013 Paris, France.4INEM, INSERM U1151-CNRS UMR 8253, Hôpital Necker, Université Paris Descartes, Sorbonne Paris Cité, Faculté de Médecine, 149 Rue de Sèvres, F-75005 Paris, France.5Institute of Biology Paris Seine, Electron Microscopy Facility, Sorbonne Université FR3631, 9 Quai Saint Bernard, F-75005 Paris, France.6Center for
Organic Chemistry, Mallinckrodt Pharmaceuticals, 3600N. Second Street, B81-T l, St. Louis, MO 63147, USA.7Third Rock Ventures, Boston, MA 02116, USA.
Correspondence and requests for materials should be addressed to S.V. (email:sheela.vyas@upmc.fr)
123456789
M
icroglial reactivity is an early and characteristic feature
of Parkinson’s disease (PD). Increasing evidence both
from clinical and animal studies point to active
microglial involvement, through secretion of inflammatory
mediators, in the development and progression of PD
pathol-ogy
1–3. Progressive degeneration of dopamine neurons (DNs) in
substantia nigra pars compacta is a hallmark of PD pathology
responsible for motor symptoms
4. Among brain regions, SN has a
high density of microglia
5, and work with experimental PD
models indicates a selective vulnerability of DNs to inflammatory
attack by reactive microglia
6.
Microglia are the principle resident innate immune cells of the
brain expressing diverse classes of pattern recognition receptors
including all TLR (Toll-like receptors) family members
7. TLRs are
activated by both PAMPs (pathogen-associated molecular patterns)
present in microbes and DAMPs (danger-associated molecular
patterns) present in molecules released by damaged cells, which
leads to an intracellular signaling cascade and
transcription-dependent inflammatory gene expression
8,9. NF-κB, AP-1, and
IRF are major transcriptional factors involved in orchestrating the
innate immune responses upon TLR ligand binding
10. The
func-tional roles of NF-κB and AP-1 in microglial-mediated
inflamma-tory response and death of DNs have been demonstrated in
experimental PD, while the presence of p65 subunit of NF-κB or
JNK in microglia of SN was shown in PD post-mortem studies
11,12.
Several lines of evidence, based on animal studies, reinforce the idea
that TLRs play a role in degeneration of DNs. Intranigral injection
of LPS, through TLR4 activation in microglia, induces specific loss
of DNs
13. Similarly, intranigral injection of poly I:C, activating
TLR3 in microglia, was found to lower the threshold of vulnerability
of DNs for the neurotoxin 6-OHDA
14. Neuronally released
oligo-meric forms of
α-synuclein were shown to activate microglial
TLR2
15, whereas we previously showed that MPTP
(1-methly-4-phenyl-1,2,3,6-tetrahydropyridine) intoxication in mice significantly
upregulates TLR9 as well as TLR 4, 7 and the key TLR adapter
protein MyD88
16.
Although microglial-mediated inflammatory response can
exacerbate or trigger DN cell death, regulatory mechanisms in
these cells normally limit innate immune actions. Among the
factors controlling inflammatory reaction, the nuclear receptors
such as GR, PPAR-γ, LXR, or Nurr1 represent an important
group shown to protect DNs in experimental Parkinsonism
through regulation of transcriptional activities of NF-κB and
AP-1 in microglia
16–19. In our previous work on the regulatory role of
GR in microglia during degeneration of DNs triggered by the
neurotoxin MPTP, we found increased levels of TLR3, 4, and 9 in
SN of mice lacking GR in microglia/macrophages (GR
LysMCremutant mice) when compared to controls
16, suggesting a role of
GR in controlling their expression. Interestingly, in the same
study, a significant upregulation of TLR9 protein in the striatum
of PD post-mortem brains compared to age-matched control
subjects was also observed, pointing to a putative role of TLR9 in
PD pathogenesis.
In this study,
first we provide further evidence for the role of
microglial GR in PD pathogenesis. In the absence of GR in
microglia, there is increased death of DNs following intranigral
injection of AAV-A53T-α synuclein. The number of
microglia-expressing GR is significantly reduced in the SN of post-mortem
PD compared to control brain tissue suggesting that this loss of
GR in microglia could contribute to dopamine neurodegenerative
process. We then show the tight regulatory role of microglial GR
in TLR9 activation. This has direct consequences for the loss of
DNs in SN triggered either by TLR9 agonists or by MPTP.
Overall, these results indicate that reduced GR activity in
microglia sensitizes microglia to TLR9 activation, which is
det-rimental to survival of DNs in PD pathogenesis.
Results
The role of microglial GR in PD pathology. The transcriptional
activation of GR is mediated by binding of glucocorticoids (GCs)
to inert GR–protein complex in the cytoplasm provoking GR
translocation to nucleus. To examine whether microglial GR
expression is altered during dopamine neurodegeneration in PD,
we analyzed its localization in microglia in SN post-mortem brain
sections from age and sex-matched control subjects and PD
patients (n
= 4). Double immunofluorescence (IF) labeling of
Iba1 and GR showed GR presence in the nucleus, in processes
and microglia without GR (Fig.
1a). GR expression was quantified
and the result, expressed as % total GR
+ Iba + microglia shows
% nuclear GR localization almost reversed in PD compared to
controls. Thus 74 ± 7.2% (mean ± s.e.m.) of GR
+ Iba + microglia
in controls display nuclear localization, which is reduced to 27.5
± 6.8% in PD (p
= 0.02), with parallel increase of GR in processes,
suggesting a dysfunction of GR signaling in PD.
Alpha-synuclein is intimately involved in PD pathological
processes that lead to degeneration of DNs in SN. Recently, AAV
A53T-α-synuclein injection in SN was shown to trigger
degenera-tion of DNs
20. To examine whether microglial GR is involved in
regulating DN degeneration triggered by pathological
A53T-α-synuclein, we injected AAV-PGK-A53T-α-synuclein in intranigral
region of control mice and two microglial GR mutant lines:
GR
LysMCremice in which GR gene is not only inactivated in
microglia but also in peripheral myeloid cells
16,21,22and
GR
CX3CR1CreERwhere long-term gene inactivation occurs
specifi-cally in microglia
23. The absence of GR in microglial cells in
GR
LysMCremice has been verified previously
16,21. We verified the
absence of GR in GR
CX3CR1CreER2after tamoxifen injections in
control and mutant mice (Supplementary Fig.
1A) and
find around
80% of microglia have no GR labeling compared to controls
(Supplementary Fig.
1B).
Eight weeks following adenoviral A53T-α-synuclein injection,
the mice were sacrificed and the number of tyrosine hydroxylase
immunoreactive (TH-IR) neurons quantified in SN. A decrease in
the number of TH-IR neurons was observed in all three genotypes
(p
= 0.02, 0.017, and 0.03 for control, GR
LysMCreand
GR
CX3CR1CreER2mutants; vehicle vs. A53T-α-synuclein virus
injection). Importantly, there was greater decrease in GR
LysMcreand GR
CX3CR1CreER2mice compared to control GR
loxP/loxPmice
(p
= 0.01 and 0.02, respectively, for mutants compared to control
mice) (Fig.
1b). A higher density of microglia indicative of
increased proliferation was seen in GR
LysMCremutant mice
compared to controls (Fig.
1c). Thus, GR in microglia acts to
prevent degeneration of DNs induced by pathological form of
α-synuclein.
TLR9 triggered DN loss in SN is controlled by microglial GR.
In light of our previous results showing high TLR9 protein levels
in the post-mortem striatum of PD
16, as well as regulation of
inflammatory gene transcription by GR upon TLR9 pathway
stimulation
24, we also examined TLR9 levels in SN of PD.
Wes-tern blot results of TLR9 protein levels and quantification with
respect to actin levels in post-mortem SN tissue from three PD
patients and three age-matched controls showed a decrease in
full-length (FL) TLR9 protein levels (Fig.
2a, b). A second band
whose size corresponds to C-terminal active form of TLR9
25was
observed (Fig.
2a). Quantification revealed an increase in
C-terminal fragment in SN of PD suggesting a likelihood of TLR9
activation in SN during pathogenesis of PD (Fig.
2b).
The role of microglial GR in TLR9-inflammatory-mediated
degeneration of DNs was next examined in control, GR
LysMCre, and
GR
CX3CR1CreER2mice. TLR9 sensing of stretches of DNA containing
the cytosine-phosphate-guanosine oligodeoxynucleotide (CpG ODN)
motif present in bacteria is well characterized
26. Control and mutant
GR
LysMcremice (n
= 5 for each time point and genotype) were
injected unilaterally with CpG ODN or control ODN sequence (each
20 bp long, 0.96
μg μl
−1) in the intranigral region. The mice were
sacrificed either at 3 or 7 days after injections and total number of
TH-IR DNs quantified. Injections of control ODN sequence in control or
in mutant GR
LysMCremice had no effect on DN survival when
compared to saline-injected mice (Fig.
2c). In control GR
loxP/loxPmice,
there was no significant decrease in the number of DNs following CpG
ODN injection (p
= 0.48 for 3 days and 0.09 for 7 days, CpG ODN vs.
control ODN). In contrast, in GR
LysMcremutant mice, the same dose
of CpG ODN triggered significant loss of DNs at both time points of 3
and 7 days (p < 0.02 control vs. mutant, post hoc Bonferroni/Dunn
test) (Fig.
2c). To ensure that the decrease in the number of DNs is not
reflecting disappearance of TH protein, sections were stained for
Fluoro-Jade B (which labels degenerating neurons) 3 days after
intranigral injection of CpG ODN. Fluoro-Jade B-positive cells were
seen in the supra-nigral region, i.e., along the track of the injection
(Supplementary Fig.
2A) as well as in SN (Supplementary Fig.
2B, C).
Quantification of Fluoro-Jade B-positive cells in SN of control and
mutant mice showed increase in degenerating neurons in GR
microglial/macrophagic
mutants
compared
to
control
mice
(p < 0.003) (Fig.
2d). The parvalbumin immunoreactive neurons were
quantified in SN region after CpG ODN injection both in control and
GR microglial/macrophage mutant mice to evaluate whether
neurodegeneration was selective with regard to DNs. The results
showed the same number of neurons in control and mutant mice
(Fig.
2e). We also verified whether acute global pharmacological GR
inhibition affects DN loss. Control mice were i.p. injected with vehicle
or GR antagonist RU486 (30 mg kg
−1) 16 h prior to CpG ODN
intranigral injection. The loss of DNs was observed (p
= 0.05) in
RU486-injected mice compared to control vehicle-pretreated
mice (Fig.
2f). To verify the involvement of TLR9 in CpG
ODN-induced DN death we tested TLR9 antagonist COV08-0064. The
specificity and actions of COV08-0064 were reported in the
peripheral tissues
27,28and not in CNS. However, it most likely
traverses the blood brain barrier as indicated by its
physico-chemical properties and the calcein-AM analysis in
MDR1-MDCKII cell line showing it is not a substrate for CNS Pgp efflux
transporter (Supplementary Note
1, Supplementary Tables
1
and
2). Mutant GR
LysMcremice were i.p. injected with 80
28and 120
mg kg
−1TLR9 antagonist COV08-0064, 1 h prior to CpG ODN
intranigral injection as well as once per day until sacrifice after
3 days. There was significant reversal of CpG ODN effect in the
presence of COV08-0064 (p
= 0.03) indicating that COV08-0064
is antagonizing TLR9, plausibly both in macrophages and in
microglia in SN as GR is inactivated in myeloid cells in GR
LysMcremice (Fig.
2g).
c
Iba1/GR/Hoechst Iba1/GR/Hoechst Iba1/Hoechst**
**
Control subjects PD patients % of Iba1+ / GR+ microglia b a c**
**
a
0 50 100 0 200 400 TH+ neurons in SNMicroglial surface area (
μ
m
2)
Number of microglia par
μ m 2
*
0 4000 8000 12,000 Vehb
## ## ## 0 50 100 Nuclear GR GR in processes GRloxP/loxP GRLysMCre GRloxP/loxP GRLysMCre GRCX3CR1CreER2AAV A53T-α-syn
Fig. 1 Involvement of microglial GR in PD pathology. a Left: Representative confocal micrographs of Iba1 staining of microglia in SN of human post-mortem sections and GR presence:a in the nucleus (shown by arrows); b in microglia processes (shown by arrows); c absence of GR. Quantification of GR in Iba1 + microglia and GR co-localization in sections from control subjects and PD patients. Bar= 5 μm. The results are presented as % of GR + microglia quantified from sections of each individual;n = 4 for control subjects and PD patients. **p ≤ 0.02 control subjects vs. PD patients. b TH-IR neurons in SN of GRloxP/
loxP, GRLysMCre, and GRLysMCremice quantified 7 days after a single intranigral injection of vehicle (saline) or AAV-PGK-A53T α-synuclein. n = 3–4 in saline
group andn = 5–7 for AAV-PGK-α-synuclein group, ##p ≤ 0.02; vehicle saline vs. AAV-PGK-A53Tα-synuclein injection, **p ≤ 0.02 GRloxP/loxPvs.
GRLysMCreor GRCX3CR1CreER2mice after AAV-PGK-A53Tα-synuclein injection. c Quantification of microglial density and surface area in same GRloxP/loxP and GRLysMCremice after AAV-PGK-A53T□α-synuclein injection. *p < 0.05, GRloxP/loxPvs. GRLysMCremice. The data presented as mean and error bars indicate s.e.m. Statistical significance determined in all by Mann–Whitney non-parametric test
To show the involvement of GR only in microglia, CpG ODN
was injected in GR
CX3CR1CreER2mice. In these mice, there was
significant (p = 0.01) decrease in the number of TH + neurons in
SN after CpG ODN injection compared to injection of control
sequence (Fig.
2h). Thus, TLR9 activation by synthetic ligand,
CpG ODN, triggers significant DN loss in the absence of
microglial GR activity.
DNs were reported to express TLR3 and injection of its ligand
poly I:C was shown to render these neurons susceptible to
6-OHDA
29. Since the above results show that DN loss by CpG
ODN is dependent on GR, we looked for any direct effect of CpG
ODN on DNs by injecting CpG ODN in the intranigral region of
mice inactivated for GR gene specifically in DNs (GR
DATiCre). Of
note the absence of GR in DNs has been verified and reported
previously
30. Comparable numbers of DNs were found in in
GR
DATiCremutant and GR
loxP/loxPcontrol mice following CpG
injection (Fig.
2i) suggesting that GR in DNs does not play a role
in TLR9- induced toxicity.
Previously, we showed upregulation of TLR9 during DN death
triggered by MPTP
16. To show that endogenous TLR9 plays a
role in MPTP-triggered DN death, TLR9 gene targeted and WT
mice were injected x4 with 20 mg kg
−1MPTP at 2 h interval, a
paradigm known to activate glia
31. Absence of TLR9 protected
DNs against MPTP (p
= 0.01) (Fig.
2j), suggesting that TLR9 is
GRloxP/loxP GRLysMCre
d
Fluorojade B + cells CpG 3 days**
Control seq CpG Control 3 0 1000 2000 3000 TH+ neurons in SN*
**
e
PV25 + neurons per mm 2 TH+ neurons in SNf
g
TH+ neurons in SN + – + + 0 250 500 CpG 7 days 0 RU486 CpG + + + – – – + + CpG COV 5000 10,000 0 4000 8000 12,000 CpG 7 days GRCX3CR1CreER2*
h
Control seqCpG 7 days
**
0 4000 8000 12,000 0 4000 8000 12,000 0 4000 8000 12,000 TH+ neurons in SN* *
i
0 4000 8000 12,000 0 4000 8000 12,000 TH + neurons in SN TH + neurons in SN WT TLR9 KO sal sal MPTP MPTP + COV sal MPTP MPTP + COVj
k
*
# #**
# GR loxP/loxP GR LysMCre CpGc
Control PD 70 100 35 Ratio TLR9/actin*
FL TLR9 C-ter TLR9 Actin 0 2 4*
kDa Control subjects PD patientsb
a
FL TLR9 C-Ter TLR9 7 days GRloxP/loxP GRloxP/loxP GRloxP/loxP GRLysMCre GRLysMCre GRDATiCre 80 120 mg kg–1 MPTP GRloxP/loxP GRLysMCreactivated during dopamine neurodegeneration triggered by
MPTP. To show the involvement of GR in restraining TLR9
activation during MPTP-induced dopamine neurodegeneration,
control and GR
LysMcremutant mice were injected with saline,
MPTP, and with COV08-0064 prior to MPTP injection and once
for 2 days consecutive following MPTP injections. The results
show increased viability of DNs after COV08-006 treatment in
GR
LysMcremice compared to controls (p
= 0.03) (Fig.
2k).
Microglial GR does not affect DN loss triggered by TLR4 and
TLR7. To determine whether the regulation of DN loss by
microglial GR also extends to other members of TLR family, we
examined the effects of TLR2, TLR4, and TLR7 activation. We
performed stereotaxic injections of the TLR4 agonist, LPS (0.5, 1,
and 1.5
μg μl
−1), TLR2 agonist, pam3cys (1
μg μl
−1), and
TLR7 agonist, imiquimod (1
μg μl
−1) in the SN region of control
GR
loxP/loxPand mutant GR
LysMcremice. The mice were sacrificed
3
and/or
7
days
after
the
injection.
With
LPS
at
0.5
μg μl
−1, a tendency for a decrease was observed whereas there
was an inter-individual variability at 1
μg μl
−1in the GR
LysMcremice (Supplementary Fig.
3A). As expected and previously
reported
13, LPS induced significant DN degeneration at
1.5
μg μl
−1in control mice; the absence of GR in microglia did
not trigger further degeneration in mutant mice (p < 0.03)
(Sup-plementary Fig.
3A). The number of DNs was similar after
Pam3cys injection in control and mutant mice compared to
saline-injected mice, indicating that TLR2 stimulation by
Pam3-cys has no effect on DN survival (Supplementary Fig.
3B). On the
other hand, stimulation of TLR7 by imiquimod triggered DN
degeneration, which was similar in control and mutant mice (p
=
0.03) (Supplementary Fig.
3C). These results suggest that among
the TLR family members tested, only TLR9 activation is sensitive
to microglial GR in SN.
Deficit in motor performance following TLR9-induced DN
loss. As a correlate of DN loss in SN, tests for any motor deficits
were undertaken. Since our lesion was unilateral we used cylinder
test as a measure of forelimb akinesia
32in control and mutant
mice 12 days following CpG-ODN injection. The results showed
significant reduction (p = 0.009) (approximately 35%) in the use
of contralateral paw onto surface of cylinder in mutant compared
to control mice (Fig.
3a). We also used accelerating rotarod
paradigm to test both for motor performance and learning in
control and GR
LysMcremutant mice just before and 1 week after
intranigral CpG ODN injection. After habituating all mice to stay
on accelerating rotarod (5–40 r.p.m.) for maximum period (3–5
min), latency to fall on accelerating rotarod was recorded 1 week
later, 3 trials/day for 3 days. The results show that over 3 days,
control mice show same latency to fall, indicative of learned
motor performance. However, GR
LysMcremutant mice have
impaired learned motor behavior as their latency is significantly
below controls at day 1 and gradually increases attaining almost
same latency as controls on day 3 (Fig.
3b). The mice were
re-tested 1 week after intranigral CpG-ODN injection. Similar
dif-ference in latency to fall as in preinjection testing was observed
between control and mutant mice at day 1 and 2 (Fig.
3c). In this
regard, DN loss in SN is not always perceived by latency to fall in
rotarod rod testing
33,34.
GR-dependent TLR9 activation triggers pro-inflammatory
state. Since TLRs trigger microglial activation, we examined
microglial reactivity by Iba1 immunohistochemistry 3 days after
CpG injection. Microglial surface area, as an index of glial
hypertrophy or activation, was quantified both in contralateral
and ipsilateral sides of SN of control and mutant mice following a
single unilateral injection of CpG ODN. Microglial cells were
more hypertrophied in the CpG ODN injected side compared to
contralateral side in both controls (p
= 0.04) and mutant (p =
0.04) mice. There was, however, a further increase in
hyper-trophied microglia in microglial GR mutant mice compared to
controls (p
= 0.04) (Fig.
4a), which implies that GR expression in
microglia restrains TLR9 signaling in microglia.
To examine whether exacerbated neuronal damage observed in
GR
LysMCremice was associated with inflammatory mediators, we
analyzed GR transcriptional regulation of inflammatory genes.
First, the results of inflammatory gene expression by RT-qPCR in
SN 24 h after CpG ODN or control-ODN injections in control
mice showed that CpG ODN has no effect on TNF-α (p = 0.9),
iNOS, MCP-1, or IκB mRNA levels. However, MyD88 mRNA
levels were upregulated (p
= 0.04) (Fig.
4b). In contrast, TNF-α
(p
= 0.03), iNOS (p = 0.03), MCP-1 (p = 0.02), and MyD88 (p =
0.02) mRNA levels were significantly increased by CpG ODN in
GR
LysMcremutant mice (Fig.
4b), indicating that TLR9 signaling
is robustly stimulated resulting in strong expression of potent
inflammatory genes.
The expression of pro-inflammatory genes was verified in
primary control and mutant microglial cultures treated with CpG
ODN or CpG ODN plus GR agonist, dexamethasone (Fig.
4c).
The increase in TNF-α, iNOS, and COX2 by CpG ODN treatment
Fig. 2 Microglial GR regulates TLR9 signaling which affects DN survival in substantia nigra. a WB of TLR9 and actin in total SN homogenates from control subjects and PD patients.b Quantification of full-length (FL) and C-terminal fragment (C-ter) *p < 0.05, PD vs. control, n = 3. Mann–Whitney non-parametric test. Full gel blots in Supplementary Fig.4.c TH immunohistochemistry in SN of GRLysMCreand GRloxP/loxPmice 7 days after a single intranigral injection CpG ODN showing loss of DNs in mutants. Bar= 100 μm. Total number of TH-IR DNs spanning entire SN were quantified 3 and 7 days after intranigral injection of saline (sal), control sequence (c-seq), or CpG ODN.n = 5 per group. *p < 0.05, **p ≤ 0.02, control vs. mutant, post hoc Bonferroni/ Dunn test.d Degeneratingfluorojade-positive neurons in SN of controls and GRLysMCremice were quantified 3 days after a single intranigral injection of CpG ODN. **p ≤ 0.02; controls vs. mutants, Mann–Whitney test, n = 5 per group. e Quantification of parvalbumine-positive GABAergic neurons in SN of controls and GRLysMCremice 7 days after a single intranigral injection of CpG ODN.f TH-IR neurons in SN of GRloxP/loxPmice, pretreated or not with i.p. injection of GR antagonist RU486 quantified in SN 7 days after a single intranigral injection of CpG ODN *p < 0.05; pretreated with RU 486 vs. non-pretreated, Mann–Whitney test, n = 5/group. g TH-IR neurons in SN after injection of either 80 or 120 mg kg−1COV08-0064 1 h i.p. prior to stereotaxic injection of CpG ODN in GRLysMCremice, and x1 for 3 days, mice sacrificed after 3 days. n = 4/group *p < 0.05 pretreated with COV08-0064 vs. CpG ODN only. Mann–Whitney test. h Quantification of TH-IR cells in GRCX3CR1CreER2mice injected with control sequence (c-seq) or CpG ODN. **p ≤ 0.02control seq vs. CpG ODN, Mann–Whitney test n = 5 group. i Quantification of TH-IR cells in SN in control and GRDATiCremice after CpG ODN injection.n = 4/group. j Saline or MPTP injections (20 mg kg−1) in wild-type (WT-C57BL/6) or TLR9 k.o. mice followed by quantification of TH-IR cells in SN. n = 3/
saline group and 4–5 for MPTP group. #p < 0.05 saline vs. MPTP, **p ≤ 0.02 WT MPTP vs. TLR9 k.o MPTP, Mann–Whitney test. k Quantification of TH-IR cells in SN 7 days after saline (sal), MPTP (18 mg kg−1), or MPTP+ COV08-0064 treatment in GRloxP/loxPand GRLysMCremice.n = 3/saline group, n = 5/ MPTP group,n = 5/MPTP + COV08-0064 control group, and n = 3/MPTP + COV08-0064 mutant group. #p < 0.05 saline vs. MPTP and **p ≤ 0.02 MPTP vs. MPTP+ COV08-0064 group, Mann–Whitney test. All data are presented as mean and error bars indicate s.e.m
was attenuated by dexamethasone in control but not mutant
cultures.
TLR9 traffic to lysosomes enhanced in GR-depleted microglia.
To understand how GR regulates TLR9-induced DN death, in
comparison with other TLRs that also elicit inflammatory gene
expression, we hypothesized that GR may have a role on
upstream processes of TLR9 activation, in particular at the level of
TLR9 receptor trafficking or at the level of TLR9 cleavage. TLR9
is normally retained in the endoplasmic reticulum (ER) associated
with UNC93B1
35,36. Upon stimulation with CpG ODN, TLR9
translocates to endolysosomal compartment in
UNC93B1-dependent fashion, where it undergoes proteolytic cleavage by
pH-dependent proteases, notably cathepsins and asparagine
endopeptidase (AEP) to yield an active C-terminal fragment,
which is competent for signaling
25,37,38.
To gain insight into the mechanisms underpinning the
modulation of TLR9 signaling by GR, we used in vitro primary
microglial cultures prepared from cortices of P1 control and
mutant pups. The cells were transfected with TLR9-GFP
expression plasmid using Amaxa nucleofector system, with
transfection efficiency of ≈40%. We analyzed co-localization of
TLR9-GFP with early endosomal marker, EEA1 (Early Endosome
Antigen 1) and lysosomal marker LAMP1 by confocal
micro-scopy. Results of quantification of co-localized fluorescence
signals showed that in the steady state there is little localization
of TLR9-GFP with EEA1 or LAMP1-positive compartments both
in control and mutant microglia confirming previous reports in
dendritic and macrophage cell types (Fig.
5a). Treatment of
control and mutant microglial cultures for 1 h with CpG ODN
significantly increased TLR9-GFP localization both in early
endosomes (EEA1
+, control cells p
= 0.004 and mutant cells
p
= 0.02) and lysosomes (LAMP1
+, control cells p
= 0.008 and
mutant cells p
= 0.002). The trafficking of TLR9-GFP in LAMP1
+compartment was significantly different between microglia
from control and mutant pups following treatment with CpG
ODN (p
= 0.001). Indeed, 28% of total TLR9-GFP co-localized
with LAMP1
+lysosomes in mutant microglia compared to only
14% in control microglia (Fig.
5a).
We also analyzed the expression of UNC93B1 mRNA whose
protein product is involved in TLR9 trafficking and found an
increase in the mRNA levels in SN of GR
LysMcremice compared
to control GR
loxP/loxPmice 24 h after intranigral CpG ODN
injection. The expression of progranulin, whose protein product
gives rise to granulins, is a co-factor for TLR9
39, was also elevated
in mutant mice (p
= 0.02 for progranulin and for UNC93B1;
control vs. mutant mice) (Fig.
5b). Altogether, these results
indicate the role of GR in regulating TLR9 translocation to
endolysosomal compartment.
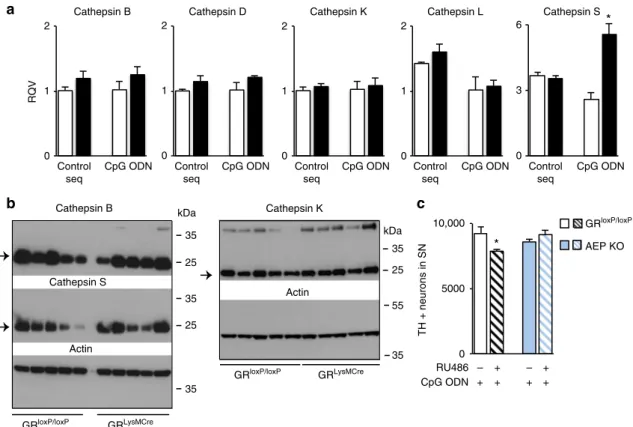
GR controls processing and AEP-dependent TLR9 activation.
To examine the involvement of cathepsins and AEP in TLR9
processing in mutant vs. control microglia, we
first analyzed, by
RT-qPCR, the expression of cathepsins B, D, K, L, and S that can
cleave TLR9
40and found an increase only for cathepsin S (p
=
0.02) (Fig.
6a). Western blot analysis of protein levels of
cathe-psins B, S, and K showed no change in CpG ODN-injected
ipsilateral SN of mutant compared to control mice (Fig.
6b).
Thus, we checked for the possible involvement of AEP
38in
GR-mediated regulation of TLR9 activity. We pretreated control and
AEP knockout mice with GR inhibitor RU486 (Fig.
1) and then
injected CpG ODN in intranigral region. TH
+ neurons in SN
were quantified 7 days after CpG ODN injection in control and
AEP
−/−mice. The sensitivity to TLR9-induced DN loss observed
after RU486 pretreatment in control mice was not observed in
mice lacking AEP (Fig.
6c), indicating that cleavage of TLR9 by
AEP is an important step in TLR9-induced DN toxicity.
Lysosomal changes in GR mutant microglia. Given that TLR9
cleavage is pH dependent, we analyzed the acidity of lysosomal
compartment by treatment of control and mutant microglial cells
with Lysotracker, a weakly basic amine
fluorescent probe that
accumulates in acidic compartments such as lysosomes. The
microglial cultures incubated with Lysotracker were imaged and
the mean
fluorescence intensity of fluorescence-positive
lyso-somes, an index of the internal pH of the lysolyso-somes, was
quan-tified. The results showed increased mean fluorescence intensity
in GR mutant microglial cultures compared to similarly treated
control cultures (p
= 0.003) (Fig.
7a).
Increased Lysotracker staining in GR mutant microglia may be a
result of either an overall increase in the lysosomal biogenesis or
more acidic lysosomes. TFEB transcription factor is a master
regulator of lysosomal biogenesis. We analyzed TFEB levels in the
nuclear and cytoplasmic fractions of primary microglial cultures
prepared from control and mutant pups and found higher basal
levels in the nuclear fraction of GR mutant cultures mirrored by a
decrease in the cytoplasmic fraction (Fig.
7b). We also analyzed the
expression of Ccln7, mcoln1 (TRPML1), ATP6v1h, HEXA, and
lamp1 genes regulated by TFEB
41in control and GR mutant
microglial cultures and found an increase in the mRNA level of
Latency (s) Rotarod following treatment CpG CpG 0 50 100 150 200 250
**
**
1 2 3 0 50 100 150 200 250 Latency (s)Rotarod untreated mice
a
b
c
% Contralateral forepaw used
**
0 20 40 60 80 GRloxP/loxP GRLysMCre GRloxP/loxP GRLysMCre GRloxP/loxP GRLysMCre days Post Pre Post PreFig. 3 Motor behavior tests in control and GRLysMcremice before and after unilateral intranigral CpG-ODN injection.a Analysis of cylinder test: % of
contralateral forelimb touch onto cylinder surface in an upright position out of 20 total ipsilateral and contralateral touches after unilateral CpG-ODN injection. **p < 0.01 control vs. mutant. b After habituation on rotarod, the control and mutant mice were scored for latency to fall on accelerating rotarod. **p < 0.01 control vs. mutant. c Mice retested on accelerating rotarod 1 week after CpG-ODN intranigral injection. The control mice at day 3 showed same latency as during preinjection testing whereas there was a small non-significant decrease in latency with mutant mice. n = 9 for each group. All data are mean of three trials with error bars as s.e.m., with Mann–Whitney non-parametric test for statistical significance
lamp1 in the mutant microglial cells compared to controls (p
=
0.05) (Fig.
7c). To examine whether GR absence in microglia affects
lysosome numbers or size, we undertook electron microscopy
analyses of lysosomes of control and mutant microglial cells
(Fig.
7d). Lysosome numbers and size were quantified in 20 control
and mutant cells using ImageJ. Heterogeneity in both numbers of
lysosomes ranging from 8 to 120 per 100
μm
2and individual
lysosomal size ranging from 0.01 to 0. 8
μm
2was observed in both
control and mutant cells. Nevertheless, as shown in Fig.
7e, mutant
cells present a significant increase in the number of lysosomes
(median 53 ± 32 lysosomes per 100
μm
2) compared to control cells
(median 32 ± 23 lysosomes per 100
μm
2). We also analyzed the size
TNF-α iNOS MCP-1 IL-1β COX-2
a
b
0 100 200 300 400Microglial surface area (
μ m 2)
*
# Ipsilateral side Contralateral side GR loxP/loxP GR LysMCre # TNF-αc
iNOS COX-2 RQV 0 0.4 0.8 1.2 0 10 20 30 40 0 0.05 0.1 0.15*
*
# # # # MyD88 # RQV*
*
0 1 2 3 4 0 1 2 0 1 2 Control seq CpG ODN Control seq CpG ODN Control seq CpG ODN Control seq CpG ODN Control seq CpG ODN Control seq CpG ODN Control seq CpG ODN RQV*
*
*
0 10 20 30 40 0 1 2 3 4 0 10 20 0 1 2 3 GRloxP/loxP GRLysMCre GRloxP/loxP GRLysMCre ContralateralIpsilateralContralateralIpsilateralIκB CpG – – + – – + – + – + – – – – + – – + – + – + – – – – + – – + – + – + – – CpG+dex
Fig. 4 Microglial GR regulates microglial reactivity and pro-inflammatory gene expression after CpG ODN injection. a Immunohistochemistry of Iba-1 7 days following CpG ODN injection both in controls and mutant mice. Quantification of microglial surface area in SN on contra-lateral and ipsi-lateral sides of GRLysMCremutant and control mice a.u: arbitrary units. *p < 0.05 control vs. mutant; #p < 0.05 ipsilateral vs. contralateral side. n = 5/group. b In vivo analysis of inflammatory gene levels by RT-qPCR 24 h after CpG ODN injection in control and GRLysMCremice. The RQV (relative quantitative value) was calculated using HPRT gene as internal control and compared to contralateral non-injected side. Increased levels are observed in mutants compared with controls at 24-h time point. *p < 0.05, control vs. GRLysMCremutant CpG-injected mice,n = 4–5. c In vitro analysis of pro-inflammatory gene levels by RT-qPCR in control and mutant microglial cultures 40 min after control sequence (c-seq), CpG, or CpG+ dexamethasone (dex) treatment. The RQV was calculated using beta-microglobulin as internal control. The data are from three independent experiments. #p < 0.05 c-seq vs. CpG, *p < 0.05 CpG vs. CpG + dex. All data presented are mean and error bars indicate s.e.m. The statistical significance determined by Mann–Whitney non-parametric test
of lysosomes in both conditions (Fig.
7f). Comparison of the two
distributions with sizes ranging from <0.02 to >0.02
μm
2revealed a
significant difference in the distribution of the lysosome size
(χ
2= 84.81, df 10, p < 5 × 10
–14). In the mutant cells, there is slight
diminution of the number of lysosomes within the 0.02–0.12 μm
2range surface, while number of lysosomes with surface <0.02
μm
2is
increased by 2.4-fold.
Mitochondrial DNA triggers DN loss through TLR9 activation.
One of the endogenous ligands reported to activate TLR9 is
mitochondrial DNA, which contains CpG DNA repeats, and is
released upon cell injury
42, or which escapes from autophagic
degradation
43. We reasoned that mitochondrial DNA is a
plau-sible endogenous candidate of GR-dependent TLR9 activation in
the context of DN neurodegeneration, as there is substantial
lit-erature on mitochondrial and autophagic dysfunction in PD
pathology
44,45. Mitochondrial DNA (1 or 5
μg μl
−1) was injected
in the nigral region of control and GR
LysMcremutant mice and
TH
+ DNs in SN were quantified after 7 days. Whereas in the
control mice, mitochondrial DNA had no effect, there was DN
loss in GR
LysMcremutants (Fig.
8a) (p
= 0.02; control vs. mutant
mitochondrial DNA-injected mice). To test whether
mitochon-drial DNA injection activates microglia, microglial reactivity was
analyzed in SN of mice injected with 1
μg. The results showed
increased hypertrophy in ipsilateral side in mutant compared to
control mice (p
= 0.02) (Fig.
8b). To verify that mitochondrial
DNA-mediated DN neurodegeneration following GR inhibition is
elicited by TLR9, we injected 1
μg mitochondrial DNA in TLR9
knockout mice pretreated or not with RU486. The results of
TH-IR DN neuron quantification (Fig.
8c) show that there is no loss
of DNs in TLR9 knockout mice pretreated with RU486 (cf. Fig.
1
control mice pretreated with RU486), indicating that DN loss by
mitochondrial DNA occurs through TLR9.
Discussion
We observed a significant reduction in the number of microglia
with nuclear GR localization in post-mortem SN of PD suggesting
that diminution of GR activity likely promotes DN loss through
stimulation of microglial inflammatory signaling cascades. This is
corroborated by the results of A53T
α-synuclein injection in mice
inactivated for GR in myeloid cells or microglia, which resulted in
increased degeneration of DNs. Inflammatory signaling cascades
initiated by ligation of TLRs are well characterized, as well,
microglia are known to express all the members of TLR family.
Previously, we reported high TLR9 levels in striatum of
post-mortem PD brain tissue
16. Analysis of TLR9 levels in SN of PD
show increased level of C-terminal active fragment of TLR9
protein, suggesting that TLR9 processing may be augmented in
SN of PD. These TLR9 protein changes in SN of PD prompted us
to examine in mouse models whether TLR9 affects DN survival in
SN and elucidate the mechanism(s) through which microglial GR
acts to regulate TLR9 inflammatory cascade.
In both GR
LysMcreand GR
CX3CR1CreER2GR mutant mice,
intranigral injection TLR9 ligand, CpG ODN, resulted in
% Colocalization with TLR9-GFP
*
EEA1 LAMP1b
a
UNC93B1 PRGN RQV Control seq CpG ODN Control seq CpG ODN*
*
## # GR loxP/loxP GR LysMCre No treatment CpG ODN No treatment 0 10 20 30 40 CpG ODN ## 0 2 4 0 2 4 6c
RQV GR loxP GR LysMcre – – – – + + + + – – – – + + + + GRloxP/loxP GRLysMCreTLR9-GFP- DAPI TLR9-GFP- EEA1 TLR9-GFP- LAMP1
Fig. 5 TLR9 translocation to lysosomes is augmented in the absence of microglial GR. a Control (C) and mutant (M) primary microglial cells were transfected with TLR9-GFP by nucleofection and 24 h later stimulated or not with CpG-ODN for 1 h. The cells werefixed and stained with specific antibodies for EEA1 (Early Endosome Antigen 1) and LAMP1 (lysosomal marker). Bar= 2 μm. b Quantification of TLR9-GFP/EEA1 or LAMP1 co-localization was performed using ImageJ software, from three independent experiments. The results represent the percentage of co-localization of TLR-9 GFP with either EEA1 or LAMP1. *p < 0.05 Control CpG ODN vs. Mutant CpG ODN; # non-treated vs. CpG ODN. c RT-qPCR measurement of progranulin (PRGN) andUNC93B1 mRNA levels in SN of control and mutant mice 24 h after control sequence or CpG ODN injection. *p < 0.05 control vs. GRLysMCremice,n = 4–5 per group. Data presented are mean with error bars as s.e.m., Mann–Whtiney test was used statistical significance
significant loss of DNs in SN. This CpG ODN-induced DN loss in
GR microglial-macrophage mutants was reversed significantly by
systemic administration of TLR9 antagonist COV08-0064,
indi-cating that indeed CpG-ODN activates the TLR9 signaling
pathway in SN. Of note, COV08-0064 was reported to specifically
antagonize TLR9 activation peripherally; however, its action in
brain was not shown. Nevertheless, its physical properties plus
our results including that it is not a substrate for Pgp efflux
transporter strongly indicates that it can exert effects in brain. To
obtain definitive proof of its presence in CNS once injected i.p.,
synthesis of
14C-labeled version of COV08-0064 is now initiated.
The dependency of TLR9 signaling for GR was also
corrobo-rated by reducing GR activity with GR antagonist RU486 in
control mice, which resulted in DN loss after intranigral CpG
ODN injection. The loss of DNs in SN in microglial/macrophage
GR mutants was accompanied by forelimb akinesia as revealed by
cylinder test.
TLR9 is likely involved in MPTP-triggered experimental
Par-kinsonism. Thus, we observed a significant reduction of DN loss
in TLR9-deficient mice. Our results suggest that this activation is
under the control of GR as in the presence of COV08-0064 the
increased death of DNs by MPTP was reversed in GR
LysMcremutant mice with no effect in the control mice.
DNs are intrinsically vulnerable to an inflammatory attack
13,
thus, for example, intranigral injection of LPS induces specific
loss of DNs through TLR4-innate immune activation of
micro-glia
13, whereas similar low dose of LPS does not trigger death of
striatal neurons
21,46. In the present study, LPS-activated TLR4
and imiquimod-induced TLR7 activation induced similar DN loss
in control and mutant GR
LysMcremice. The results indicating
non-significant effect of microglial GR on LPS-induced DN
degeneration are intriguing as we previously showed microglial
GR control of neuronal death in cortical/striatal region following
intra-striatal injection of 1.5
μg LPS as used here
21. In addition,
we also showed that microglial GR regulates inflammatory genes
and NF-κB activation induced by LPS. The possibility of high LPS
sensitivity in SN compared to striatum and cortex related to
greater density of microglia was tested by reducing the dose of
LPS to 0.5 and 1
μg. Inter-individual variability in GR
LysMcremice
in response to 1
μg LPS was observed suggesting that besides GR
other factors control TLR4 signaling in SN microglia.
Morphological analysis of SN microglia in ipsilateral and
contralateral side of SN 3 days after CpG ODN injection showed
significantly greater hypertrophied microglia in GR
LysMCremutants compared to controls. In line with high microglial
reactivity in GR mutants, CpG-ODN also significantly increased
mRNA levels of TNF-α, iNOS, MCP-1, MyD88 with little change
in their levels in control mice. This upregulation of
pro-inflammatory genes in the absence of microglial/macrophage
GR may participate in DN loss.
In examining whether microglial GR affects TLR9 trafficking
and cleavage, we uncovered unexpected actions of GR on TLR9
regulation and in microglial functions. The results of TLR9-GFP
co-localization in EEA1
+early endosomes or in LAMP1
+lyso-somes in control and microglial GR mutant cultures showed
significant expression of TLR9-GFP in lysosomes of mutant
microglia after CpG ODN treatment. CpG ODN treatment also
led to increased levels of UNC93B1 and progranulin transcripts
Control seq TH + neurons in SN
a
RU486 CpG ODN – + – + + + + + 0 3 6 0 5000 10,000*
RQV 0 1 2 0 1 2 Cathepsin B Cathepsin D 0 1 2 Cathepsin K 0 1 2 Cathepsin L*
CpG ODN Control seq CpG ODN Control seq CpG ODN Control seq CpG ODN Control seq CpG ODN Cathepsin S GRloxP/loxP GRLysMCre GRloxP/loxP GRLysMCre 25 25 35 35 35 25 35 35 55 kDa kDa Cathepsin B Cathepsin S Actin Actin Cathepsin Kb
c
GRloxP/loxP AEP KOFig. 6 In vivo assessment of the role of microglial GR on TLR9 cleavage enzymes in SN after CpG ODN injection. a RT-qPCR analysis of cathepsin B, D, K, L, and S mRNA levels in SN of control GRloxP/loxPand GRLysMcremutant mice 24 h after intranigral injection of control sequence or CpG ODN. *p < 0.05 control vs. GRLysMCremice,n = 4–5/group. b Western blot analysis of cathepsin B, S, and K levels in SN of control GRloxP/loxPand GRLysMcremutant mice
48 h after CpG ODN injection. The blots were rehybridized with actin antibody.n = 5/group. Full gel blots in Supplementary Fig.4.c Quantification of TH-IR neurons in SN of GRloxP/loxPmice and AEP−/−mice, pretreated or not with i.p. injection of GR antagonist RU486, 7 days after a single intranigral injection of CpG ODN.n = 5, *p < 0.05; pretreated with RU 486 vs. non- pretreated. All data are presented as mean with error bars as s.e.m. and Mann–Whiney non-parametric test for statistical significance
in mutant GR mice. UNC93B1 is the chaperone protein, required
for exit of TLR9 from the ER to the endolysosomes
37, whereas
progranulin, the precursor protein of granulins, was reported as a
soluble cofactor for CpG ODN binding to TLR9
25. Their high
expression in mutant GR mice also argues for efficient TLR9
trafficking and processing in endolysosomes.
The major determinant for TLR9 activation is cleavage of its
ectodomain near amino acid residue 477 into N-terminal and
C-terminal regions by pH-sensitive cathepsin and AEP proteases.
This acid-dependent cleavage requires endosome maturation
(acidification). Ligand binding to cleaved TLR9 homodimers
induces a conformational change that brings the TIR domains
into close proximity, enabling MyD88 recruitment
25,37,47. Our
results point to the involvement of AEP in TLR9 cleavage in
microglia, as CpG ODN-induced DN loss after pretreatment with
RU486 in AEP knock out mice was not observed compared to
control mice. As the results point to TLR9 activation in mutant
microglial lysosomes, we also examined alterations in microglial
lysosomes in the absence of GR. We observed increased
Lysotracker
fluorescence intensity in GR mutant microglia.
Fur-ther characterization by transmission EM showed enhanced
number and altered size distribution of lysosomes compared to
control microglia. Increased level of TFEB transcription factor in
nuclear fraction together with augmented expression of LAMP1
in GR mutant microglia imply a change in lysosomal biogenesis
and function. Overall, these results show that microglial GR
regulates TLR9 trafficking and lysosomal environment.
In our search for relevant TLR9 activators in PD and given that
unmethylated CpG sequences are present in mitochondrial DNA,
we examined whether mitochondrial DNA can induce dopamine
neurodegeneration through TLR9 activation. The role of
CpG-rich mitochondrial DNA in triggering inflammation through
TLR9 has been previously demonstrated. Oka et al.
43showed that
mitochondrial DNA that escapes from autophagy-mediated
degradation leads to TLR9-mediated inflammatory responses in
cardiomyocytes and causes inflammation and heart failure. In
systemic lupus erythematous, recognition of self-nucleic acids by
TLR7 and TLR9 with ensuing innate inflammation is an
Lysotracker RQV LAMP1 GR loxP/loxP
a
c
d
Number of lysosomes /100 μ m 2b
lysosomes/celle
Lysotrackermean intensity (a.u)
TFEB Actin Cyto lysate TFEB H3 CpG – – + + – – + + Nucl lysate
*
No treatment 0 20 40 60 80 100 120 140*
0.0% 10.0% 20.0% 30.0% 40.0% 70 55 kDa 70 55 35 15 0 1 2Clcn7 mcoln1 HEXA ATP6v1h 0 50 100
*
f
GR LysMcre GRloxP/loxP GRLysMCre GRloxP/loxP GRLysMCre GRloxP/loxP GRLysMCre GRloxP/loxP GRLysMCre GRloxP/loxP GRLysMCre GRloxP/loxP GRLysMcre <0.02 0.02–0.040.04–0.060.06–0.080.08–0.100.10–0.120.12–0.140.14–0.160.16–0.180.18–0.20 >0.20Fig. 7 Lysosomal changes in GRLysMcremutant microglia.a Confocalfluorescent images of Lysotracker uptake in living control and mutant primary microglial cells. Bar= 5 μm. The mean fluorescence intensity of Lysotracker was quantified using ImageJ, n = 3 separate experiments. *p < 0.05, control vs. mutant cells.b A representative western blot experiment shows an increase in nuclear fraction of TFEB in mutant microglial cultures, mirrored by a decrease in the cytoplasmic fraction of TFEB. Full gel blots in Supplementary Fig.5.c In vitro RT-qPCR analysis of expression of lysosomal genesClcn7, mcoln1, HEXA, ATP6v1h, and lamp1, in microglial cultures prepared from control and GRLysMCrepups.β-microglobulin gene was used as internal control.
*p < 0.05; control vs. GRLysMCremutant cultures,n = 3 independent experiments. The data are presented as mean with error bars as s.e.m. and Mann–Whitney test for statistical significance. d Representative EM images of a control and a mutant cell. Red arrows point to lysosomes. e Number of lysosomes per 100μm2in 21 control and 20 mutant cells. Data are expressed as Tukey boxplot where the median is indicated by a horizontal line, the bottom of the box represents the 25th percentile, the top the 75th percentile, whiskers represent minimum and maximum values.f Distribution of the lysosome surface (μm2). 1386 and 1737 lysosomes were measured, respectively, in control or mutant cells using ImageJ.χ2test of independence:
important pathological feature, and, interestingly is correlated
with reduced GC activity
48. We found 16–20% DN loss with
either 1 or 5
μg mitochondrial DNA which was far less than with
CpG ODN. The CpG copy numbers of these two TLR9 ligands
are very different. Thus, 1
μg CpG ODN can be estimated to have
approximately 4.6 × 10
14copies of CpG, whereas similar
con-centration of mitochondrial DNA has around 1.3 × 10
4copies
taking into account 850 CpG sites in 16.57 kbp of mitochondrial
DNA
49. This DN loss was GR and TLR9-dependent as it occurred
only in GR
LysMCremice and not in TLR9
−/−mice treated with
RU486. The signals that can activate microglia in SN include
oligomeric and
fibrillar forms of α-synuclein, neuromelanin, and
HMGB1 released from dying DNs
50–53. Under normal
circum-stances, self-nucleic acids, which are methylated, are degraded
before reaching the endolysosomes where TLR3, TLR7, and 9 are
localized. However, if nucleotides are in complexes with HMGB1
released by dying cells, they resist degradation. Recently, high
levels of HMGB1 in CSF and serum of PD patients were
repor-ted
53. As well, PD patients harboring G2019S LRRK2 mutation
were reported to have a high concentration of mitochondrial
DNA in CSF; however, the source of mitochondrial DNA remain
unknown
54. Other possible situations, which may sensitize
microglial TLR9 pathway, include CNS and systemic infections as
well as brain trauma. Indeed, DNA viruses (known to activate
TLR9
55) such as Herpes simplex virus, Epstein-Barr virus,
Cytomegalovirus, and Varicella zoster virus have been associated
to Parkinsonism
56.
Regarding GCs and GR in PD, several studies have reported
significantly high circulating levels of cortisol in PD
patients
16,57,58. Chronically high GC levels are known to
com-promise GR activity in immune cells
59, which could permit TLR9
induction. Indeed our present work argues for a decreased GR
transcriptional activity in microglia. As schematized in Fig.
9,
overall, our results suggest that decreased microglial GR activity
in SN can lead to an enhancement of dopamine
neurodegen-eration and pathogenesis in PD patients. Specifically, this loss of
GR enables activation of microglial TLR9 inflammatory pathway,
which can play a role in the progression of PD pathology.
Methods
Human SN autopsy samples. The human post-mortem samples were obtained from brains collected in a Brain Donation Program of the Brain Bank“NeuroCEB” run by a consortium of Patients Associations that include ARSEP (Association for
Research on Multiple Sclerosis), CSC (cerebellar ataxias), and France Parkinson. The signed consents were either from the patients or their next of kin in their name, in accordance with the French Bioethical Laws.
SN sections for IF experiments were from three males, one female control subjects: age 75.25 ± 7.4 years, post-mortem delay: 23.87 ± 13.5 h; and from three males, one female PD patients: age 79 ± 2.3 years, post-mortem delay: 30 ± 12.9 h for PD patients. SN western blot samples were from three male control subjects: age 68 ± 10 years, post-mortem delay: 11.5 ± 9.96 h; and two males, one female PD patients: age 78 ± 5.2 years, post-mortem delay: mean 39.5 h for two and one not determined. All values are mean ± s.e.m. Two of the samples in IF and western blot experiments were from same PD patients.
Mouse models. The Nr3C1loxp/loxp;LysMCre mice (thereafter denominated GRLysMCre) were generated by crossing Nr3C1loxp mice with LysMCre transgenic
mice, which express Cre recombinase inserted by homologous recombination under the lysozyme M promoter gene22,60. The mice were backcrossed to C57BL/6J for at least 10 generations. Generation of DATicre (Tg BAC-DATiCrefto) and GRDATiCremice inactivated for GR gene in DNs is described in ref.30. AEP−/−
mice were generated in C. Peters’ lab (Freiburg) and backcrossed 11 times on B6 background. TLR9 KO mice were obtained from Drs. N. Doyen and C. Cousin, Pasteur Institute, Paris, and also from Dr. L. Alexopoulou, Centre
d’Immunologie de Marseille-Luminy. GRCX3CR1CreER2mice were generated by
crossing CX3CR1CreER2 transgenic mice23with Nr3C1loxp mice. For Cre recombination in GRCX3CR1CreER2mice, both control and GRCX3CR1CreER2were
injected i.p. with 2 mg of tamoxifen (Sigma) per day for 5 days and experiments undertaken 3 weeks after to ensure the disappearance of GR only in CNS microglia23.
Mice were group-housed under a controlled photo-period (12-h day–night cycles), at constant room temperature (22 °C) and had access to food and water ad libitum. GRLysMCre, GRDATiCre, GRCX3CR1CreER2mice were genotyped for the presence of Nr3C1loxp allele and Cre or iCre transgene by PCR. All studies were performed in accordance with ethical guidelines of European Convention for the protection of Vertebrate Animals (directives of 2013: 2010/63/EU) and experimental protocol approval from French ministry of Research. Control and mutant littermate mice were randomly grouped for treatment.
Stereotaxic injections. For stereotaxic surgery, 3–5-months-old GRDATiCre,
GRLysMCre, GRCX3CR1CreER2mutant male mice and GRloxp/loxpcontrol littermates were anesthetized by an i.p. injection of 100 mg kg−1ketamine and 10 mg kg−1 xylazine. The scalp was shaved and a small hole was made at the surface for injection into the left substantia nigra using the following stereotaxic coordinates in mouse Paxinos atlas (David Kopf Instruments, Tujunga, CA, USA) from Bregma −2.8 mm anteroposterior, +1.3 mm mediolateral, and –4 mm dorsoventral. In all, 0.5, 1, and 1.5μg of TLR4 agonist LPS (LPS Escherichia coli, serotype 055:B5; Sigma, St. Quentin Fallavier, France), 1μg of TLR2 agonist (Pam3Cys-Ser- (Lys) 4 Trihydrochloride; Abcam, ab142085), 1μg of TLR7 agonist, Imiquimod (Enzo Life Sciences, ALX-420-039-M100), 0.96μg (1 μM) of TLR9 agonist ODN 1826 (TLRgradeTM; 5′-TCCATGACpGTTCCTGACpGTT-3′) (Enzo Life Sciences, ALX-746-002-T100) or a control ODN sequence (5′-TCCATGAGCTTCCT-GAGCTT-3′) dissolved in PBS were injected using 10 μl Hamilton syringe into the substantia nigra over a 5-min period. For Adeno-associated vector (AAV) serotype 6 PGK-A53T-α-synuclein injections, the stock of 1.97 × 10¹³gp (genomic particles/
TH + neurons in SN Mitochondrial DNA
*
# TH + neurons in SN Mitochondrial DNA TLR9 KO TLR9 KO- RU486 0 250 500 0 5000 10,000Microglial surface area (
μ m 2) 0 5000
a
b
c
10,000*
*
GRloxP/loxP GRLysMCre GRloxP/loxP GRLysMCre Saline 1 5 μg Contralateral Ipsilateral Contralateral IpsilateralFig. 8 DN loss triggered by mitochondrial DNA in GRLysMcremutants.a TH-IR neurons in SN of GRloxP/loxPmice and GRLysMCremice quantified 7 days after a single intranigral injection of saline or 1 or 5μg μl−1mitochondrial DNA. *p < 0.05; GRloxP/loxPmice and GRLysMCremice.n = 5/group. b Microglial surface area, an index of microglial hypertrophy, was analyzed by ImageJ in same mice asa. The results show increased microglial hypertrophy in GRLysMCre
mutant mice compared to controls *p < 0.05 control vs. mutant; #p < 0.05 ipsilateral vs. contralateral side. c Quantification of TH-IR neurons in SN of TLR9
−/−mice, pretreated or not with i.p. injection of GR antagonist RU486, 7 days after a single intranigral injection of 1μg of mitochondrial DNA. n = 5/group.
ml) was diluted to 2.5 × 10⁹gpμl−1in saline. 2μl of AAV-PGK-A53T α-synuclein
was injected and mice sacrificed after 8 weeks.
Intraperitoneal RU486 pretreatment. GRLysMCremutants, control GRloxp/loxP,
AEP KO, and TLR9 KO mice were pretreated by an IP injection of 30 mg kg−1 RU486 dissolved in 1:9 ethanol:oil 16 h before stereotaxic injection of CpG ODN. MPTP and TLR9 antagonist COV08-0064 treatment. Experiments were per-formed on 3–5-months-old TLR9 k.o. and GRLysMCremutant mice and their
control littermate male mice. For TLR9 k.o. experiment the mice received four i.p. injections of 20 mg kg−1MPTP.HCl or the same volume of saline at 2 h intervals. Mice were sacrificed 7 days after the last injection. For MPTP-COV08-0064 experiment, the GRloxp/loxPand GRLysMCremutant mice were injected with 120 mg
kg−1COV08-0064 (dissolved in saline) 1 h prior to injection of 18 mg kg−1 MPTP-HCl. MPTP dose was reduced as increased lethality was observed by combination of COV08-0064-MPTP treatment particularly in GRLysMCremutant mice during
injection paradigm. 24 h after injections, both control and mutant mice recovered in similar manner. For MPTPv+ COV08-0064 group, the mice were injected with the same concentration of COV08-0064 × 1 for 2 consecutive days following MPTP treatment and sacrificed 4 days later.
Behavior tests. For cylinder test, mice were placed individually inside a glass cylinder (diameter 15 cm, height 30 cm). A camera was placed above the cylinder to allow full vision of the cylinder. The session was videotaped during 5 min for later scoring. No habituation of the mice to the cylinder was made. The assessment was adapted from previous study32: thefirst 20 wall touches with the ipsilateral and the contralateral forelimbs (contacts with fully extended digits), executed indepen-dently, were counted. Simultaneous paw touches were excluded from the analysis. Data are expressed as a percentage of contralateral touches, calculated as (con-tralateral touches)/(ipsilateral touches+ contralateral touches) × 100. The analysis performed by the experimenter blinded to the genotype of mice.
For Rotarod test, mice werefirst habituated to stay on the rotarod apparatus (LSI Letica Scientific Instrument—Rota-Rod LRS) at 5 rpm for 1 day, followed by habituation the next 2 days on the accelerating rotarod with rotarod speed linearly increasing from 5 to 40 r.p.m. over 300 s, so that the latency to fall for all was 3–5 min. One week later the animals were tested on accelerating rotarod three trials/ day, at least 10 min interval for 3 days. The latency to fall from the rod was recorded for each trial. Mice remaining on the rod for more than 300 s were removed and their time scored as 300 s. The mice were injected with CpG-ODN the following day and test repeated 1 week later.
IF and western blot in human brain. Midbrain sections were verified for decrease in TH-IR in PD samples and localization of SN. IF of GR and Iba1 was carried out on 30μm fresh sections (n = 4 for control subjects and 3 for PD patients) and with 10μm paraffin sections (n = 1 PD). As similar results were obtained with sections from fresh-frozen tissues and paraffin-embedded sections, the results were pooled. The method of Monier et al.61was used to achieve Iba1 labeling. Paraf fin-embedded sections were deparaffinated in a series of xylene/alcohol solutions, and antigen retrieval was undertaken by heating the sections at 80 °C for 20 min in 10 mM sodium citrate buffer, pH 6.0. Cryostat fresh sections were air-dried before fixation with freshly prepared 4% PFA in PBS solution for 20 min. The sections were rinsed in Tris-buffered saline (TBS) solution containing 0.5% Triton before
blocking for 2 h in 2% goat serum in TBS-0.5% Triton. They were incubated with rabbit polyclonal anti-Iba1 antibody (WAKO-1/200) and mouse anti-GR antibody (AbCam-1/200) in 2% goat serum/TBS-0.5% Triton for 48 h at 4 °C. After washes in TBS-0.5% Triton, they were incubated with secondary antibodies: Alexa goat anti-rabbit 488 and donkey anti-mouse Cy3, washed, stained with Hoechst 33342 and mounted using vectashield.
For western blot analysis, SN was dissected and protein homogenates were prepared as reported previously16in lysis buffer containing 62.5 mM Tris pH 6.8, 1% SDS, 10% glycerol, 5% beta-mercaptoethanol, and protease inhibitors (complete cocktail, Roche). 20μg lysates were loaded onto 10% acrylamide gel. After transfer onto a PVDF membrane, the blots were probed with TLR9 primary antibody (1/ 500 Imgenex)16. The same blot was re-incubated with actin for loading control. After incubation with secondary peroxidase-conjugated antibodies (GE Healthcare) diluted at 1:2000, signals were visualized by using ECL detection kit (GE Healthcare).
Immunohistochemistry and western blot in mice. For immunohistochemistry, mice were anesthetized with CO2and rapidly perfused transcardially with ice-cold 0.1 M sodium phosphate buffer (PBS) followed by ice-cold 4% paraformaldehyde (PFA) in 0.1 M sodium PBS. Brains were rapidly removed from the skull and post-fixed for 24 h in fresh 4% PFA in PBS solution. 30 μm thick coronal sections were cut serially as described in Ros Bernal et al.11and stored in PBS containing 0.4% sodium azide at 4 °C until use. Sections of substantia nigra, at 180μm interval, were rinsed in PBS, treated with 0.3% H2O2/PBS for 15 min and non-specific Fc binding sites were blocked in 2% newborn goat serum (Sigma-Aldrich) in PBS-T (PBS/0.1% Triton X-100); sections were incubated with rabbit polyclonal anti-Iba1 (W1W019–1974, 1:750; Wako Chemicals), or mouse monoclonal anti-TH (MAB 318, 1:1000, Millipore), anti PV25 (1:500, MAB 1572, Sigma) primary antibodies for 24 h (at 4 °C), with constant shaking. After three washes, sections were incu-bated for 2 h with appropriate anti-mouse or anti-rabbit biotinylated secondary antibodies (1:500; Vector Laboratories). Binding of antibody was detected with avidin-biotin peroxidase ABC kit according to manufacturer’s instructions (Vec-tastain, Vector Labs) using the chromogen diaminobenzidine (Sigma) as a substrate for the peroxidase. Sections were mounted on superfrost plus slides and dehydrated in graded ethanol series and xylene and then coverslipped. Fluoro-Jade B staining procedure was carried out according to the manufacturer’s instructions (Histo-Chem Inc., Jefferson, AR, USA).
For western blot analysis of cathepsins, protein lysates were prepared in the lysate buffer as described above from punches of ipsilateral SN of control and GRLysMcremice injected with CpG ODN. 25μg lysates were loaded on 14% acrylamide gels and after transfer onto a PVDF membrane, the blots were probed at 1/250 with mouse monoclonal anti-cathepsin B (H-5, SC36558 Santa Cruz), rabbit polyclonal cathepsin K (ab85716, AbCam) and mouse monoclonal anti-cathepsin S (E-3 SC271619 Santa Cruz) and actin used as loading control. Image analysis. Quantification of DN loss was performed stereologically as described previously16on regularly spaced DAB sections of mesencephalon cov-ering the whole SN (from rostral pole of the SN to the locus coeruleus) by bright-field microscopy using a Nikon microscope (Eclipse, 20× objective) equipped with a semi-automatic stereology system (Mercator software; Explora Nova VisioScan T4.18 system). The genotype of mice was unknown to the investigator at the time of quantification.
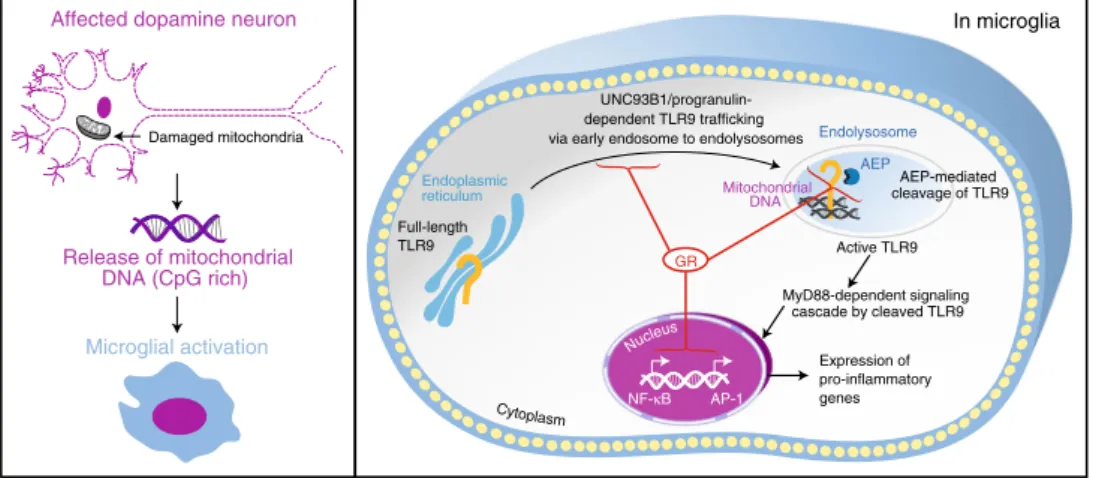
Cytoplasm
Mitochondrial DNA
In microglia
Affected dopamine neuron
Release of mitochondrial DNA (CpG rich) Microglial activation Damaged mitochondria Endoplasmic reticulum Expression of pro-inflammatory genes NF-κB AP-1 MyD88-dependent signaling cascade by cleaved TLR9 Endolysosome AEP-mediated cleavage of TLR9 Active TLR9 UNC93B1/progranulin-dependent TLR9 trafficking via early endosome to endolysosomes
Full-length TLR9 AEP Nucle us GR
Fig. 9 GR regulation of TLR9 activation in microglia that impacts dopamine neuron death. In Parkinson’s disease, chronically high cortisol levels likely compromise GR activity in innate immune cells. TLR9 levels are modulated in post-mortem Parkinson disease brains. Reduced GR activity in microglia permits activation of TLR9 by DAMPS such as CpG-rich mitochondrial DNA released from affected dopamine neurons that selectively exacerbates dopamine neuronal loss in substantia nigra. In microglia, intact GR activity acts as a brake for TLR9 activation and downstream inflammatory gene expression by regulating TLR9 trafficking through expression of UNC93B1 and progranulin and AEP-mediated cleavage of TLR9