HAL Id: hal-02565776
https://hal.archives-ouvertes.fr/hal-02565776
Submitted on 5 Nov 2020HAL is a multi-disciplinary open access archive for the deposit and dissemination of sci-entific research documents, whether they are pub-lished or not. The documents may come from teaching and research institutions in France or abroad, or from public or private research centers.
L’archive ouverte pluridisciplinaire HAL, est destinée au dépôt et à la diffusion de documents scientifiques de niveau recherche, publiés ou non, émanant des établissements d’enseignement et de recherche français ou étrangers, des laboratoires publics ou privés.
Infrared-Assisted Synthesis of Prebiotic Glycine
Debora Scuderi, Ariel Pérez-Mellor, Joël Lemaire, Suvasthika Indrajith,
Jean-Xavier Bardaud, Antonio Largo, Yannick Jeanvoine, Riccardo Spezia
To cite this version:
Debora Scuderi, Ariel Pérez-Mellor, Joël Lemaire, Suvasthika Indrajith, Jean-Xavier Bardaud, et al.. Infrared-Assisted Synthesis of Prebiotic Glycine. ChemPhysChem, Wiley-VCH Verlag, 2020, 21 (6), pp.503-509. �10.1002/cphc.202000065�. �hal-02565776�
Infra-Red Assisted Synthesis of Prebiotic Glycine**
Debora Scuderi,a,* Ariel Pérez-Mellor,b Joël Lemaire,a Suvasthika Indrajith,a Jean-Xavier Bardaud,c Antonio Largo,d Yannick Jeanvoineb and Riccardo Spezia e,*
aLCP, Laboratoire de Chimie Physique, Université Paris Sud, CNRS UMR 8000 15, rue Georges Clemenceau, 91405 Orsay Cedex (France)
bLAMBE, Université d’Evry, CNRS, CEA, Université Paris-Saclay, 91025 Evry (France) cENS Paris-Saclay (France)
dComputational Chemistry Group, Departamento de Quimica Fisica, Universidad de Valladolid, Valladolid 47011 (Spain)
eSorbonne Université, CNRS, Laboratoire de Chimie Théorique, 4, Place Jussieu, 75252 Paris Cedex 05 (France)
*correspondence to : debora.scuderi@upsud.fr ; riccardo.spezia@sorbonne-universite.fr
Abstract: A novel approach has been developed to synthesize complex organic molecules (COMs)
relevant to prebiotic chemistry, using Infra-Red (IR) radiation to trigger the reaction. A laboratory reactor working at low gas density and using IR irradiation was developed to give a hint on what pathways could happen in space conditions. In this way, glycine, the simplest brick of life, has been synthesized by assisting ion-molecule reaction with IR laser. Ion-molecule complex constituted by acetic acid and hydroxylamine was formed in a mass spectrometer reactor and then irradiated in the IR energy range. As photoproducts, we obtained both glycine structure and some of its isomers. Anharmonic vibrational frequency calculations and fragmentation dynamics simulations allow for a better interpretation of the experimental data. This novel approach can be now extended to study other new synthetic pathways responsible for the formation of several COMs observed in space.
Introduction
Chemical reactivity assisted by light provides a typical way of overcoming reaction barriers and triggering symmetry forbidden mechanisms.[1] In the wide field of light-activated reactions,
UV-Vis, which is at the basis of photochemistry,[2] and microwave assisted[3] chemical reactions
were largely investigated.
Among all the possible sources of activation, Infra-Red (IR) radiation is interesting. It is relatively soft and can directly affect the dynamics of the molecules by inducing the reactivity. However, only a few studies report chemical reactions controlled by IR. One reason is that IR often heats the sample as a global effect. This makes difficult for IR excitation to select specific reaction pathways. While IR can be used to break the specific bond that is excited,[4] more
complex reactions are challenging to be induced. IR pulses were also used to drive cis-trans isomerization.[5] Stensitzki et al. have shown that femtosecond IR pulse can trigger some
(UV) radiation could activate the synthesis of different COMs.[10] IR-induced COMs formation
also deserves research because of its wide presence in space: for example interstellar dust emits electromagnetic radiation in the IR range after absorbing in the UV.[11]
In the present study, we investigate the possibility of forming protonated glycine from the reaction:
NH3OH+ + CH3COOH à GlycineH+ + H2O
which was used by Bohme and co-workers[12] in a dense medium. Further calculations by Largo and co-workers have shown that this reaction occurs through a barrier and thus, it does not occurr in ultra-cold conditions.[13] Although the existence of glycine in the ISM has not been
confirmed after discussion in the astrophysics community,[14] its presence was found in the
well-studied Murchison meteorite[15] and recently in the comet
67P/Churyumov-Gerasimenko.[16] Notably, it was suggested that it can be formed in astrophysical ice by UV
irradiation.[17] Here we study the possibility of forming it in the gas phase at low-pressure (about 10-3 mbar) conditions by IR-assisted ion-molecule reaction.
Results and Discussion
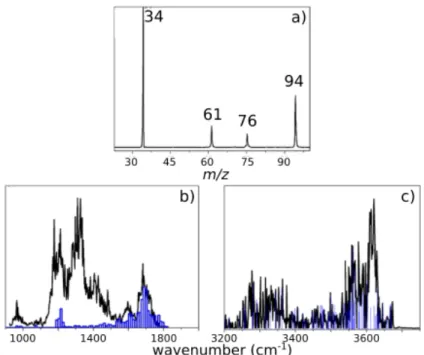
By injecting protonated hydroxylamine in Paul ion trap (PIT) mass spectrometer into which the neutral acetic acid was introduced by a home-made inlet system (see Figure S1) we obtain a resulting complex (m/z 94). Figure 1a reports the observed mass spectrum: m/z 34, 61 and 94 corresponding to NH3OH+, (CH3COOH)H+ and the complex (NH2OH:CH3COOH)H+,
respectively. No peak was observed at m/z 76, which corresponds to protonated glycine. Hydroxylamine has a proton affinity (195.4 kcal/mol) which is higher than acetic acid (187.5 kcal/mol),[18] but the ion internal energy allows some proton transfer and formation of high
energy species, m/z 61, even if with an intensity much smaller than m/z 34. Figure 1b shows the mass spectrum as obtained from the solution, indicating that a similar pattern is formed, where the complex at m/z 94 can be isolated with a higher ionic abundance, which will provide less noisy Infrared Multiple Photon Dissociation (IRMPD) spectra. After selecting the complex at m/z 94, it was possible to record the IRMPD spectra in the 800-2000 cm-1 (CLIO) and
3200-3800 cm-1 (OPO/OPA) spectral regions, shown in Figures 1c and 1d, respectively. For each
region of the IR spectrum, we show the results obtained directly from the ion-molecule reaction in the PIT (black lines) and those obtained by forming the complex in the solution (grey lines). The two spectra are identical, thus giving us confidence in using these last results to better understand the structure of the (NH2OH:CH3COOH)H+ complex and its subsequent IR-induced
reactivity.
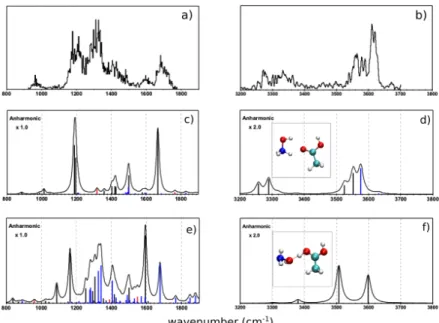
Figure 1. Mass spectra indicating the formation of the ion at m/z 94 a) by ion-molecule reaction in the
PIT b) in the ESI source. The y-axes in spectra a) and b) represent the ion count in arbitrary units; IRMPD spectra of ion at m/z 94 formed in the PIT by ion-molecule reaction in the 800-1800 cm-1 c) and in the 3200-3700 cm-1 d) energy regions. The grey lines represent the IRMPD spectra of the ion at m/z 94 formed in the ESI source. The y-axes in panels c) and d) represent the fragmentation efficiency in arbitrary units.
The molecular structure of the m/z 94 complex was determined by comparing IRMPD spectra and density functional theory (DFT) calculations done on several structures. Two conformers (labeled PRC7 and PRC9) were found to be better in agreement with experiments, as shown in Figure 2. We should remark that including anharmonicity largely modifies the theoretical spectra, making possible a better structure attribution. Anharmonic calculations, including combination bands and overtones, are especially important to correctly describe the 1200-1600 cm-1 energy range. Note that in PRC9 structure the excess proton is almost shared between the oxygen atoms of the two molecules.
Several broad bands characterize the IRMPD spectrum of m/z 94 ion in the fingerprint energy region. The most intense ones are observed at 1700, 1300 and 1200 cm-1. In the OH/NH
energy range, three leading intense bands are observed between 3500 and 3800 cm-1. Less
intense and broader bands can be found between 3200 and 3400 cm-1 in the same energy
region. The detailed list of the IRMPD band positions of m/z 94 with a tentative assignment (based on results of PRC7 and PRC9 complexes) is reported in Tables S3 and S4 with a discussion on their nature. Interestingly, the broadband at 1333 cm-1 comes mainly from overtones and combination bands of isomer PRC9. Being characteristic of the spectra of complex m/z 94, it shows the necessity of using anharmonic calculations to attribute structures to the observed species.
Figure 2. Comparison between the IRMPD spectrum of the complex m/z 94 in the a) 800-1900 cm-1
and b) 3200-3800 cm-1 energy ranges and the theoretical ones in the same energy ranges obtained with anharmonic calculations for the PRC7 (c and d) and PRC9 (e and f) isomers which are in better agreement with experimental spectra. Their structures are also reported in panels d) and f), respectively. The blue lines indicate combination bands and the red ones the overtones. The y-axes in spectra a) and b) represent the fragmentation efficiency in arbitrary units. The y-axes in spectra c)-f) represent the IR absorption theoretical intensity.
IRMPD is action spectroscopy: the absorbed IR photons induce fragmentation of the initial ion, and the spectra are obtained from the intensities of the precursor ion and that of photoproducts.[19] In other words, IR is used to make a chemical reaction, and then the IRMPD
spectrum is analyzed to obtain the vibrational signature. It is also interesting to see what the photoproducts are, and specifically look for the presence of ion m/z 76 (potentially corresponding to the protonated glycine or one of its isomers). The photoproducts have been analyzed at different wavelengths, and the resulting mass spectrum obtained at 1685 cm-1
(corresponding to an intense peak in the fingerprint region) is reported in Figure 3a. The ion
m/z 76 is observed and the other ones are m/z 34 and 61, resulting from the dissociation of
the complex.
The relative abundance of ion m/z 76 as a function of the wavenumber in the fingerprint and OH/NH energy regions is reported in Figures 3b and 3c. The m/z 76 was observed as photoproduct in different spectral regions. Notably, the 1500-1800 cm-1 region is where we
obtain most of m/z 76. In the broadband at around 1300 cm-1, which corresponds to several
combination bands, we have almost no m/z 76, while we have some increased intensity of m/z 76 at around 1200 cm-1 which corresponds to a single transition mode. We should also observe that in the OH/NH region m/z 76 is often present as photofragment between 3200 and 3700 cm-1, but the amount of m/z 76 is smaller at 3620 cm-1 which has been attributed to a
combination band of PRC7 and which should present a contribution of PRC9. Another aspect to point out is that the broadband at 1300 cm-1 is attributed to PRC9 structure only, while the
other ones mainly to PRC7. Likely, the difference in complex structure is related to the formation of m/z 76, even if the different nature of the band (fundamental vs overton/combination) cannot be excluded.
Figure 3. Mass spectrum of photoproducts observed following irradiation of m/z 94 complex obtained
at 1690 cm-1. b) IRMPD spectrum of m/z 94 complex (in black) with the relative abundance of the photoproduct m/z 76 (in blue) as a function of wavelength in the 800-1800 cm-1 energy. c) The same as panel b in the OH/NH region. The y-axis in spectrum a) represents the ion count in arbitrary units. The y-axes in spectra b) and c) represent the fragmentation efficiency in arbitrary units.
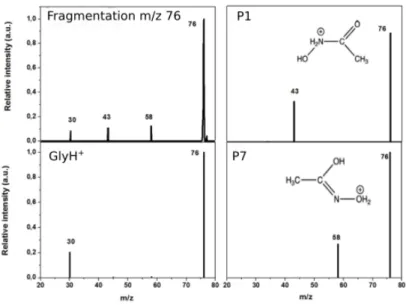
The quantity of photoproduct m/z 76 was not enough to directly characterize its structure by IRMPD, but enough for performing subsequent CID analysis. Results are shown in the top-left panel of Figure 4. Three fragments are characteristic of the photoproduct ion m/z 76: m/z 58, 43 and 30. CID of protonated glycine is well documented in the literature[20,21] and the main
fragment is m/z 30, corresponding to the formation of iminium ion, [CH2=NH2]+, which is often
used for its characterization,[12] and m/z 48, which corresponds to loss of the CO group. The CID spectrum of protonated glycine in the PIT is reported in Figure S6, confirming that these two peaks can be used for glycine characterization. In the CID of photoproduct m/z 76, we observe a peak at m/z 30, but we do not see any peak at m/z 48. Furthermore, we have two peaks that are absent in CID of protonated glycine, notably m/z 43 and 58. As reported by O’Hair et al.[21] m/z 48 corresponds to the loss of CO with the formation of cluster ion [H2NCH2+:H2O], and it is reasonable that if formed it can easily decompose into m/z 30 by
losing neutral water. More intriguing is the presence of ions m/z 43 and 58, which have an intensity comparable to m/z 30 and which are not characteristic of protonated glycine CID mass spectrum. They can be originated from other isomers of the same m/z 76 ion generated by IR irradiation.
Figure 4. Experimental CID of photoproduct m/z 76 (top-left panel) and theoretical CID of different
precursor ion structures: protonated glycine (GlyH+), P1 and P7 geometries. Structures of P1 and P7 are schematically reported.
Recently, by performing direct collisional dynamics between NH3OH+ and CH3COOH we have
obtained reaction product ions with m/z 76, which have different structures.[22] We have thus used these structures and that of protonated glycine as inputs for generating theoretical CID spectra from PM6-D direct dynamics.[23] The full list of fragments per initial structure is given in
Table S5. Some structures provide fragments observed in experimental CID of photoproduct ion m/z 76, and in particular protonated glycine (GlyH+) and isomers labeled P1, and P7. In
Figure 4 we report the fragmentation patterns as obtained in simulations and the corresponding structures (in Figure S7 we provide the other theoretical spectra). As expected, fragmentation of GlyH+ provides mainly ion m/z 30. Isomer P1, on the other hand, forms mostly
ion m/z 43, which comes from the C-N bond breaking leading to [CH3CO]+ and neutral NH2OH.
Finally, isomer P7 forms mainly ion m/z 58, which corresponds to water loss, due to direct N-O bond breaking. The photoproduct ion m/z 76 seems to be, thus, composed by different isomers other than protonated glycine.
Conclusion
A complex organic molecule was synthesized for the first time by inducing ion-molecule reaction through IR activation. The presence of the irradiation is crucial to let CH3COOH and
NH3OH+ react in low-density conditions. The stabilization of the complex, which was possible
thanks to the He bath and/or radiative deactivation, is also necessary for the reaction to occur under space conditions.
Then, IRMPD irradiation can trigger the synthesis of glycine through a mechanism that is different from isomerization or direct dissociation, but that implies a relevant structural rearrangement. The laser induces different reactions: the simple fragmentation of the complex but also a rearrangement and the formation of neutral water and the ion m/z 76. This reaction proceeds not only through the most stable structure (protonated glycine) but also towards high
energy structures that have the same mass but a different atomic arrangement. The laser has a crucial role not only in triggering the reaction but also in allowing the formation of high energy structures. Notably, when irradiating the broadband corresponding to combination bands of the complex m/z 94, the photoproduct m/z 76 is not formed or in a tiny amount. This can reside in the different reactivity of the two isomers of complexes and/or in the different photo-reactivity when absorbing at frequencies corresponding to combination bands.
Finally, this study paves the way for applying the same approach to other systems and suggest a possible route for the formation of COMs in the astrophysical context.
Experimental Section
Experimental Details. The ion-molecule reaction was done in a modified Paul ion trap (PIT) – Bruker Esquire 3000+ mass spectrometer coupled with two IR lasers: the Free Electron Laser CLIO (900-2000 cm-1) and a tabletop OPO/OPA (Laser Vision) (2800-3800 cm-1). The charged
complex (m/z 94) between protonated hydroxylamine and neutral acetic acid, has been mass-selected and subsequently irradiated by IR lasers to record its IRMPD spectrum. The photo-fragmentation yield R (R= -Log [(Iparent)/(Iparent + Ifragments)]) plotted versus the radiation
wavenumber generates the IRMPD spectrum of the sampled ion. Collision induced dissociation has been performed using He as a neutral gas. A collisional voltage of 0,5 V of amplitude has been employed to record the fragmentation spectrum of ion at m/z 94.
Theoretical calculations were carried out at B3LYP-D3/6-311++G(d,p) level of theory to obtain minimum energy structures of different m/z 94 complexes. Frequencies were calculated with anharmonic corrections. Finally, chemical dynamics simulations were obtained at PM6-D level of theory to model fragmentation spectra of protonated glycine and its isomers.
More details on experiments and calculations are reported in the Supporting Information. Acknowledgements
We thank ANR DynBioReact (Grant No. ANR-14-CE06-0029-01), CNRS program INFINITI (project ASTROCOL), project N°2013-0562-T, Chiraux IRUV (RTRA) for financial support and Project AYA2017-87515-P from the Government of Spain. R.S. thanks Universidad de Valladolid for a visiting professor fellowship. The authors thank J. M. Ortega, and the CLIO and SMAS staff for the useful assistance during the experiment at the FEL (Free Electron Laser) and CLIO (Centre Laser Infrarouge d’Orsay) facilities in Orsay. The authors appreciate fruitful discussions with P.Maître and M.Mostafavi.
Keywords: complex organic molecules • prebiotic chemistry • IR assisted synthesis • ion-molecule reactions • glycine
K. Glusac, Nature Chem. 2016, 8, 734-735; e) R. Brimioulle, T. Bach, Science 2013, 342, 840-843; f) J. Du, K. L. Skubi, D. M. Schultz, T. P. Yoon, Science 2014, 344, 392-396. g) P. J. M. Johnson, A. Halpin, T. Morizumu, V. I. Prokhorenko, O. P. Ernst, R. J. D. Miller, Nature Chem. 2017, 7, 980-986.
[3] a) R. Gedye, F. Smith, K. Westaway, H. Ali, L. Baldisera, L. Laberge, J. Rousell, Tetrahedron Lett. 1986, 27, 279-282; b) M. Nüchter, U. Müller, B. Ondruschka, A. Tied, W. Lautenschläger, Chem.
Eng. Technol. 2003, 26, 1207-1216; c) P. Lidström, J. Tierney, B. Wathey, J. Westman, Tetrahedron 2001, 57, 9225-9283; d) N. Elander, J. R. Jones, S.-Y. Lu, S. Stone-Elander, Chem. Soc. Rev., 2000, 29, 239-249; e) M. B. Gawande, S. N. Shelke, R. Zboril, R. S. Varma, Acc. Chem. Res. 2014, 47, 1338−1348.
[4] a) A. H. Zewail, Phys. Today 1980, 33, 27-33; b) R. Zare, Science 1998, 279, 1875-1879. [5] V. Botan, R. Schanz, P. Hamm, J. Chem. Phys. 2006, 124, 234511-234519.
[6] T. Stensitki, Y. Yang, V. Kozich, A. A. Ahmed, F. Kössl, O. Kühn, K. Heyne, Nature Chem. 2018,
10, 126-131.
[7] a) A. Thomas, J. George, A. Shalabney, M. Dryzhakov, S. J. Varma, J. Moran, T. Chervy, X. Zhong, E. Devaux, C. Genet, J. A. Hutchison, T. W. Ebbesen, Angew. Chem. Int. Ed. 2016, 55, 11462-11466; b) A. Thomas, L. Lethuillier-Karl, K. Nagarajan, R. M. A. Vergauwe, J. George, T. Chervy, A. Shalabney, E. Devaux, C. Genet, J. Moran, T. W. Ebbesen, Science 2019, 363, 615-619; J. Lather, P. Bhatt, A. Thomas, T. W. Ebbesen, J. George, Angew. Chem. Int. Ed. 2019, 58, 10635-10638.
[8] a) A. Pérez-Villa, F. Pietrucci, A. M. Saitta, Physics of Life Reviews 2018, in press. DOI: 10.1016/j.plrev.2018.09.004; b) R. Spezia, Y. Jeanvoine, D. Scuderi, in Origin and Evolution of
Biodiversity (Ed.: P.Pontarotti), Springer, 2018, pp 277-292; c) E. Roueff, F. Lique, Chem. Rev. 2013, 113, 8906-8938; d) E. Roueff, in Gas-Phase Chemistry in Space (Eds.: F.Lique,
A.Faure), IOP Publishing, 2019; pp 8–1 to 8–36.
[9] C. P. Endres, S. Schlemmer, P. Schilke, J. Stutzki, H. S. P. J. Müller, J. Mol. Spectrosc. 2016, 327, 95-104.
[10] a) P. de Marcellus, C. Meinert, I. Myrgorodska, L. Nahon, T. Buhse, L. Le Sergeant d’Hendecourt, U. J. Meierhenrich, Proc. Nat. Acad. Sci. USA 2015, 112, 965–970; b) G. M. Muñoz Caro, U. J. Meierhenrich, W. A. Schutte, B. Barbier, A. Arcones Segovia, H. Rosenbauer, W. H.-P. Thiemann, A. Brack, J. M. Greenberg, Nature 2002, 416, 403-406; c) P. de Marcellus, C. Meinert, M. Nuevo, J.-J. Filippi, G. Danger, D. Deboffle, L. Nahon, L. Le Sergeant d'Hendecourt, U. J. Meierhenrich,
Astrophys. J. Lett. 2011, 727, L27; d) C. Meinert, I. Myrgorodska, P. de Marcellus, T. Buhse, L.
Nahon, S. V. Hoffmann, L. Le Sergeant d’Hendecourt, U. J. Meierhenrich, Science 2016, 352, 208-212.
[11] a) W. J. Maciel, Astrophysics of the Interstellar Medium, Springer-Verlag New York, 2013; b) G.Garmire, Proc. Int. Conf. Cosmic Rays 1965, 1, 315-316; c) M. J. Rees, J. I. Silk, M. W. Werner, N. C. Wickramasinghe, Nature 1969, 223, 788-791; d) T. A. Porter, A. W. Strong, 29th Int. Cosmic Rays Conf. Pune 2005, 4, 77-80.
[12] J. L. Snow, G. Orlova, V. Blagojevic, D. K. Bohme, J. Am. Chem. Soc. 2007, 129, 9910-9917. [13] C. Barrientos, P. Redondo, L. Largo, V. M. Rayon, A. Largo, Astrophys. J. 2012, 748, 99.
[14] a) L. E. Snyder, F. J. Lovas, J. M. Hollis, D. N. Friedel, P. R. Jewell, A. Remijan, Astrophys. J. 2005, 619, 914−930; b) P. A. Jones, M. R. Cunningham, P. D. Godfrey, D. M. Cragg, Mon. Not.
R. Astron. Soc. 2007, 374, 579−589.
[15] J. R. Cronin, C. B. Moore, Science 1971, 172, 1327–1329.
[16] K. Altwegg, H. Balsiger, A. Bar-Nun, J.-J. Berthelier, A. Bieler, P. Bochsler, C. Briois, U. Calmonte, M. R. Combi, H. Cottin, et al., Sci. Adv. 2016, 2, e1600285.
[17] D. E. Woon, Astrophys. J. 2002, 571, L177−L180.
[18] F. Siro Brigiano, Y. Jeanvoine, A. Largo, R. Spezia, Astron. Astrophys. 2018, 610, A26. [19] N. Polfer, Chem. Soc. Rev. 2011, 40, 2211-2221.
[21] R. A. O’Hair, P. S. Broughton, M. L. Styles, B. T. Frink, C. M. Hadad, J. Am. Soc. Mass Spectrom. 2000, 11, 687-696.
[22] Y. Jeanvoine, A. Largo, W. L. Hase, R. Spezia, J. Phys. Chem. A 2018, 122, 869-877. [23] K. Song, R. Spezia, Theoretical Mass Spectrometry, De Gruyter, Berlin, 2018.