HAL Id: halshs-00459380
https://halshs.archives-ouvertes.fr/halshs-00459380
Submitted on 23 Feb 2010
HAL is a multi-disciplinary open access
archive for the deposit and dissemination of
sci-entific research documents, whether they are
pub-lished or not. The documents may come from
L’archive ouverte pluridisciplinaire HAL, est
destinée au dépôt et à la diffusion de documents
scientifiques de niveau recherche, publiés ou non,
émanant des établissements d’enseignement et de
Inter-Korean maritime linkages: Economic integration
vs. hub dependence, 1985-2005
César Ducruet, Stanislas Roussin
To cite this version:
César Ducruet, Stanislas Roussin. Inter-Korean maritime linkages: Economic integration vs. hub
dependence, 1985-2005. 15th European Conference on Theoretical and Quantitative Geography
(EC-TQG), Sep 2007, Montreux, Switzerland. pp.133-139. �halshs-00459380�
INTER-KOREAN MARITIME LINKAGES
Economic integration vs. hub dependence, 1985-2005
César DUCRUET
Assistant Professor, Erasmus University Rotterdam
Stanislas ROUSSIN
General manager & Head of Research Department, SERIC-COREE
ABSTRACT
This paper investigates the spatial evolution of inter-Korean maritime connections for the last two decades. Based on the circulation pattern and capacity of trading vessels‟ movements, it applies the Gini coefficient to the ring of external ports connecting North Korea to the outside world. Results show the gradual isolation of North Korea and the increased importance of neighboring transit ports through three main stages. First, traffics concentrate in global hub ports (Singapore, Hong Kong, and Japanese ports). Second, traffics split and spread to closer and smaller transit ports (Busan, Dalian, Nakhodka). Third, traffics re-concentrate upon Incheon, South Korea, which has become the dominant load center of the North in recent years. One difficulty is therefore whether such spatial shift should be attributed to the betterment of inter-Korean relationships (e.g. 2000 summit, maritime agreement) or to the internal problems of North Korea in terms of infrastructure decay and lacks of handling capacity at its ports. Such research allows complementing port concentration studies by analyzing external hub dependence in the case of a collapsing and increasingly isolated economy.
KEYWORDS
DPRK, External Hub, Gini Coefficient, North Korea, Port Concentration
INTRODUCTION
Throughout transport geography, the evolution of port system concentration has been widely analyzed as a means to understand regional or national changing trade patterns. The degree of traffic concentration within a port system illustrates the combination of internal factors (e.g., infrastructure investment, port policy) and external factors (e.g., strategies of international players such as shipping lines, port competition, hinterland coverage). In particular, some studies have used the Gini coefficient to highlight port concentration among port ranges, stemming from economies of scale in transportation favoring the concentration of traffic at transport hubs [1] [2] [3] [4].
This paper proposes a complementary and original approach based on the specific case of North Korea. While the concentration of the North Korean port system itself has been analyzed recently [5], showing the growing importance of Nampo as Pyongyang‟s gateway, this research focuses more on its external connections. Thus, it applies the Gini coefficient to the first “maritime ring” so as to better highlight how external ports are used by shipping lines to connect a relatively closed and declining country. Such analysis is made possible through accessing data from Lloyd‟s Marine Intelligence Unit, which provides detailed information on 80% of the world‟s commercial fleet in terms of circulation, capacities, and other. It is the only reliable and independent source to study port activities in a country where scarcity of data is by no means a barrier to research.
The first part describes the importance of sea transport between the two Koreas. The second part analyses port concentration at the maritime ring, and zooms on inter-Korean maritime linkages. The third part synthesize the results through evaluating the main factors underlying the observed changes.
SEA TRANSPORT AND INTER-KOREAN RELATIONSHIPS General context
Following the June 2000 inter-Korean summit, economic ties between the Democratic People‟s Republic of Korea (hereafter North Korea) and the Republic of Korea (hereafter South Korea) have grown up rapidly from almost nothing. Since 2004, South Korea is the second largest trading partner of North Korea with 25% of the North‟s total trade, still lagging behind China (39%). Also, two cooperation projects have been developed along the border: the industrial park of Gaeseong, where a dozen of South Korean companies hire 10,000 North Korean workers, and the International Tourism Free Zone of Mount Geumgang, already visited by more than one million South Korean visitors. Despite the peak of diplomatic tension due to missile tests and nuclear test in 2006, those projects have been kept going, and there are plans to enlarge their capacity.
Beside this positive trend, other political factors need to be taken into account in order to better understand the complexity of inter-Korean relationships. The absence of a sustainable peace on the peninsula can only be solved through US agreement if North Korea stops any suspected illicit trade and nuclear-based experiments. Because South Korea is seen as the ally of the US, inter-Korean dialogue is spasmodic and frequently interrupted on major issues, while the North is kept under embargo. The demilitarized zone (DMZ) is thus the physical expression of the political tension between different ideologies since 1953. Only a few trucks are allowed to cross the DMZ, notably between Seoul region and Gaeseong. The issue of the reconnection of inter-Korean railways has been delayed recently [6]. Such barriers give to maritime transport important stakes in sustaining growing trade between North and South.
Maritime Transport in a Socialist Country
Maritime transport has never been a top priority in North Korean development for two reasons. First, the application of a “Soviet” model to its transportation system has kept sea transport between 10-15% of the modal split while rail transport occupies the main part, i.e. at least 70% [7]. Second, the main trading partners, China and Russia, are directly accessible by land transport. Although logistics in North Korea are gradually facing interregional disrupts such as infrastructure dereliction resulting in cost and time overdue to and from Pyongyang [8], still nowadays about 80% of the country‟s exports pass through Sinuiju at the border with China. Also, current Chinese strategies at Rajin-Seonbong tend to turn the unsuccessful free-trade zone into a new gateway securing direct access to the Pacific [9]. Thus, although maritime transport has a secondary role in foreign trade, it is interesting to analyze it because it better reflects a degree of internationalization through long-distance relationships.
According to former examples of economic transition in socialist countries, long-distance maritime connections develop rapidly with the intervention of global players that are willing to extend their networks worldwide [10] [11] [12], in parallel with shortsea connections. Of course, the deployment of trading networks depends on the regime‟s attitude towards the outside world through port modernization and institutional reform [13]. Although North Korea is still said to be a closed country, it is more a consequence of external pressures than internal strategies. Since 1984 but mostly from 2002, economic reforms have been launched so as to give more impetus to local entrepreneurship and foreign investment. While those reforms do not yet reach the level of those implemented elsewhere, they are probably an indication that the opening of North Korea is “underway and probably unstoppable” [14].
AN ANALYSIS OF EXTERNAL PORT CONCENTRATION
The Gini Coefficient
Vessel capacities in deadweight tonnage (DWT) are summed for every port connected by sea to North Korea regardless of inbound or outbound voyage. Such ports are those through which vessels enter or leave North Korea before and after calling at its ports. Yearly figures are agglomerated by 3-years periods in order to avoid blank values arising from irregular shipping (tramping) that is predominantly based on bulky products (raw materials).
The Gini coefficient expresses the degree of concentration (inequality) of a variable in a distribution of its elements. It compares the Lorenz curve of a ranked empirical distribution with the line of perfect equality. This line assumes that each element has the same contribution to the total summation of the
values of a variable. The Gini coefficient ranges between 0, where there is no concentration (perfect equality), and 1 where there is total concentration (perfect inequality). As a complement to Gini coefficient, the dissimilarity index is also used to express inequality, and is also known as the summation of vertical deviations or „Lorenz differences‟ [15].
Table 1 shows the dissimilarity index and the Gini concentration coefficient for two different port samples. The „main ring‟ is composed of 48 ports having cargo volumes for every period, while the „total ring‟ contains a larger number although some ports are irregularly represented. In both rings, three stages can be observed: concentration, de-concentration, and concentration. This important mutation helps understanding the underlying spatial shift of traffics.
Figure 1 indicates this evolution for the 10 main transit ports. Singapore, Dalian (China), Niigata (Japan) and Hong Kong were dominant until the collapse of the Soviet Union (1991) and the political change after the death of former president Kim Il-Sung (1994). Until the late 1990s, traffics are spread more homogeneously while shifting from those global hubs to smaller regional ports. Since then, a new period of concentration occurs, selecting closer transit ports such as Nakhodka (Russia), Busan, and Incheon (South Korea). Such unprecedented concentration ratios are mainly explained by the growing importance of Incheon as the main load center of North Korea. The decline of Japanese transit traffics is more of political impact, following the banning of North Korean vessels from Japanese ports due to long range missiles test, nuclear weapons development and some suspected illicit activities [16].
The Multiplication of Inter-Korean Maritime Linkages
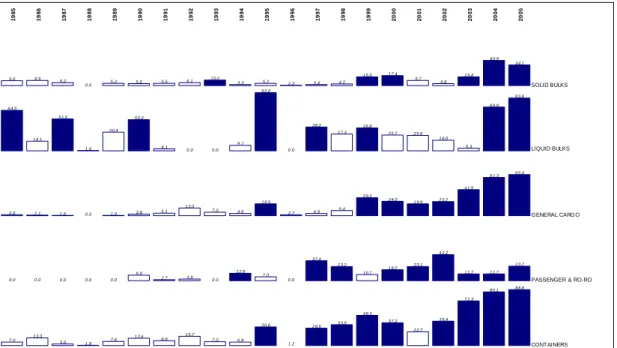
In the last two decades, inter-Korean shipments have become of first importance in overall North Korea‟s seaborne activity. The trend by product (Figure 2) shows that although there in a regular increase of the share of North-South trade in total DPRK trade since the late 1990s, this share has only become dominant since 2004. It coincides with the start of the operation of the Gaeseong Industrial Complex, sands extraction in Haeju area, graphite exports to South Korea and the signature of the inter-Korean maritime agreement. Of all goods by sea, only liquid bulks (oil products, chemicals) have been significantly concerned by North-South trade in the 1980s, though very irregularly. Solid bulks, passengers and ro-ro (ferry) are still nowadays only secondarily funded on traffics with South Korea, due to the sustain of some linkages with other partners. However, container and general cargo, the most profitable traffics, are dominated by South Korea. This has several implications for the two countries in terms of technological diffusion and integration.
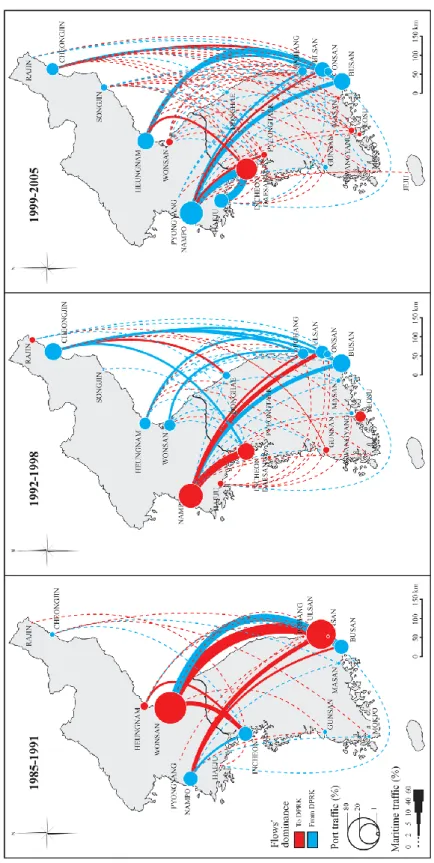
One striking phenomenon to be observed between the two Koreas is not only the rise of traffics but their geographical expansion (Figure 3). The first period is defined by a dominant eastern system linking the major poles for heavy industry in the two countries, i.e. Wonsan and Ulsan, based on oil refinery and chemicals (e.g. fertilizers) but also Busan, the manufacturing center and port hub of the growing South [17]. The second period marks the establishment of two relatively distinct systems with dominant DPRK imports in the West and dominants DPRK exports in the East. Each system may be defined by a distinct logic, such as humanitarian aid distribution to Nampo and shipment of local products to the South. The third period is characterized by a growing complexity in the pattern of maritime linkages, with a concentration on the Incheon-Nampo route and the formation of a multi-polar network mostly funded on small volumes. This matches the broader trend defined by concentration (Ulsan and the East coast), de-concentration (more connections, East-West balance), and re-concentration (Incheon, the West coast, and continued split).
POLITICAL AND TECHNICAL FACTORS AFFECTING PORT CONCENTRATION Ageing infrastructure and lack of investment
As seen in Figure 4, a major trend affecting the evolution of North Korean maritime activity is the downsize of average ship capacity since 1991 (collapse of the Soviet Union), in parallel with increasing inter-Korean port connections. This means that bigger and non-DPRK ships are fewer and fewer, which is totally in contradiction with the trend of globalization in the shipping industry, funded on bigger vessels, longer voyages and increased foreign participation. Although total capacity has regained its original levels in the late 1990s and early 2000s, average capacity is continuously decreasing. Such trends clearly confirm existing assumptions about ageing North Korean ships, outdated port infrastructures and excessive shipping costs to and from North Korea [18]. This results in an „X‟ shaped trend as more ships of lower capacity are needed to support similar or even smaller cargo volumes. Such trend is to some extent similar to the Mediterranean case, where new hubs such as Gioia Tauro
have been developed to concentrate traffics of mother vessels, and serve mainland ports through feeder vessels. This is observed in several other areas such as Caribbean and South Asia. Also there, one main factor is the lack of investment in modern port facilities. Thus, the North Korean case confirms the need for carriers to rationalize their services, favoring in turn port concentration at a few main load centers. However, the main difference with other countries is that North Korea has become unable to ensure regular shipping, resulting in the disappearance of long distance connections, and in the dependence upon external, rather than national, load centers.
The development of an integrated inter-Korean maritime network?
Because land-based networks are not well connected, sea transport concentrates 90% of inter-Korean trade on a regular basis [19]. This has been partly made possible with the 2004 inter-Korean Maritime Agreement that enables the free circulation of both ships within a common area, and the opening of new sea lanes between Korean ports [20]. As a result, inter-Korean maritime traffics have hit a record of 15.7 million tons and 12,329 TEUs in 2006 [21]. Such importance is also backed by the South Korean intentions to modernize North Korean ports, which are suffering from the overall economic collapse of the country. Although Incheon and Nampo have signed an agreement in 2005 for establishing more shuttle services, projects related to infrastructure have failed until now: the project of Hyundai group to develop cruise, shipbuilding and repair at Wonsan [22]; the project of Korea Container Terminal Authority (KCTA) to develop a container terminal and freight station at Nampo [23]; and the project of an inter-Korean hub at Heungnam [24]. It seems that most port-related investments in the North are from China, either in Nampo, the port of Pyongyang, or in Rajin, located at the border with China and Russia. Thus, the political will to enhance inter-Korean port cooperation is not yet sufficient to launch shared investments in port infrastructures, but it has allowed South Korea to become North Korea‟s main transit hub to connecting the outside world.
CONCLUSION
The analysis of the evolution of inter-Korean maritime networks brings several questions that are difficult to answer. On one hand, the betterment of political relationships between the two Koreas has allowed more traffic between their respective ports. On the other hand, this phenomenon is influenced by a specific context defined by the North‟s internal and external pressures. It may constitute a first approach to port concentration in the case of a declining economy, rather than opening economies as seen in the case of South China‟s dependence on the Hong Kong hub. For geography and network theory, the North Korean case is a fruitful complement to the complex relationships between network concentration and economic evolution, through the intervening of:
- Technical factors: shipping lines use the „hub and spoke‟ system to transform the closest
neighboring ports into transshipment points as a remedy to the lacking capacity of - and the reduced direct calls to - North Korea. Incheon is the leading hub due to lower cost and better access to North Korea‟s core region via the Nampo load center. Thus, other inter-Korean sea routes are dominated by non-commercial and non-regular flows such as aids and tramping;
- Political factors: growing inter-Korean commercial flows that would normally take place
inland are shifted to sea lanes due to DMZ blockages. Concentration between Incheon and Nampo reflects the expanding ties between Seoul and Pyongyang, while the multiplication of other routes depicts the increasing importance of South Korea in the revival of North Korea‟s local economies. South Korea is the major sea hub and one important economic enabler of technological transfer to - and modernization of - the North, to prepare reunification.
REFERENCES
1. Langen, P.W. de, Forecasting container throughput: a method and implications for port planning, Journal of International Logistics and Trade, 1(1), 2003, pp. 29-40.
2. De, P. and Park, R.K., Container port system concentration, Transportation Quarterly, 57(4), 2003, pp. 69-82.
3. Notteboom, T., Concentration and load centre development in the European container port system, Journal of Transport Geography, 5, 1997, pp. 99-115.
4. Notteboom, T., Traffic inequality in seaport systems revisited, Journal of Transport Geography, 14, 2006, pp. 95-108.
5. Ducruet, C. and Jo, J.C., Coastal cities, port activities and logistic constraints in a socialist developing country: the case of North Korea, Transport Reviews (forthcoming).
6. Comment on the postponement of test-run of inter-Korean trains, Ministry of Unification in South Korea, May, 2006.
7. Jo, J.C. and Ducruet, C., Maritime trade and port evolution in a socialist developing country: Nampo, gateway of North Korea, The Korea Spatial Planning Review, 51, 2006, pp. 3-24.
8. Roussin, S. and Ducruet, C., Logistic perspectives in DPRK, in Proceedings of the Annual Fall Meeting of the Korean Society of Coastal and Ocean Engineers, September 15-16, Seoul, Korea, 2006.
9. Jo, J.C. and Ducruet, C., Rajin-Seonbong, new gateway of Northeast Asia, Annals of Regional Science (forthcoming).
10. Thorez, P., La difficile mutation des transports maritimes dans la CEI, Bulletin de l‟Association des Géographes Français, 1, 1998, pp. 343-362.
11. Wang, J.J., A container load center with a developing hinterland: a case study of Hong Kong, Journal of Transport Geography, 6(3), 1998, pp. 187-201.
12. Serry, A., La réorganisation portuaire de la Baltique orientale: l'émergence d'une nouvelle région en Europe. Unpublished PhD in Geography, Le Havre, 2006.
13. Airriess, C.A., The spatial spread of container transport in a developing regional economy: North Sumatra, Indonesia, Transportation Research A: General, 23(6), 1989, pp. 453-461.
14. Beal, T., Pyongyang goes to market: marketization of the North Korean economy. Discussion Paper, Victoria University of Wellington, New Zealand, 2004.
15. Rodrigue, J.P., Comtois, C. and Slack, B., The geography of transport systems,
http://people.hofstra.edu/geotrans/eng/ch3en/conc3en/worldcontainertraffic.html 16. Japan will ban North Korean ships, Lloyd‟s Register, June 2nd
, 2004.
17. Frémont, A. and Ducruet, C., The emergence of a mega-port: the case of Busan, from the global to the local, Tidschrift voor Econ. Soc. Geographie, 96(4), 2005, pp. 421-432.
18. Ahn, M.Y., Slow boat to North Korea, Cargo News Asia, May 7th, 2001.
19. Olsen, J., Vannoni, M. and Koelm, J., Maritime cooperation for the Koreas, Sandia Working Paper n° 1843p, Cooperative Monitoring Center, Albuquerque, 2003.
20. Two Koreas to open intra-Korean sea routes, People‟s Daily, June 7th , 2004.
21. Inter-Korean maritime shipping volume up 240 percent, Vietnam News Agency, January 10th, 2007.
22. Hyundai to launch North Korean cruises, Lloyd‟s Register, July 3rd, 1998. 23. South Korean investors eye North‟s Nampo, Lloyd‟s Register, September 22nd
, 2005. 24. North eyes inter-Korean port in the East, Joongang Daily, June 14th, 2006.
AUTHORS
* César Ducruet is assistant professor at Erasmus University, Rotterdam. He graduated his PhD in Geography entitled “Port cities, laboratories of globalization” in 2004 at Le Havre University. He currently works under Marie Curie scholarship on the geography of container terminals in Europe and the world [http://www.porteconomics.nl].
* Stanislas Roussin is general manager and Head of Research Department of SERIC COREE, a consulting company based in Seoul and Pyongyang [http://www.seric-coree.com].
TABLES AND FIGURES 1985-1987 1988-1990 1991-1993 1994-1996 1997-1999 2000-2002 2003-2005 Main ring Dissimilarity index 0.40 0.39 0.35 0.41 0.43 0.46 0.44 Gini coefficient 0.65 0.61 0.53 0.58 0.61 0.65 0.76 Number of ports 48 48 48 48 48 48 48 Total ring Dissimilarity index 0.53 0.53 0.49 0.50 0.54 0.55 0.51 Gini coefficient 0.76 0.75 0.69 0.68 0.74 0.76 0.79 Number of ports 181 166 153 165 186 169 149
Table 1: Evolution of port concentration within North Korea‟s maritime ring
INCHEON BUSAN NAKHODKA NAGOYA ULSAN SINGAPORE DALIAN NIIGATA HONG KONG 1 9 8 5 1 9 8 6 1 9 8 7 1 9 8 8 1 9 8 9 1 9 9 0 1 9 9 1 1 9 9 2 1 9 9 3 1 9 9 4 1 9 9 5 1 9 9 6 1 9 9 7 1 9 9 8 1 9 9 9 2 0 0 0 2 0 0 1 2 0 0 2 2 0 0 3 2 0 0 4 2 0 0 5
Figure 1: North Korea related traffics at main transit ports, 1985-2005 (Unit: DWT) Data source: Lloyd‟s Marine Intelligence Unit
Figure 2: Geographical evolution of inter-Korean maritime networks, 1985-2005 (Unit: % DWT) Data source: Lloyd‟s Marine Intelligence Unit
9 .6 9 .9 6 .2 0 .0 5 .2 5 .0 5 .5 6 .1 1 0.2 3 .3 5 .2 2 .3 3 .4 4 .2 1 5.5 1 7.4 9 .7 4 .8 1 5.4 4 0.9 3 4.1 6 4.5 1 6.1 5 1.0 1 .6 3 0.4 5 0.0 4 .1 0 .0 0 .0 9 .7 9 2.0 0 .0 3 8.2 2 7.3 3 6.8 2 5.7 2 5.6 1 8.0 5 .3 6 9.8 8 3.8 2 .6 2 .1 1 .6 0 .5 1 .9 3 .8 5 .1 1 3.3 7 .0 4 .6 1 9.9 2 .7 4 .9 9 .4 2 9.2 2 4.0 1 9.9 2 3.2 4 1.9 6 1.3 6 5.4 0 .0 0 .0 0 .0 0 .0 0 .0 9 .8 2 .7 3 .8 0 .0 1 2.8 7 .0 0 .0 3 2.4 2 3.2 1 0.7 1 8.2 2 3.1 4 2.2 1 1.7 1 1.7 2 3.7 7 .0 1 3.3 3 .6 1 .8 7 .6 1 2.6 8 .6 1 5.7 7 .0 6 .8 3 0.6 1 .2 2 8.5 3 3.8 4 8.3 3 7.2 2 2.7 3 9.4 7 1.3 8 5.1 8 8.8 SOLID BULKS LIQUID BULKS GENERAL CARGO
PASSENGER & RO-RO
CONTAINERS 1 9 8 5 1 9 8 6 1 9 8 7 1 9 8 8 1 9 8 9 1 9 9 0 1 9 9 1 1 9 9 2 1 9 9 3 1 9 9 4 1 9 9 5 1 9 9 6 1 9 9 7 1 9 9 8 1 9 9 9 2 0 0 0 2 0 0 1 2 0 0 2 2 0 0 3 2 0 0 4 2 0 0 5
Figure 3: Share of inter-Korean trade in total DPRK sea trade by product, 1985-2005 (% DWT) Data source: Lloyd‟s Marine Intelligence Unit
0 1 0 2 0 3 0 4 0 5 0 6 0 7 0 1 9 8 5 1 9 8 7 1 9 8 9 1 9 9 1 1 9 9 3 1 9 9 5 1 9 9 7 1 9 9 9 2 0 0 1 2 0 0 3 2 0 0 5 N b N o r th -S o u th c o n n e c ti o n s 0 2 0 0 0 4 0 0 0 6 0 0 0 8 0 0 0 1 0 0 0 0 1 2 0 0 0 1 4 0 0 0 A v e r a g e s h ip c a p a c it y ( D W T ) In te r-p o rt c o n n e c tio n s A ve ra g e c a p a c ity
Figure 4: Evolutional trends of North Korean shipping, 1985-2005 Data source: Lloyd‟s Marine Intelligence Unit