HAL Id: hal-03121376
https://hal.archives-ouvertes.fr/hal-03121376
Submitted on 26 Jan 2021
HAL is a multi-disciplinary open access
archive for the deposit and dissemination of
sci-entific research documents, whether they are
pub-lished or not. The documents may come from
teaching and research institutions in France or
abroad, or from public or private research centers.
L’archive ouverte pluridisciplinaire HAL, est
destinée au dépôt et à la diffusion de documents
scientifiques de niveau recherche, publiés ou non,
émanant des établissements d’enseignement et de
recherche français ou étrangers, des laboratoires
publics ou privés.
Aerosol indirect effect on warm clouds over South-East
Atlantic, from co-located MODIS and CALIPSO
observations
L. Costantino, F.-M. Bréon
To cite this version:
L. Costantino, F.-M. Bréon. Aerosol indirect effect on warm clouds over South-East Atlantic, from
co-located MODIS and CALIPSO observations. Atmospheric Chemistry and Physics, European
Geo-sciences Union, 2013, 13 (1), pp.69-88. �10.5194/acp-13-69-2013�. �hal-03121376�
Atmos. Chem. Phys., 13, 69–88, 2013 www.atmos-chem-phys.net/13/69/2013/ doi:10.5194/acp-13-69-2013
© Author(s) 2013. CC Attribution 3.0 License.
Atmospheric
Chemistry
and Physics
Aerosol indirect effect on warm clouds over South-East Atlantic,
from co-located MODIS and CALIPSO observations
L. Costantino and F.-M. Br´eon
Laboratoire des Sciences du Climat et de l’Environnement, Unit´e Mixte de Recherche CEA-CNRS-UVSQ, UMR8212, 91191 Gif sur Yvette, France
Correspondence to: L. Costantino (lore.costantino@gmail.com)
Received: 25 April 2012 – Published in Atmos. Chem. Phys. Discuss.: 7 June 2012 Revised: 5 November 2012 – Accepted: 19 November 2012 – Published: 4 January 2013
Abstract. In this study, we provide a comprehensive
analy-sis of aerosol interaction with warm boundary layer clouds over the South-East Atlantic. We use aerosol and cloud pa-rameters derived from MODIS observations, together with co-located CALIPSO estimates of the layer altitudes, to de-rive statistical relationships between aerosol concentration and cloud properties. The CALIPSO products are used to dif-ferentiate between cases of mixed cloud-aerosol layers from cases where the aerosol is located well-above the cloud top. This technique allows us to obtain more reliable estimates of the aerosol indirect effect than from simple relationships based on vertically integrated measurements of aerosol and cloud properties. Indeed, it permits us to somewhat distin-guish the effects of aerosol and meteorology on the clouds, although it is not possible to fully ascertain the relative con-tribution of each on the derived statistics.
Consistently with the results from previous studies, our statistics clearly show that aerosol affects cloud micro-physics, decreasing the Cloud Droplet Radius (CDR). The same data indicate a concomitant strong decrease in cloud Liquid Water Path (LWP), which is inconsistent with the hypothesis of aerosol inhibition of precipitation (Albrecht, 1989). We hypothesise that the observed reduction in LWP is the consequence of dry air entrainment at cloud top. The combined effect of CDR decrease and LWP decrease leads to rather small sensitivity of the Cloud Optical Thickness (COT) to an increase in aerosol concentration. The anal-ysis of MODIS-CALIPSO coincidences also evidences an aerosol enhancement of low cloud cover. Surprisingly, the Cloud Fraction (CLF) response to aerosol invigoration is much stronger when (absorbing) particles are located above cloud top than in cases of physical interaction. This result
suggests a relevant aerosol radiative effect on low cloud oc-currence: absorbing particles above the cloud top may heat the corresponding atmosphere layer, decrease the vertical temperature gradient, increase the low tropospheric stability and provide favourable conditions for low cloud formation.
We also analyse the impact of anthropogenic aerosols on precipitation, through the statistical analysis of CDR-COT co-variations. A COT value of 10 is found to be the threshold beyond which precipitation is mostly formed, in both clean and polluted environments. For larger COT, polluted clouds show evidence of precipitation suppression.
Results suggest the presence of two competing mecha-nisms governing LWP response to aerosol invigoration: a drying effect due to aerosol enhanced entrainment of dry air at cloud top (predominant for optically thin clouds) and a moistening effect due to aerosol inhibition of precipitation (predominant for optically thick clouds).
1 Introduction
The climate relevance of the anthropogenic aerosol impact on clouds has been documented by the Intergovernmental Panel on Climate Change (IPCC, 2007), which also stresses the large uncertainties both in the competing processes and the quantification of the impact. An increase in particle con-centration acting as CCN (Cloud Condensation Nuclei) can enhance Cloud Droplet Number Concentration (CDNC), re-sulting in a reduction of the mean droplet size. For the same overall amount of liquid water, a cloud made of more nu-merous smaller droplets reflects more than a cloud with fewer and larger droplets (Twomey, 1974, 1977). Thus, an
70 L. Costantino and F.-M. Br´eon: Aerosol indirect effect on warm clouds over South-East Atlantic
increase in aerosol load can lead to an increase in cloud re-flectance, assuming that cloud liquid water content remains unchanged. This process, referred to as “Twomey’s effect” or “first Aerosol Indirect Effect” (AIE #1) may produce a negative radiative forcing and, therefore, a net cooling effect on climate. In addition, a further impact of the aerosol in-teraction with clouds is derived from the strong reduction of collision-coalescence processes in polluted clouds (smaller droplets) leading to a decrease of precipitation efficiency (Al-brecht, 1989). Inhibition of precipitation may increase cloud lifetime and cloud Liquid Water Path (LWP), with a possible further increase in Cloud Optical Thickness (COT) and cloud reflectance. This process is referred to as the “second aerosol indirect effect” (AIE #2) and may significantly affect cloud cover.
Aerosol impact on cloud microphysics (cloud droplet con-centration and size distribution) has been studied since the late 50s. Warner and Twomey (1967) and Warner (1967) re-ported an increase of CCN number concentration, as a con-sequence of the incorporation of smoke aerosol from sugar cane fires into clouds, and a decrease of cloud droplet mean radius (potentially impeding the growth of rain drops for coa-lescence). The aerosol impact on cloud microphysics is now well-established on a global scale through several satellite-based analysis (e.g., Br´eon et al. 2002; Feingold et al., 2003; Costantino and Br´eon, 2010). However, the response of cloud liquid water to aerosol enhancement is still poorly quanti-fied. A number of studies show a significant positive cor-relation between liquid water path and CCN (Quaas et al., 2008, 2009; Loeb and Shuster, 2008), some indicate a small, but positive correlation (Nakajima et al., 2001; Sekiguchi et al., 2003), while a few demonstrate a negative correlation (Twohy et al., 2005; Matsui et al., 2006; Lee at al., 2009). The widely varying estimate of the aerosol impact on liq-uid water path, either positive or negative (Han et al., 2002), may depend on the cloud regime (Lebsock, 2008), on the hu-midity profile above cloud top (Ackerman et al., 2004) or be mostly driven by local meteorology (Menon et al., 2008). As a consequence, the overall aerosol effect on COT and cloud albedo remains unclear, which results in large uncertainties for the aerosol radiative forcing quantification.
Regarding the aerosol impact on cloud life cycle, a strong positive relationship between Cloud Fraction (CLF) and Aerosol Optical Depth (AOD) was found in several satellite-based analysis (Menon et al., 2008; Quaas et al., 2009, 2010). Many studies (reviewed by Stevens and Feingold, 2009) agree that aerosol optical depth and low cloud incidence cor-relate well with the same meteorological parameters (surface wind speed, atmospheric moisture, stability, etc.). Local vari-ations of one of these parameters may produce misleading co-variations of aerosol and cloud retrievals. It is then of primary importance (but also very difficult) to untangle the impacts of aerosol and meteorology on cloud parameters, in statistical analysis based on spaceborne observations. In ad-dition, satellite products of aerosol description may be
af-fected by the presence of nearby clouds, leading to spurious correlations between aerosol and cloud parameters (Marshak et al., 2008; Wen et al., 2008; Varnai and Marshak, 2009).
1.1 Purpose and strategy
Our objective is to use satellite remote-sensing observa-tion from simultaneous MODIS and CALIPSO retrievals of aerosol and cloud properties to provide further observation-based evidence of aerosol-induced effect on microphysics (CDR), optical properties (COT), structure (LWP, CLF) and life cycle (precipitation occurrence) of warm boundary layer clouds. The originality of the work lies in the focus over the South-East Atlantic and the use of CALIPSO data to pro-vide a vertical description of the aerosol and cloud layers, in addition to the horizontal sampling by MODIS. Based on CALIPSO information, the aerosol and cloud layers are as-sumed to be in direct interaction if their altitudes are very close (within a certain threshold). For such cases, a change in cloud properties with respect to a variation in aerosol con-centration is interpreted as the result of an aerosol driven pro-cess. On the other hand, if aerosol and cloud layers are well separated, the observed cloud change is considered to be in-duced by other causes than direct cloud-aerosol interaction. Thus, although the reduced temporal sampling of the satellite data does not allow a causality assessment from the statistics, the analysis of MODIS-CALIPSO coincidences permits us to isolate (to a certain degree) aerosol-induced effects from me-teorology. It is then possible to obtain more reliable estimates of aerosol impact on clouds, than when using relationships based only on vertically integrated measurements.
The South-East Atlantic region is particularly well suited to investigate aerosol indirect effects. Large amount of aerosol load, generated by fires in Southern Africa occurring annually (Ichoku et al., 2003; Edwards et al., 2006), are in-jected into the atmosphere and transported by trade winds over the Atlantic ocean (Labonne et Br´eon, 2007), where a semi-permanent low cloud field is present. In the absence of wet scavenging, the aerosol layers can stay suspended in the atmosphere for days and be transported to consider-able distances. South-East Atlantic is one specific area where large aerosol loads are transported above the cloud deck, well separated from it. Aerosol released from savanna and crop-land fires mostly contains Organic Carbon (OC) with various amounts of Black Carbon (BC, emitted primarily in efficient flaming fires), depending on the particular fuel, oxygen avail-ability and combustion phase (Andreae and Merlet, 2001). It has been shown that a more efficient combustion regime re-sults in higher abundance of oxygen at the surface of soot particles. Even if the mass fraction of oxygen within the par-ticle remains rather low, an increase in soot surface oxidation increases aerosol chemical reactivity in the atmosphere and water uptake (Chughtai et al., 2002; Andreae and Gelencs´er, 2006). The inorganic component of biomass burning aerosol is made of some insoluble dust, insoluble ash material and
L. Costantino and F.-M. Br´eon: Aerosol indirect effect on warm clouds over South-East Atlantic 71
soluble salts, while half of the organic matter (the major com-ponent) is considered to be water soluble (Reid et al., 2005; Hoffer et al., 2005; Decesari et al., 2006). In conclusion, be-cause of the large fraction of organic and inorganic soluble material, smoke particles can be already activated as CCN immediately over the fire (Andreae and Rosenfeld, 2008).
The effect of physical interaction of biomass burning aerosols with water droplets can be statistically quantified by long-term satellite observations. In addition, as a conse-quence of its strong sunlight absorbing properties, the aerosol layer may warm the atmosphere above the cloud field, lead-ing to a large change in the atmosphere stability. Finally, if the absorbing aerosol layer tops a cloud or a bright surface, its presence leads to a net positive forcing at the Top Of the Atmosphere (TOA).
In this context, our objective is to attempt a quantification of the various aerosol-cloud interaction processes over the South-East Atlantic, where very specific conditions prevail.
1.2 Theoretical background 1.2.1 Cloud optical properties
The first aerosol indirect effect can be quantitatively illus-trated using the relationship, proposed by Stephens (1978), between two integral variables (cloud optical thickness and liquid water path) and the cloud effective radius, which is the main parameter to describe the microphysical properties of warm clouds
COT = 3 2ρw
LWP
CDR (1)
where ρwis the density of water [1 g cm−3] and CDR is
de-fined as the ratio between the third and second moment of the size distribution, n(r), of radius r. The relation between the mean volume droplet radius and the effective radius is gener-ally estimated empiricgener-ally in the form rv3=k×CDR3, where
kis supposed to vary between 0.8 and 0.9 from clean and pol-luted clouds (Pawlowska and Brenguier, 2000). According to Platnick and Twomey (1994), the cloud liquid water path can be expressed as a function of the cloud volume mean radius and droplet number concentration (Nc), in the form
LWP = LWC × H ≈ 4πρwH NcCDR3 (2)
where LWC [g m−3] is the Liquid Water Content, H is the cloud geometrical thickness and rv has been approximated
by CDR.
Numerous analysis (e.g., Twomey, 1984; Kaufman and Fraser, 1997; Nakajima et al., 2001) have shown the follow-ing relationship between aerosol number concentration (Na)
within polluted clouds and cloud droplet concentration
δlog Nc=gδlog Na (3)
where g is a sensitivity parameter. From aircraft measure-ments over the ocean and land (Kaufman et al., 1991), g
was found to be approximately equal to 0.7. Similarly, based on AVHRR measurements over the oceans, Nakajima et al., (2001) found a value of 0.5. Equations (2) and (3) yield
δlog LWP = gδ log Na+3δ log CDR (4)
The Aerosol Index (AI), defined as the product of the satellite-derived aerosol optical depth and Angstrom expo-nent (ANG), is a good proxy to quantify aerosol number con-centration (Nakajima et al., 2001). It gives more weight to aerosol fine mode (between the most cloud active particles) than AOD alone. If cloud water amount can be assumed con-stant, Eq. (4) gives
δlog CDR = −g
3δlog Na= −0.23δ log AI. (5) This means that a linear relationship is expected between the logarithm of the cloud droplet effective radius and the loga-rithm of the Aerosol Index, with a slope of −0.23, or −0.17 using the parametrisation of Nakajima et al. (2001). In the following analysis, the strength of the different aerosol im-pact on cloud micro and macrophysics will be quantified by the slope value (called “sensitivity”) of the log-log scale re-lationship between a given cloud property and Aerosol In-dex. According to Eq. (1), the strength of aerosol impact on cloud optical thickness is equal in magnitude, but opposite in sign, than that on cloud droplet size, as proposed by Twomey (1974, 1977).
On the other hand, if the assumption of constant liquid wa-ter path does not hold, the response of cloud optical thickness to aerosol increase can be expressed in logarithm form as
δlog COT δlog AI = δlog LWP δlog AI − δlog CDR δlog AI . (6) The strength of aerosol impact on cloud reflectance is then the combination of sensitivity of both the droplet size and cloud water content to the presence of aerosol.
Note that, with the objective of quantifying the aerosol im-pact on the Earth radiation budget, the COT is the proper proxy as it is well related to the cloud albedo for a given sun zenith angle.
1.2.2 Relationship between cloud reflectance and particle size, in precipitating and
non-precipitating clouds
Lohmann et al. (2000) used a general circulation model to explain differences in CDR-COT relationship between optically thin and thick clouds, as observed by Austin et al. (1999) off the coast of California, from AVHRR data. They show that precipitation works in the direction of keep-ing LWP constant with increaskeep-ing cloud optical thickness (as a precipitating cloud grows, more water is removed through rain). According to Eq. (1), cloud droplet radius will show an inverse dependence on cloud optical thickness for a constant
72 L. Costantino and F.-M. Br´eon: Aerosol indirect effect on warm clouds over South-East Atlantic
LWP, of the form
CDR ∝ COT−1 (7)
On the other hand, in case of non-precipitating clouds, no specific assumption is made on LWP. Substituting Eq. (2) into Eq. (1), it follows that
COT ≈ 2π H NcCDR2. (8)
In case of adiabatic clouds, the liquid water content at alti-tude z above cloud base, LWC(z), increases almost linearly with altitude. LWP between cloud base (cb) and cloud top (ct) can be easily calculated as
LWP = Zct Z Zcb LWC(z)dz = Zct Z Zcb cwzdz = 1 2cwH 2 (9)
where cw[g m−4] is the moist adiabatic condensation
coef-ficient. It is almost constant in short stratocumulus clouds with geometrical thickness smaller than 1 km (Brenguier, 1991), depending slightly on the temperature (ranging be-tween 1 and 2.5 × 10⁻⁴g m−4 for temperatures between 0 and 40 °C).
If a stratiform boundary layer cloud is not precipitating and not influenced by entrainment, there is ample observa-tional evidence (Pawlowska and Brenguier, 2000) that cloud LWC vertical profile follows the so-called adiabatic cloud model. Putting together Eqs. (2), (8) and (9), the relationship between CDR and COT results
CDR ∝ COT0.2Nc−0.4. (10) As the adiabatic cloud droplet number concentration Nc is
constant in a non-precipitating cloud, the droplet effective radius is expected to be an exponential function of cloud op-tical thickness, with exponent equal to 0.2. The comparison of Eqs. (7) and (10) leads to the conclusion that the slope of the CDR-COT relationship is positive (resp. negative) for non-precipitating (resp. precipitating) clouds.
2 Dataset
Depending on the specific analysis, we use data acquired over whole South-East Atlantic region, within [4◦N–30◦S; 14◦W–18◦E], or limited to a smaller portion just off the coast of Angola, within [2◦S–15◦S; 14◦W–18◦E]. We used data derived from the MODIS and CALIOP sensors, which are onboard the AQUA and CALIPSO satellites, respectively, both part of the so-called A-Train satellite constellation. They fly in close proximity on the same orbit at 705 km of al-titude, within one to two minutes from each other (Stephens et al., 2002) insuring near-coincident observations.
2.1 MODIS retrievals
MODIS aerosol retrieval algorithm over ocean (Tanr´e et al., 1997; Kaufman et al., 1997; Remer et al., 2009) uses six spectral channels (0.55, 0.66, 0.86, 1.24, 1.64, 2.12 µm). Level 2 (L2) products are organised into 5 min “granules”. Only daytime data are considered for aerosol retrieval and the products are generated at a resolution of 10 × 10 km2. Kaufman et al. (2005a) provide an in-depth analysis of er-ror estimates over ocean and calculated that cloud contam-ination causes a maximum error in MODIS AOD equal to 0.02 ± 0.005. Note that aerosol retrievals are only possible in case of clear or broken clouds condition, when MODIS can see between adjacent clouds.
MODIS retrievals of cloud effective radius and cloud op-tical depth L2 products (with a resolution of 1 × 1 km2), are derived using six spectral channels (King et al., 1998) at vis-ible and near infrared wavelengths (0.66, 0.86, 1.24, 1.64, 2.12, 3.75 µm). In this range of wavelengths, reflectance de-creases when droplet size inde-creases, for a constant cloud op-tical depth. Non-absorbing channel at 0.86 µm (over ocean) is chosen to minimise the surface contribution together with the base radiance at 2.12 µm (and eventually at 1.64 and 3.75 µm). Then, the couple of retrieved radiances are com-pared with a pre-computed Look Up Table (LUT). Br´eon et al. (2005) show that, if the cloud cover is 80% instead of the assumed 100%, an overestimate of the cloud droplet ra-dius up to 2 µm is expected, indicating that MODIS cloud retrieval algorithm is very sensitive to cloud heterogeneity. On the other hand, cloud retrievals based on the 0.86/2.1 µm combination are thought to be little affected by the presence of biomass burning and dust aerosols (Haywood et al., 2004). Cloud top properties, such as Cloud Top Pressure (CTP), are determined using radiances measured in spectral bands located within the broad 15 µm CO2absorption region (with
a resolution of 5 × 5 km2). The comparison against lidar ob-servations indicate that the accuracy of CTP estimates is about 50 hPa for mono-layer clouds (Menzel et al., 2008; Garay et al., 2008; Harshvardan et al., 2009). However, in case of atmospheric profiles with a strong inversion (e.g., ma-rine stratocumulus areas), MODIS retrieval algorithms can place the cloud layer above the inversion, up to 200 hPa off its true position (1000–3000 m). The Level-2 cloud fraction (at 5 km resolution) is derived from the 1 km resolution cloud mask.
All atmospheric products are averaged on a 1 × 1 degree grid box (on daily, weekly and monthly time scale), and are known as Level 3, L3, products. The QA “confidence” flag (whose value ranges from 3 to 0, where 3 means “good” qual-ity and 0 means “bad” qualqual-ity) is used for weighting L2 prod-uct onto a 1◦grid low-resolution product.
In addition to aerosol and clouds, MODIS is able to re-trieve fires and other thermal anomalies. MODIS Level 2 Ac-tive Fire Product (Giglio et al., 2010), MYD14, provides the
L. Costantino and F.-M. Br´eon: Aerosol indirect effect on warm clouds over South-East Atlantic 73
Table 1. Level 2 product used to characterise cloud and aerosol properties from MODISCALIPSO coincident retrievals.
Product Dataset Horizontal Resolution Sensor (Satellite)
Aerosol (05kmALay)
Number Layers Found 5 km
CALIOP (CALIPSO) and cloud (05kmCLay)
Layer Top Altitude 5 km
Layer Base Altitude 5 km
Aerosol (MYD04 L2.C5) Effective Optical Depth Best Ocean (0.55 µm) 10 km
MODIS (Aqua) Angstrom Exponent 1 Ocean (0.55 / 0.86 µm) 10 km
Cloud (MYD06 L2.C5)
Cloud Optical Thickness 1 km
Cloud Water Path 1 km
Cloud Effective Radius 1 km
Cloud Top Pressure 5 km
Cloud Fraction 5 km
position of active fires (latitude and longitude at centre of fire pixel) with a high spatial resolution of 1 km.
2.2 CALIOP retrievals
CALIOP is the first spaceborne lidar optimised for aerosol and cloud measurements. It uses two orthogonally polar-ized channels at 532 nm and one at 1064 to measure the to-tal backscattered signal (Winker et al., 2007). Its footprint is very narrow, with a laser pulse diameter of 70 m on the ground (Khan et al., 2008), with a higher vertical resolu-tion in the lower atmosphere than in and the upper layers, from 30 to 300 m (Winker et al., 2004). CALIPSO Level-1 products provide vertical profiles of Attenuated Backscatter values, while Level-2 products provide, among others, geo-physical products at three different horizontal resolutions for clouds (333 m, 1 km and 5 km) and one for aerosol (5 km).
Despite non-perfect spatial coincidences, Kim et al. (2008) consider both geometrically thin and thick clouds (up to sev-eral km) and find a gensev-eral agreement of CALIPSO estimates of cloud and aerosol top and bottom heights with those de-rived from surface-based lidar observations, within 0.1 km. On the other hand, they show a strong discrepancy in aerosol layer altitudes between ground base and CALIOP lidar, when aerosol is located below thick clouds. In a more recent work, Kim et al. (2011) compared cloud top altitudes retrieved from the Cloud Profiling Radar (CPR, onboard of CloudSat satel-lite) with those observed by CALIOP. For thick tropospheric clouds, while cloud top altitude retrievals from the two in-struments show good agreement with each other, discrepan-cies arise for cloud base estimates, as a consequence of the strong CALIOP signal attenuation.
As a consequence, and as further discussed in the next section, cases of multilayer clouds and aerosol below cloud will not be considered to avoid the strong uncertainties in
CALIPSO retrievals of aerosol and cloud top and bottom layer altitude in presence of thick clouds.
2.3 MODIS-CALIPSO coincidences
Cloud parameters are obtained from MODIS Level 2 cloud product of collection C005 (MYD06 L2.C5) at 1 km resolu-tion for Cloud Optical Thickness, Cloud Water Path, Cloud
Effective Radius and 5 km resolution for Cloud Top Pres-sure and Cloud Fraction. Aerosol Effective Optical Depth Best Ocean (0.55 µm) and Angstrom Exponent 1 Ocean
(0.55/0.86 µm), from MODIS Level 2 aerosol product of col-lection C005 (MYD04 L2.C5) at 10 km resolution, are used to estimate Aerosol Index.
Cloud and aerosol layer altitudes are taken from CALIPSO Level 2 products. We make use of Number Layers Found,
Layer Top Altitude and Layer Base Altitude, at 5 km
reso-lution for both aerosol and clouds. MODIS and CALIPSO datasets are summarised in Table 1.
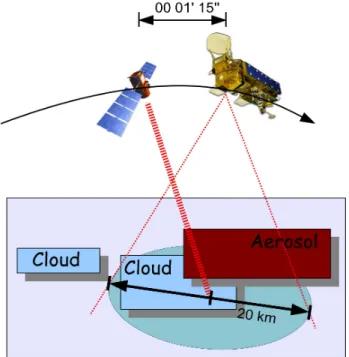
We use data acquired from June 2006 to December 2010. When CALIPSO detects the presence of mono-layer aerosol and cloud fields, we look for MODIS cloud and aerosol re-trievals within a radius of 20 km from the CALIPSO target. Cases of clear-sky are not considered. Time-coincidence of retrievals is assured by the A-train coordinated orbits of Aqua and CALIPSO. This method is described schematically in Fig. 1.
Aerosol and cloud layers are assumed to be physically in-teracting when the vertical distance of aerosol bottom alti-tude from cloud top altialti-tude is smaller than 100 m. Inversely, they are considered “well separated” if this distance is larger than 750 m. Aerosol and cloud layers with distance between 100 and 750 m are uncertain and excluded from our analysis, as are cases with the aerosol layer underneath the cloud layer. In order to deal with shallow clouds only, cloud top pres-sure retrievals smaller than 600 hPa are excluded. In addition,
74 L. Costantino and F.-M. Br´eon: Aerosol indirect effect on warm clouds over South-East Atlantic
radius of 20 km from the CALIPSO target. Cases of clear-sky are not considered.
Time-coincidence of retrievals is assured by the A-train coordinated orbits of Aqua and CALIPSO. This
method is described schematically in Fig. 1.
Aerosol and cloud layers are assumed to be physically interacting when the vertical distance of
aerosol bottom altitude from cloud top altitude is smaller than 100 m. Inversely, they are
considered “well separated” if this distance is larger than 750 m. Aerosol and cloud layers with
distance between 100 and 750 m are uncertain and excluded from our analysis, as are cases
with the aerosol layer underneath the cloud layer.
In order to deal with shallow clouds only, cloud top pressure retrievals smaller than 600 hPa are
excluded. In addition, COT smaller than 5 are also excluded because neither a clear distinction
between aerosol and clouds, nor an accurate retrieval of cloud properties is reliably possible for
optically thin clouds (Nakajima et al., 2001). Finally, cases of multilayer aerosol and clouds
(retrievals can be ambiguous in such cases) and aerosol with top layer altitude larger than 10
km, are also excluded. All MODIS retrievals within a 20km radius from the CALIPSO target are
averaged together, to provide single estimates of cloud and aerosol parameters for each
CALIPSO shot. Cases with average COT larger than 35 and LWP larger than 300 g m
-2are
excluded to avoid deep convective clouds.
Fig. 1. Scheme of CALIPSO-MODIS coincidence methodology. When CALIPSO detects the presence of
single-layer aerosol and cloud fields, we look for MODIS retrievals within a radius of 20 km from CALIPSO target. The
temporal coincidence is insured by the coordinated satellite orbits.
11
280
285
290
295
Fig. 1. Scheme of CALIPSO-MODIS coincidence methodology. When CALIPSO detects the presence of single-layer aerosol and cloud fields, we look for MODIS retrievals within a radius of 20 km from CALIPSO target. The temporal coincidence is insured by the coordinated satellite orbits.
COT smaller than 5 are also excluded because neither a clear distinction between aerosol and clouds, nor an accurate re-trieval of cloud properties is reliably possible for optically thin clouds (Nakajima et al., 2001). Finally, cases of multi-layer aerosol or clouds (retrievals can be ambiguous in such cases) and aerosol with top layer altitude larger than 10 km are also excluded. All MODIS retrievals within a 20 km ra-dius from the CALIPSO target are averaged together, to pro-vide single estimates of cloud and aerosol parameters for each CALIPSO shot. Cases with average COT larger than 35 and LWP larger than 300 g m−2 are excluded to avoid deep convective clouds.
3 Results
3.1 Aerosol production and transport over S-E Atlantic
We consider four time periods that differ from classical sea-sons and go from January to March, from April to June, from July to September and from October to December. This par-ticular seasonal choice allows to properly centre the peak of the African Southern Hemisphere dry season biomass burning activity, that mostly occurs from July to September (Ichoku et al., 2000; Myhre et al., 2003; Swap et al., 2003; Eck et al., 2003).
MODIS Level 2 Active Fire Product for 2005 shows that fires over the African continent mainly occur in the
respec-tive winter season of each hemisphere (Fig. 2). From Novem-ber to March, fires are concentrated in the Sahel region, south of the Sahara Desert and north of the Equator, extending ap-proximately from the West coast of Mauritania to Ethiopia (i.e., extending East-West over almost the entire continent). From May to September, fires are mainly located in Southern Africa, covering almost the entire subcontinent, between 0◦S and 20◦S. In April and October, fires are observed in both regions, north and south of the Equator, but in much smaller numbers. Figure 2 shows seasonal maps of wind speed and direction at 950 and 750 hPa (corresponding approximately at 0.6 and 2.5 km of altitude) for 2005, obtained from the monthly averaged data provided by the European Center for Medium-Range Weather Forecasts (ECMWF). Each arrow indicates the direction and intensity of the mean wind at that point. Wind speed is expressed in degrees per day so that arrow’s length represents the distance travelled by the air in 24 h. Low level winds at 950 hPa (green arrows), over South-East Atlantic between 0◦S and 60◦S, show a N-NW circulation. During April–June and July–September, oceanic air masses from the south penetrate into the inner continent (over the Sahel region), while the wind field is particularly weak in Southern Africa. On the other hand, during January– March and October–December, the Gulf of Guinea becomes a convergence zone between the northward wind flow from South-East Atlantic and the southward flow from Sahel. At pressure levels of 850 (not shown in the figure) and 750 hPa (red arrows), winds of the Northern Hemisphere (between 20◦N and 0◦N) turn W-SW, while those of the Southern Hemisphere (between 0◦S and 20◦S) turn W-NW. During April–June and July–September, the wind speed over South-ern Africa increases consistently. Coincidently with the peak of fire occurrence (the so called biomass burning season), a strong easterly air transport from the inner continent over ocean is established. In the Northern Hemisphere, air masses from the Sahel are advected westward and southward over the Central Atlantic ocean and the Gulf of Guinea.
From this analysis, one may conclude that, during the win-ter fire season, the transport of biomass burning aerosol to the Gulf of Guinea is limited and mostly westward, only if the aerosol reaches a sufficient altitude. During the sum-mer season, biomass burning aerosols from Southern Africa are transported efficiently towards the West, but not in the low atmospheric layers. Nevertheless, this analysis is based on seasonal averages and does not exclude different trans-ports, when the wind field does not follow the mean cir-culation. Another smoke transport mechanism has been ob-served by Haywood et al. (2008), analysing data from the DABEX (Dust And Biomass-burning Experiment) field cam-paign. Over West Africa, mineral dust is transported south-ward from the Sahara Desert (where a strong static stability prevent dust from mixing vertically and trap aerosol in a layer between 900 and 850 hPa), while biomass burning particles from savanna burning are subjected to a northward advection. When the two flows come into contact (over the convergence
L. Costantino and F.-M. Br´eon: Aerosol indirect effect on warm clouds over South-East Atlantic 75
transport from the inner continent over ocean is established. In the Northern Hemisphere, air masses from the Sahel are advected westward and southward over the Central Atlantic ocean and the Gulf of Guinea.
From this analysis, one may conclude that, during the winter fire season, the transport of biomass burning aerosol to the Gulf of Guinea is limited and mostly westward, only if the aerosol reaches a sufficient altitude. During the summer season, biomass burning aerosols from Southern Africa are transported efficiently towards the West, but not in the low atmospheric layers. Nevertheless, this analysis is based on seasonal mean circulation, and does not exclude other transports when the wind field does not follow the mean circulation. Another smoke transport mechanism has been observed by Haywood et al. (2008), analyzing data from the DABEX (Dust And Biomass-burning Experiment) field campaign. Over West Africa, mineral dust is transported southward from the Sahara desert (where a strong static stability prevent dust from mixing vertically and trap aerosol in a layer between 900 and 850 hPa), while biomass burning particles from savanna burning are subjected to a northward advection. When the two flows come in contact (over the convergence zone of low level winds, slightly north of 10 N), the hotter air mass from biomass burning overrides the cooler dust and is lifted to higher altitudes. With decreasing pressure level, local wind turns southward and westward, allowing for smoke transport over the Gulf of Guinea.
Fig. 2. Maps of fire occurrence for 2005, according to MODIS Active Fire Product. Color-scale represents the number of active fires detected during each time period, at a nominal resolution (at nadir) of 1 km, within a 1×1 gird box. Wind fields at 950 (green) and 750 (red) hPa (corresponding approximately to 600m and 2.5km of altitude) for 2005 are over-plotted on the figure. Seasonal wind maps are obtained from monthly averaged data provided by the European Center for Medium-Range Weather Forecasts (ECMWF). Arrows indicate the direction
13
330
335
340
345
350
Fig. 2. Maps of fire occurrence for 2005, according to MODIS Active Fire Product. Colour-scale represents the number of active fires detected during each time period, at a nominal resolution (at nadir) of 1 km, within a 1◦×1◦grid box. Wind fields at 950 (green) and 750 (red) hPa (corresponding approximately to 600 m and 2.5 km of altitude) for 2005 are over-plotted on the figure. Seasonal wind maps are obtained from monthly averaged data provided by the European Center for Medium-Range Weather Forecasts (ECMWF). Arrows indicate the direction and intensity of the mean wind at that point. Wind speed is expressed in degrees per day so that arrow’s length shows the distance travelled by the air in 24 h.
annual cycle of aerosol production and transport (with modest inter-annual variability compared to seasonal variations), dominated by two different regimes. The first one, from October to March, is characterized by optically thin aerosol layers (with AI generally below 0.2) and Angstrom exponents usually smaller than one, indicating the dominance of coarse-mode aerosols. The second one, marked by the presence of larger concentrations of smaller particles, begins on April and culminates during the biomass burning season, when AI and ANG get both larger than one.
Fig. 3. Maps of seasonally averaged measurements of Aerosol Index (AI), for 2005. AI seasonal variability is
high but somewhat different from that of AOD, because aerosol composition and hence Angstrom exponent vary during the year.
Fig. 4. Maps of seasonally averaged measurements of Angstrom exponent (ANG), for 2005.
3.3 Aerosol impact on cloud droplet radius
In Fig. 5 coincident MODIS-CALIPSO estimates of cloud effective radius are averaged over constant bin of AI, from 0.02 to 0.5 (by step of 0.2), and reported in log-log scale.
15 385
390
395
400
Fig. 3. Maps of seasonally averaged measurements of Aerosol Index (AI), for 2005. AI seasonal variability is high, but somewhat different from that of AOD, because aerosol composition and, hence, Angstrom exponent vary during the year.
zone of low level winds, slightly north of 10 N), the hotter air mass from biomass burning overrides the cooler dust and is lifted to higher altitudes. With decreasing pressure level, lo-cal wind turns southward and westward, allowing for smoke transport over the Gulf of Guinea.
3.2 Aerosol distribution
We make use of MODIS Level 3 aerosol daily product over ocean (1◦ resolution) to analyse six years (2005–2010) of “seasonally” averaged maps of vertically integrated aerosol and cloud properties.
Figures 3 and 4 respectively show Aerosol Index (AI) and Angstrom exponent (ANG) maps for 2005. While Aerosol Index is somewhat proportional to aerosol number concen-tration, ANG (computed from measurements at 550 and 865 nm) expresses the spectral dependence of aerosol op-tical depth and provides additional information on aerosol size (the larger the coefficient, the smaller the particle). An Angstrom exponent larger than 1 indicates a dominance of fine-mode particles (Smirnov, 2002; Queface et al., 2003; Thieuleux, 2005). During January–March, AI reaches its
maximum value over a small area in the northern part of the region, where it is smaller than AOD, because the Angstrom exponent is generally lower than one. Over the Gulf of Guinea, Aerosol Index ranges between 0.2 and 0.35, AOD between 0.5 and 0.8 and Angstrom exponent is around 0.5 or lower. Dust transported from the Sahara at relatively high al-titude dominates the aerosol load. From April to June, when fires begin to occur in Southern Africa, aerosol load sensi-bly increases over coastal areas between the Gulf of Guinea and Angola. Aerosol index increases up to 0.5 and Angstrom exponent varies between 0.8 and 1.1, suggesting an east-erly transport of smoke particles from Southern Africa over ocean, by trade winds.
The heaviest aerosol concentration is observed during the biomass burning season (July–September), with AI values particularly elevated over a wide area off the coasts of An-gola, between 0.5 and 1.5 (saturated in the figure that uses a colour scale maximum of 0.7).
Angstrom exponent over the whole region is generally larger than 0.7, exceeding unity (yellow and red points) near and off the coast of Angola. This, most likely, results from the abundant presence of biomass burning particles
76 L. Costantino and F.-M. Br´eon: Aerosol indirect effect on warm clouds over South-East Atlantic
annual cycle of aerosol production and transport (with modest inter-annual variability compared to seasonal variations), dominated by two different regimes. The first one, from October to March, is characterized by optically thin aerosol layers (with AI generally below 0.2) and Angstrom exponents usually smaller than one, indicating the dominance of coarse-mode aerosols. The second one, marked by the presence of larger concentrations of smaller particles, begins on April and culminates during the biomass burning season, when AI and ANG get both larger than one.
Fig. 3. Maps of seasonally averaged measurements of Aerosol Index (AI), for 2005. AI seasonal variability is
high but somewhat different from that of AOD, because aerosol composition and hence Angstrom exponent vary during the year.
Fig. 4. Maps of seasonally averaged measurements of Angstrom exponent (ANG), for 2005.
3.3 Aerosol impact on cloud droplet radius
In Fig. 5 coincident MODIS-CALIPSO estimates of cloud effective radius are averaged over constant bin of AI, from 0.02 to 0.5 (by step of 0.2), and reported in log-log scale.
15 385
390
395
400
Fig. 4. Maps of seasonally averaged measurements of Angstrom exponent (ANG), for 2005.
in the atmosphere. From October, fire occurrence in South-ern Africa decreases significantly. Average values of AI and ANG during October–December are much lower than during July–August.
Satellite data for 2006–2010 show a similar annual cy-cle of aerosol production and transport (with modest inter-annual variability compared to seasonal variations), domi-nated by two different regimes. The first one, from Octo-ber to March, is characterised by optically thin aerosol layers (with AI generally below 0.2) and Angstrom exponents usu-ally smaller than one, indicating the dominance of coarse-mode aerosols. The second one, marked by the presence of larger concentrations of smaller particles, begins in April and culminates during the biomass burning season, when AI and ANG get both larger than one.
3.3 Aerosol impact on cloud droplet radius
In Fig. 5 coincident MODIS-CALIPSO estimates of cloud effective radius are averaged over constant bin of AI, from 0.02 to 0.5 (by step of 0.2), and reported in log-log scale.
Cases of mixed or nearby aerosol and cloud layers are in-dicated in red, while case with aerosol above the cloud top are shown in blue. For a total of more than 15 000 valid re-trievals, 56% are identified as cases with well-separated lay-ers, while 44% show close or mixed aerosol and cloud layers. The study area is reduced to the smaller region off the coast of Angola, within [2◦S–15◦S; 14◦W–18◦E], where a previ-ous analysis indicated that MODIS-CALIPSO coincidences are more homogeneously distributed than over the whole SE Atlantic and statistics are less affected by local variation of meteorological parameters.
Mixed and unmixed case statistics converge to very
simi-lar CDR values when aerosol particle concentration is close to zero. With increasing AI, unmixed statistics do not show any significant correlation between changes in Aerosol Index and cloud droplet radius variations. CDR of clouds below the aerosol layer remains almost constant, close to 14–15 µm for all aerosol regimes. On the other hand, for mixed cases, CDR decreases by about 30 %, from 15–16 µm down to 11 µm, as AI varies from 0.02 to 0.5.
Cases of mixed or nearby aerosol and cloud layers are indicated in red, while case with aerosol above the cloud top are shown in blue. For a total of more than 15000 valid retrievals, 56% are identified as cases with well-separated layers, while 44% show close or mixed aerosol and cloud layers. The study area is reduced to the smaller region off the coast of Angola, within [2S-15S; 14W-18E], where a previous analysis indicated that MODIS-CALIPSO coincidences are more homogeneously distributed than over the whole SE Atlantic and mixed-unmixed statistics are less affected by local variation of meteorological parameters.
Mixed and unmixed case statistics converge to very similar CDR values when aerosol particle
concentration is close to zero. With increasing AI, unmixed statistics does not show any significant correlation between changes in aerosol index and cloud droplet radius variations. CDR of clouds below the aerosol layer remains almost constant, close to 14–15 μ for all aerosol regime. On the other hand, for mixed cases, CDR decreases by about 30 %, down to 11 m, asμ AI varies from 0.02 to 0.5.
The strength of aerosol impact on CDR can be quantified by the linear regression slope of CDR-AI relationship in log-log scale. In good agreement with Twomey’s hypothesis, Fig. 5 shows that the logarithmic relationship between CDR and AI in case of mixed and interacting layers is close to linear, with a correlation coefficient equal to −0.76. The strong CDR sensitivity to aerosol increase is expressed by the best-fit slope of −0.15, five times smaller than in case of unmixed layers (−0.03), and in good agreement with the expected value (between −0.23 and −0.17).
Fig. 5. Cloud Droplet Radius (CDR) retrievals averaged over constant bin of Aerosol Index (AI), in log-log scale,
16
405
410
415
420
Fig. 5. Cloud Droplet Radius (CDR) retrievals averaged over con-stant bin of Aerosol Index (AI), in log-log scale, for cases of well-separated cloud and aerosol layers (blue) and mixed and interacting layers (red), in the region within [2◦S–15◦S; 14◦W–18◦E]. Error bars represent the confidence level of the mean values if one as-sumes independent data. They are calculated as σ σ (n−2)½, where nis the number of CDR measurements within the bin and σ σ is their standard deviation.
The strength of aerosol impact on CDR can be quanti-fied by the linear regression slope of CDR-AI relationship in log-log scale. In good agreement with Twomey’s hypoth-esis, Fig. 5 shows that the logarithmic relationship between CDR and AI in case of mixed and interacting layers is close to linear, with a correlation coefficient equal to −0.76. The strong CDR sensitivity to aerosol increase is expressed by the best-fit slope of −0.15, five times smaller than in case of unmixed layers (−0.03), and in good agreement with the expected value (between −0.23 and −0.17).
3.4 Aerosol impact on cloud liquid water path
Averaging coincident MODIS-CALIPSO retrievals of liquid water path, within [2◦S–15◦S; 14◦W–18◦E], over constant bin of Aerosol Index, LWP-AI relationship (Fig. 6) is some-what similar to CDR-AI. In case of mixed layers, LWP is decreased by 37 % (from 95 to 60 g m−2)as AI increases from 0.03 to 0.5. The resulting linear slope in log-log scale is
L. Costantino and F.-M. Br´eon: Aerosol indirect effect on warm clouds over South-East Atlantic 77
for cases of well separated cloud and aerosol layers (blue) and mixed and interacting layers (red), in the region within [2S-15S; 14W-18E]. Error bars represent the confidence level of the mean values if one assumes independent data. They are calculated as σ/(n−2)½, where n is the number of CDR measurements within the bin and σ is their standard deviation.
3.4 Aerosol impact on cloud liquid water path
Averaging coincident MODIS-CALIPSO retrievals of liquid water path, within [2S-15S; 14W-18E], over constant bin of aerosol index, LWP-AI relationship (Fig. 6) is somewhat similar to CDR-AI. In case of mixed layers, LWP is decreased by 37% (from 95 to 60 g m-2) as AI increases from
0.03 to 0.5. The resulting linear slope in log-log scale is equal to −0.16. Otherwise, when the aerosol is located above cloud deck, LWP does not show any sensible dependence on aerosol concentration. Cloud water amount remains almost constant at approximately 80–90 g m-2 for
all aerosol regimes and the resulting best linear fit slope is equal to −0.04.
In good agreement with expectation, mixed and unmixed layer relationships converge to a same LWP value (within statistical uncertainties), when AI decreases to very small values. We do not get the same result for the whole South-East Atlantic region, within [4N-30S; 14W-18 E]. In the latter case, mixed statistics show that LWP would increase up to 110 g m-2, for AI
approaching to zero (while unmixed LWP would remains almost unchanged).
Fig. 6. Liquid Water Path (LWP) retrievals averaged over constant bin of Aerosol Index (AI), in log-log scale, for cases of well separated (blue) and interacting (red) cloud-aerosol layers, in the region within [2S-15S; 14W-18E]. The error bars indicate the statistical uncertainties as in Fig. 5.
17
425
430
435
440
445 Fig. 6. Liquid Water Path (LWP) retrievals averaged over constant bin of Aerosol Index (AI), in log-log scale, for cases of well sepa-rated (blue) and interacting (red) cloud-aerosol layers, in the region within [2◦S–15◦S; 14◦W–18◦E]. The error bars indicate the sta-tistical uncertainties as in Fig. 5.
equal to −0.16. Otherwise, when the aerosol is located above cloud deck, LWP does not show any sensible dependence on aerosol concentration. Cloud water amount remains al-most constant at approximately 80–90 g m−2for all aerosol regimes and the resulting best linear fit slope is equal to
−0.04.
In good agreement with expectation, mixed and unmixed layer relationships converge to a same LWP value (within statistical uncertainties), when AI decreases to very small values. We do not get the same result for the whole South-East Atlantic region, within [4◦N–30◦S; 14◦W–18◦E]. In the latter case, mixed statistics show that LWP would in-crease up to 110 g m−2 for AI approaching to zero (while unmixed LWP would remain almost unchanged).
3.5 Aerosol impact on cloud optical thickness
In Fig. 7, coincident MODIS-CALIPSO estimates of cloud effective radius are averaged over constant bin of AI, from 0.02 to 0.5 (by step of 0.2), and reported in log-log scale.
Both for mixed and unmixed cases, COT is little dependent on the Aerosol Index and shows variations that are not a clear function of the AI. A best fit among the rather scattered dat-apoints indicates that COT varies in average between 8.5 and 9.0. For AI values higher than 0.2, larger error bars indicate stronger statistical uncertainties than in case of lower aerosol loads, due to fewer measurements in the corresponding bin.
The low COT sensitivity to aerosol increase is significantly quantified by the log-log scale linear regression slope. When cloud and aerosol are mixed and interacting, the slope is particularly small, even slightly negative, equal to −0.02. The large statistical uncertainty in the slope value, equal to ± 0.06, and the modest linear correlation coefficient r =
−0.47 stress the large variability of COT and its little linear dependence on AI.
3.5 Aerosol impact on cloud optical thickness
In Fig. 7, coincident MODIS-CALIPSO estimates of cloud effective radius are averaged over constant bin of AI, from 0.02 to 0.5 (by step of 0.2), and reported in log-log scale.
Both for mixed and unmixed layer cases, COT is little dependent on the aerosol index and shows variations that are not a clear function of the AI. A best fit among the rather scattered datapoints indicates that COT varies between 8.5 and 9.0. For AI values higher than 0.2, larger error bars indicate stronger statistical uncertainties than in case of lower aerosol loads, due to fewer measurements in the corresponding bin.
The low COT sensitivity to aerosol increase is significantly quantified by the log-log scale linear regression slope. When cloud and aerosol are mixed and interacting, the slope is particularly small, even slightly negative, equal to −0.02. Statistical uncertainties in the slope value equal to ±0.06, together with a linear correlation coefficient of r = −0.47, stress the large variability of COT and its little dependence on AI.
When aerosol and cloud layers are well separated, linear slope is very small and equal to 0.01 (with statistical error of ±0.04 and linear regression coefficient r = 0.1).
These results indicate that the impact of aerosol on the cloud optical thickness is hardly distinguishable from the noise.
Fig. 7. Cloud Optical Thickness (COT) retrievals averaged over constant bin of Aerosol Index (AI), in log-log scale, for cases of well separated (blue) and mixed (red) cloud-aerosol layers, in the region within [2S-15 S; 14
18
450455
460
465
Fig. 7. Cloud Optical Thickness (COT) retrievals averaged over constant bin of Aerosol Index (AI), in log-log scale, for cases of well separated (blue) and mixed (red) cloud-aerosol layers, in the region within [2◦S–15◦S; 14◦W–18◦E]. The error bars indicate the statistical uncertainties as in Fig. 5.
When aerosol and cloud layers are well separated, linear slope is very small and equal to 0.01 (with statistical error of
±0.04 and linear regression coefficient r = 0.1).
These results indicate that the impact of aerosol on the cloud optical thickness is hardly distinguishable from the noise.
3.6 Aerosol impact on cloud fraction
The cloud lifetime question is complex, and none of the hy-pothesis discussed in recent literature can uniquely explain the strong positive CLF-AI relationship, generally observed in satellite-derived relationships. As discussed above, the present analysis focuses on a specific area, that is unique by the presence of a layer of low clouds, often topped by large loads of biomass burning aerosols. We use MODIS Level 3 daily product (1 degree resolution) to compute linear regres-sion of log-log scale CLF-AI relationship from 2005 to 2010. Resulting slopes are equal to 0.30–0.32, in good agreement with the satellite based results of Menon et al. (2008) and Quaas et al. (2009), but overestimating the values obtained from model simulation. For this mono-satellite analysis of cloud-aerosol relationship, where no distinction is made be-tween mixed and unmixed statistics, we make use of MODIS retrievals acquired over the whole South-East Atlantic re-gion, [4◦N–30◦S; 14◦W–18◦E].
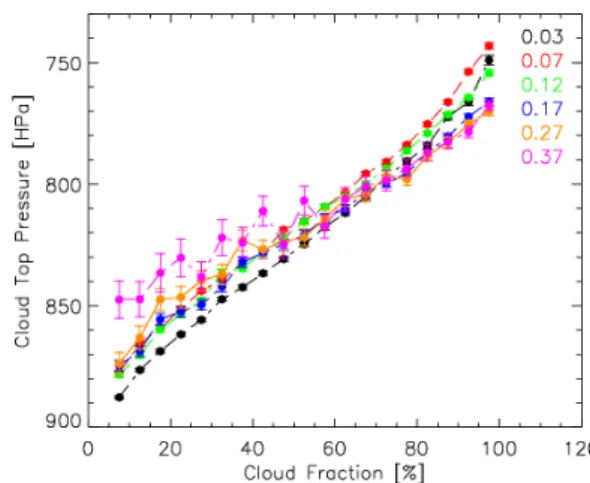
Figure 8 shows cloud fraction estimates averaged over constant bin of cloud top pressure, from MODIS L3 daily product. The data are sorted from clean to polluted into six samples based on the AI by step of 0.05. The mean AI value of each subset is reported in the figure, indicated with the same colour of the respective symbols. CLF correlates well with cloud top pressure, which is a proxy to roughly estimate cloud vertical development. Lower top pressure indicates
78 L. Costantino and F.-M. Br´eon: Aerosol indirect effect on warm clouds over South-East Atlantic
constant. Figure 9 shows that CTP variations, averaged over constant bin of CLF, are very limited as AI varies between 0.03 and 0.37. For CLF larger than 60 %, they fall within the 2005– 2010 annual variability. Slightly larger CTP variations, with increasing AI, are observed for CLF
<60 %. In that case, larger error bars indicate fewer retrievals and averages with smaller
representativity. For constant values of CLF, higher aerosol concentrations are not always associated to smaller top pressure, suggesting that CTP variations are not induced by aerosol-cloud interaction. In the hypothesis that aerosol does affect aerosol-cloud structure, the results indicate that its primary effect is to increase the horizontal extension rather than produce taller and more convective clouds.
Fig. 8. CLF-CTP relationships from MODIS daily products, at 1 degree resolution, in the region within [4N-30S; 14W-18E]. The whole 2005-2010 dataset is sorted by AI, from little to high polluted atmosphere, by step of 0.1. Colors represent different aerosol index intervals (mean AI values are reported in figure). The error bars indicate the statistical uncertainties as in Fig. 5.
20 500
505
510 Fig. 8. CLF-CTP relationships from MODIS daily products, at 1 degree resolution, in the region within [4◦N–30◦S; 14◦W–18◦E]. The whole 2005–2010 dataset is sorted by AI, from little to high polluted atmosphere, by step of 0.1. Colours represent different Aerosol Index intervals (mean AI values are reported in figure). The error bars indicate the statistical uncertainties as in Fig. 5.
taller clouds that reach higher level of the atmosphere. Up to 700 hPa, the tallest clouds are characterised by the largest horizontal extension for all aerosol regimes. The results show a boomerang shape of CLF-CTP relationship, with a max-imum at approximately 700 hPa. The diminution of cloud coverage for CTP larger than 700 hPa may indicate the oc-currence of “high” clouds with larger cloud base altitude (in that case CTP is no more representative of cloud vertical ex-tension) or multilayer cloud conditions (in that case the CTP-CLF relationship has to be considered meaningless).
Note, however, that higher aerosol concentrations are char-acterised by larger cloud coverages at every pressure level.
On the other hand, CTP does not show any significant de-pendence on AI, if CLF is held constant. Figure 9 shows that CTP variations, averaged over constant bin of CLF, are very limited as AI varies between 0.03 and 0.37. For CLF larger than 60 %, they fall within the 2005–2010 annual variabil-ity. Slightly larger CTP variations, with increasing AI, are observed for CLF < 60 %. In that case, larger error bars indi-cate fewer retrievals and averages with smaller representivity. For constant values of CLF, higher aerosol concentrations are not always associated with smaller top pressure, suggesting that CTP variations are not induced by aerosol-cloud inter-action. In the hypothesis that aerosol does affect cloud struc-ture, the results indicate that its primary effect is to increase the horizontal extension rather than produce taller and more convective clouds.
In an attempt to isolate aerosol-induced from meteorologi-cal effects, we now analyse CLF-AI statistics from mixed (in-teracting) and well-separated (not in(in-teracting) cloud-aerosol layers.
As shown from MODIS observations, larger CTP implies in average larger CLF, as well as larger CLF implies larger
Fig.9. CTP-CLF relationships from MODIS daily products, at 1 degree resolution, in the region within [4N-30S; 14W-18E]. The whole 2005-2010 dataset is sorted by AI, from little to highly polluted atmosphere, by step of 0.1. Colors represent different aerosol index intervals (mean AI values are reported in figure). The error bars indicate the statistical uncertainties as in Fig. 5.
In an attempt to isolate aerosol-induced from meteorological effects, we now analyze CLF-AI statistics from mixed (interacting) and well separated (not interacting) cloud-aerosol layers. As shown from MODIS observations, larger CTP implies in average larger CLF, as well as larger CLF implies larger CTP, at least up to 700 hPa. We then argue it is better to compare CLF responses of clouds with similar vertical development. Cloud top pressure was found to be rather independent from aerosol interaction with cloud (Fig. 9). Keeping it constant, we minimize CLF variations caused by considering clouds with largely different CTP (due to different local meteorological conditions), without loosing any significant information on the strength of aerosol effect.
According to these considerations, mixed and unmixed MODIS-CALIPSO coincidences are sorted by CTP from low to high clouds, by step of 10 hPa, to provide a more accurate description of mixed and unmixed CLF sensitivity variation with cloud top pressure. CLF retrievals of each subset are averaged over constant bin of AI (from 0 to 0.7) by step of 0.2. The linear regression slope of each CLF-AI relationship in log-log scale is calculated and plotted as function of the correspondent CTP interval. This process is performed twice, once for the mixed (red) and once the unmixed case (blue), as shown in Fig. 10.
We make use of data from the whole South-East Atlantic [4N-30S; 14W-18E], including those
21 515 520 525 530 535
Fig. 9. CTP-CLF relationships from MODIS daily products, at 1 degree resolution, in the region within [4◦N–30◦S; 14◦W–18◦E]. The whole 2005–2010 dataset is sorted by AI, from little to highly polluted atmosphere, by step of 0.1. Colours represent different Aerosol Index intervals (mean AI values are reported in figure). The error bars indicate the statistical uncertainties as in Fig. 5.
CTP, at least up to 700 hPa. We then argue it is better to com-pare CLF responses of clouds with similar vertical develop-ment. Cloud top pressure was found to be rather indepen-dent from aerosol interaction with cloud (Fig. 9). Keeping it constant, we minimise CLF variations caused by consider-ing clouds with largely different CTP (due to different local meteorological conditions), without losing any significant in-formation on the strength of aerosol effect.
According to these considerations, mixed and unmixed MODIS-CALIPSO coincidences are sorted by CTP from low to high clouds, by step of 10 hPa, to provide a more accurate description of mixed and unmixed CLF sensitivity variation with cloud top pressure. CLF retrievals of each subset are averaged over constant bin of AI (from 0 to 0.7) by step of 0.2. The linear regression slope of each CLF-AI relationship in log-log scale is calculated and plotted as a function of the correspondent CTP interval. This process is performed twice, once for the mixed (red) and once the unmixed case (blue), as shown in Fig. 10.
We make use of data from the whole South-East At-lantic [4◦N–30◦S; 14◦W–18◦E], including those regions excluded in previous analysis. That is because the CTP sort-ing allows minimissort-ing the effect of spatial heterogeneity of local meteorology on CLF-AI co-variation. Note that high clouds generally show a large cover fraction (almost equal to 100% even at very low AI) that would obviously results in CLF-AI slopes equal to zero. Only cases with CLF lower than 97% for AI = 0.01 are then considered.
We define the sensitivity (S) to aerosol increase, of the cloud parameter k, as
S(k) = δlog k
L. Costantino and F.-M. Br´eon: Aerosol indirect effect on warm clouds over South-East Atlantic 79
regions excluded in previous mixed/not-mixed analysis. That is because the CTP sorting allows minimizing the effect of spatial heterogeneity of local meteorology on CLF-AI co-variation. Note that high clouds generally show a large cover fraction (almost equal to 100% even at very low AI) that would obviously results in CLF-AI slopes equal to zero. Only cases with CLF lower than 97% for AI = 0.01 are then considered.
We define the sensitivity (S) to aerosol increase, of the cloud parameter k, as
S k = log k
log AI (11)
In case of mixed and interacting layers, cloud fraction sensitivity is small but positive, with no specific dependence on CTP. The error bars indicate the statistical uncertainties, as in Fig. 5. Apart from a few points for CTP between 950 and 900 hPa, S(CLF) varies between 0.025 and 0.015 with an average value of 0.020.
In case of unmixed layers, CLF sensitivity variations with CTP are compelling. S(CLF) is almost zero when top layer altitude is larger than 2 km (CTP <800 hPa). As cloud top pressure exceeds 800 hPa, however, CLF dependence on AI becomes positive. S(CLF) undergoes a dramatic increase positively related to cloud top altitude diminution. In case of very low clouds (CTP=970 Pa), CLF sensitivity reaches a maximum value of 0.10, five times larger than that observed in mixed statistics for similar top pressure levels.
Fig. 10. Cloud fraction sensitivity (i.e. the computed linear regression slope of CLF-AI relationship in log-log
22 540
545
550
555
Fig. 10. Cloud fraction sensitivity (i.e., the computed linear regres-sion slope of CLF-AI relationship in log-log scale) as a function of Cloud Top Pressure (CTP), for cases of mixed (red) and well sepa-rated (blue) cloud-aerosol layers, in the region within [4◦N–30◦S; 14◦W–18◦E]. The error bars indicate the statistical uncertainties as in Fig. 5.
In case of mixed and interacting layers, cloud fraction sen-sitivity is small but positive, with no specific dependence on CTP. The error bars indicate the statistical uncertainties, as in Fig. 5. Apart from a few points for CTP between 950 and 900 hPa, S(CLF) varies between 0.025 and 0.015 with an av-erage value of 0.020.
In case of unmixed layers, CLF sensitivity variations with CTP are compelling. S(CLF) is almost zero when top layer altitude is larger than 2 km (CTP < 800 hPa). As cloud top pressure exceeds 800 hPa, however, CLF dependence on AI becomes positive. S(CLF) undergoes a dramatic increase positively related to cloud top altitude diminution. In case of very low clouds (CTP = 970 Pa), CLF sensitivity reaches a maximum value of 0.10, five times larger than that observed in mixed statistics for similar top pressure levels.
3.7 Aerosol impact on precipitation
To observe the effect of aerosol-cloud interaction on precipi-tation, we compare the CDR-COT relationship of mixed and unmixed cloud-aerosol layers. Cases of aerosol above cloud top are considered representative of clean cloud properties. In case of cloud-aerosol interaction, we only select data with AI larger than 0.09 to avoid very low aerosol regimes (when CDR values of interacting layers converge to those of un-mixed ones) and consider un-mixed statistics as representative of polluted cloud properties.
In addition, for AI > 0.09, mixed and unmixed retrieval number concentrations are very similar over S-E Atlantic. This spatial homogeneity allows to consider all MODIS and CALIPSO coincidences retrieved over the whole re-gion, within [4◦N–30◦S; 14◦W–18◦E]. Figure 11 shows cloud droplet effective radius estimates averaged over con-stant bin of cloud optical thickness, for clean (blue) and pol-luted clouds (red). In case of thin clouds (COT < 10), the
ex-case of constant LWP (−1). In ex-case of polluted clouds, the calculated exponent is four times larger than for clean clouds and equal to −0.11. This means that LWP enhancement with increasing COT is stronger in mixed than in unmixed cases. In the hypothesis that precipitation occurrence reduces the range of variation of liquid water path as cloud optical thickness increases, results indicate an inhibition of precipitation production as a consequence of aerosol-cloud interaction.
Fig. 11. Cloud Droplet effective Radius (CDR) retrievals averaged over constant bin of Cloud Optical Thickness (COT), for cases of mixed (red) and unmixed (blue) cloud-aerosol layers. Data are representative of low clouds (top pressure lower than 600 hPa) over South-East Atlantic, within [4N-30N;-14E-18E]. Note that in case of mixed layers, only retrievals with AI >0.09 have been selected (polluted clouds). The error bars indicate the statistical uncertainties as in Fig. 5.
Fig. 12. Liquid Water Path (LWP) retrievals averaged over constant bin of Cloud Optical Thickness (COT). Input
24
590
595
600
Fig. 11. Cloud Droplet effective Radius (CDR) retrievals averaged over constant bin of Cloud Optical Thickness (COT), for cases of mixed (red) and unmixed (blue) cloud-aerosol layers. Data are rep-resentative of low clouds (top pressure lower than 600 hPa) over South-East Atlantic, within [4◦N–30◦N; −14◦E–18◦E]. Note that in case of mixed layers, only retrievals with AI > 0.09 have been selected (polluted clouds). The error bars indicate the statistical un-certainties as in Fig. 5.
ponential fit for clean clouds returns an exponent equal to 0.80, which is four times larger than the expected value for adiabatic clouds (0.20) and larger than that obtained using MODIS daily retrievals (for the entire 2005–2010 dataset) over the same area (0.14; not shown). Similarly to the clean cloud case, thin polluted clouds show a positive CDR-COT relationship. The exponential fit returns an exponent equal to 0.59, hardly smaller than in case of well-separated layers. This is consistent with Twomey’s effect, according to which the effective radius of polluted droplets is smaller on average than that of unmixed and clean clouds. A cloud optical thick-ness of approximately 10 defines the threshold value beyond which CDR-COT relationship changes sign, suggesting the occurrence of precipitation in both clean and polluted clouds. For COT between 9 and 11, CDR reaches a maximum value approximately between 17 µm (clean clouds) and 15.5 µm (polluted clouds), sufficiently large to allow for precipita-tion producprecipita-tion. For a COT of 10 (optically thick clouds), the computed exponent of CDR-COT relationship in case of aerosol above clouds is negative and equal to −0.43, about half the expected value in case of constant LWP (−1). In case of polluted clouds, the calculated exponent is four times larger than for clean clouds and equal to −0.11. This means that LWP enhancement with increasing COT is stronger in
mixed than in unmixed cases. In the hypothesis that
precipita-tion occurrence reduces the range of variaprecipita-tion of liquid water path as cloud optical thickness increases, results may indicate an inhibition of precipitation production as a consequence of aerosol-cloud interaction.


![Fig. 13. Number concentration of coincident MODIS-CALIPSO retrievals for all aerosol regimes, in the region within [2S-15S; 14W-18E]](https://thumb-eu.123doks.com/thumbv2/123doknet/13036831.382179/14.892.196.701.98.303/number-concentration-coincident-modis-calipso-retrievals-aerosol-regimes.webp)
