HAL Id: hal-01494304
https://hal.archives-ouvertes.fr/hal-01494304
Submitted on 29 May 2017HAL is a multi-disciplinary open access archive for the deposit and dissemination of sci-entific research documents, whether they are pub-lished or not. The documents may come from teaching and research institutions in France or abroad, or from public or private research centers.
L’archive ouverte pluridisciplinaire HAL, est destinée au dépôt et à la diffusion de documents scientifiques de niveau recherche, publiés ou non, émanant des établissements d’enseignement et de recherche français ou étrangers, des laboratoires publics ou privés.
Numerical study of laser ablation on aluminum for
shock-wave applications: development of a suitable
model by comparison with recent experiments
Simon Bardy, Bertrand Aubert, Laurent Berthe, Patrick Combis, David
Hébert, Emilien Lescoute, Jean-Luc Rullier, Laurent Videau
To cite this version:
Simon Bardy, Bertrand Aubert, Laurent Berthe, Patrick Combis, David Hébert, et al.. Numer-ical study of laser ablation on aluminum for shock-wave applications: development of a suitable model by comparison with recent experiments. Optical Engineering, SPIE, 2017, 56 (1), pp.011014. �10.1117/1.OE.56.1.011014�. �hal-01494304�
1
Numerical study of laser ablation on aluminum for shock waves
applications – Development of a suitable model by comparison with
recent experiments
Simon Bardy,a Bertrand Aubert,b Laurent Berthe,c Patrick Combis,a David Hébert,b Emilien Lescoute,a Jean-Luc Rullier,b Laurent Videaua
a CEA, DAM, DIF, F-91297 Arpajon, France b
CEA, DAM, CESTA, F-33114 Le Barp, France
c Laboratoire Procédés et Ingénierie en Mécanique et Matériaux, CNRS, Arts et Métiers ParisTech, 151 bd de l’Hôpital, 75013 Paris, France
Abstract. In order to control laser-induced shock processes, two main points of interest must be fully understood: the laser-matter interaction generating a pressure loading from a given laser intensity profile and the propagation of induced shock waves within the target. This work aims to build a predictive model for laser shock-waves experiments with 2 grades of aluminum at low-middle intensities (50 - 500 GW/cm2) using the hydrodynamic Esther code. This 1D Lagrangian code manages both laser-matter interaction and shocks propagation. The numerical results are compared to recent experiments led on the Transportable Laser Shocks Generator (GCLT) facility. The results of this work motivate a discussion on the shock behavior dependence to elasto-plasticity and fracturation models. Numerical results of the rear surface velocity show a good agreement with the experimental results and it appears that the response of the material to the propagating shock is well predicted. The Esther code associated to this developed model can therefore be considered as a reliable predictive code for laser ablation and shockwaves experiments with pure Aluminum and 6061 Aluminum in the mentioned range of parameters. The Pressure-Intensity relationship generated by the Esther code is compared to previously established relationships.
Keywords: laser, shock, aluminum, hydrodynamics, elasto-plasticity, fracturation.
*Simon Bardy, E-mail: [email protected]
1 Introduction
For the last decades, industrial applications of shocks generated by laser have arisen. They are
based on lasers delivering from 1 to 100 J with pulse durations of several tens of ns. Focusing
this type of laser beam on a target with a focal spot of some mm² enables heating the matter from
solid to plasma state by inverse Bremsstrahlung absorption [1]. Once created at the surface, the
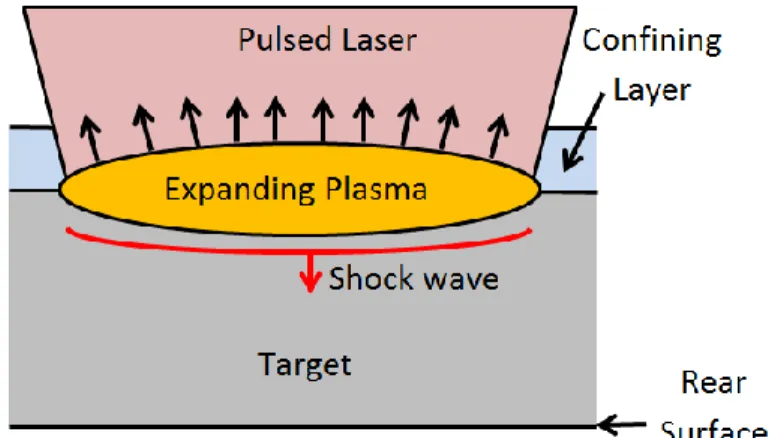
plasma tends to expand in all directions and an ablation pressure (Pabl) of some GPa is created at
the ablation front, in reaction to the ablated matter which is ejected in the normal direction to the
front face. This ablation pressure is applied to the front face in some nanoseconds and generates
the shock pressure and duration in comparison to non-confined experiments which are
traditionally led in vacuum atmosphere [2]; hence confined configurations are preferred for
industrial applications. Monitoring the rear surface of thin targets with velocity measurement
system is usually employed to characterize the shock amplitude on the rear surface.
40
Fig. 1 Schematic view of the generation of a shock wave induced by laser
41
Mastering shockwaves within the material pave the way to industrial outcomes. In all cases of 42
application, the use of laser sources enables repeatability and eases the development of automatic 43
processes. Nowadays, the LASer Adhesion Test (LASAT) and the Laser Shock Peening (LSP), 44
identified as the two main laser shock processes, are well known in the industrial community. 45
The LASAT process aims to assess for the quality of interfaces within multi-layered structures 46
by steering shock waves generated by laser [3]. The LSP is seen as an alternative to classical shot 47
peening which uses high speed micro particles [4]. If the LASAT is expected to start its 48
development phase in various industrial sectors in the upcoming years, the LSP has already 49
proven its efficiency at industrial scale since the beginning of laser-driven shock understanding. 50
In addition, shocks induced by laser are seen as an alternative tool for characterizing solid 51
materials behavior under high speed loading up to 107s-1 without having to take the impactor 52
behavior into account [5] [6]. However, many challenges appear in the laser-matter interaction at 53
this moderate intensity range (10-500 GW/cm2) and even more at low intensities for confined 54
configurations (0.1 – 6 GW/cm²). Some phenomena related to laser-matter interaction or
mechanical behavior of materials, such as elasto-plasticity, may be negligible at higher regimes
and have a determining influence in the laser shocks applications.
The development of a predictive numerical code for the applications mentioned above is the best
way to design process parameters for related applications. Building this predictive code implies
validation by experiments to identify key parameters for the development of new or existing
models to be implemented within the considered code. This paper presents the first step of such
approach which is the validation of Esther in a non-confined configuration. This is achieved
coupling Esther code simulations and rear free velocity measurements of a reference material
(Pure Aluminum) under laser shocks. Sensitivity of the code to material properties is also
investigated with a different grade of aluminum (6061 Aluminum).
2 Numerical tool
Esther is a Lagrangian mono-dimensional code which manages both laser-matter interaction and
shock propagation into the target [7] [8] [9] [10]. It solves the Helmholtz equation for the
deposition of laser energy in the depth of skin and describes the evolution of material state from
solid to plasma. It achieves hydrodynamic calculations on finite volumes using tabulated
equations of state. Calculations include also radiative transfer and heat conduction models. A
mechanical model (S-C-G [11]) has been added to reproduce elasto-plasticity of materials. A
model for damaging and fracturation of materials (Johnson [12]) is also integrated to simulate
spall experiments. This model describes the evolution of porosity in the material from an initial
existing porosity to a maximal porosity that triggers spallation. This process is driven by stresses
the opportunity to generate the temporal ablation pressure profile corresponding to a given
temporal laser impulsion profile. This pressure profile can then be used in 2D-mechanical codes
for studying shock propagation with bi-dimensional considerations.
3 Experimental set-up
We have performed experiments on the Transportable Laser Shock Generator (GCLT) of the
CEA (Alternative Energies and Atomic Energy Commission) which delivers 1064-nm pulses up
to 40 J with 3 to 100 ns durations. This flexibility in terms of pulse duration allows various
studies of laser shock, either dedicated to laser-matter interaction or experimental evaluation of
mechanical properties. The laser pulse temporal profile (I(t)) can be shaped in order to create an
on-demand pulse shape such as Gaussian-like, Triangle or Top-Hat pulses. A vacuum facility
enables direct ablation experiments with a control of the on-target spatial distribution of intensity
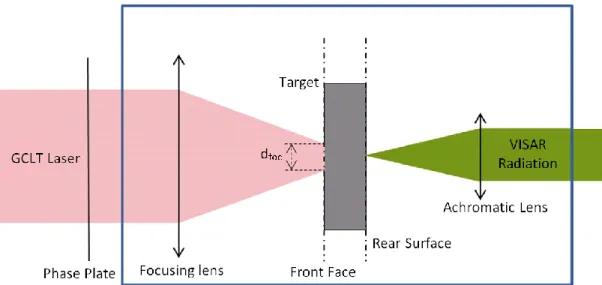
by using phase plates. This configuration is available for spots diameter (dfoc) from 0.25 mm to
4.4 mm. A 532-nm VISAR system [13] allows rear surface velocity measurement on the target
rear surface, as shown on Figure 2.
Experiments have been performed on two different grades of aluminum: a pure laminated
Aluminum 99.999% and a 6061 Aluminum alloy. Material thicknesses (t) are included in a range of 250 μm to 335 μm and pulses duration (τ) varies from 5 ns to 10 ns. Maximal intensities (I)
vary from 50 GW/cm² to 500 GW/cm² in Top-Hat configuration, which gives insights of very
different configurations. For each shot of the mentioned campaign, the temporal intensity profile
and the rear surface velocity profile are extracted.
4 Development of models for materials
Figure 3 and 4 give a comparison of experimental and numerical rear free surface velocities and
corresponding pressure space-time diagrams extracted from calculation. Intensities are in the
range of 170-180 GW/cm2 for 10 ns pulse duration and these experiments were led on pure
Aluminum and Aluminum 6061 samples respectively. The sensitivity of shock to an intensity
variation of +/- 10% is also calculated for the numerical signals. Simulations with and without
Johnson damage model have been performed. The Johnson model used for this study reproduces
material damaging by retroaction on the equation of state and mechanical model. If a certain
threshold of damaging is exceeded, fracturation occurs. In both cases described previously,
modelling the rear surface velocity with and without fracturation model eases the interpretation
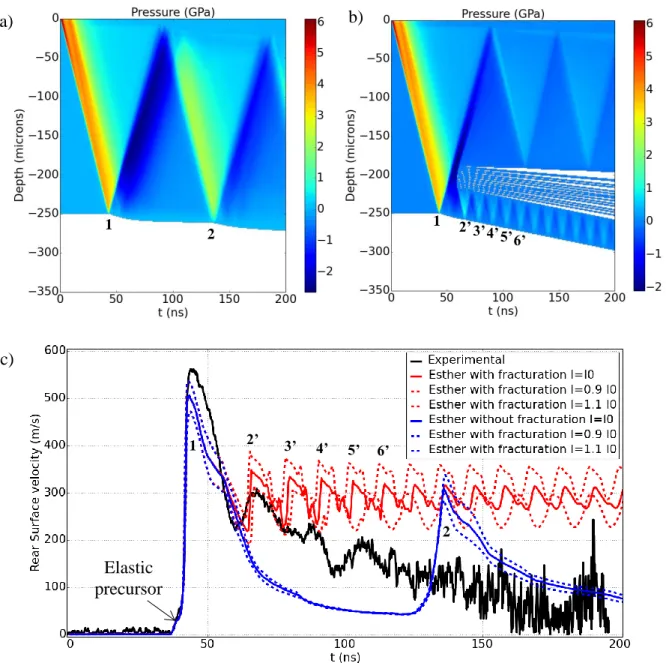
Fig. 3 Space-time diagram without fracturation model (a), with fracturation model (b) and rear surface velocity profile (c) obtained by simulation (+/- 10% on E) with fracturation (red), without fracturation (blue), and compared
to the experimental signal – Pure Aluminum – E=18.3 J – t=250 μm – τ=10 ns – dfoc=1 mm (I=170 GW/cm²)
Typically, rear free surface velocity is characterized by successive oscillations corresponding to
shock waves going back and forth within the target [14]. The period of these oscillations is given
by equation (1). b) a) c) Elastic precursor 1 2 1 2’ 3’ 4’ 5’ 6’ 1 2 2’ 3’ 4’ 5’ 6’
Velocity Wave
Shock
Thickness
Period 2. (1)
In the cases without fracturation model described here (Figure 3 a), Figure 4 a) and blue curves
on Figure 3 c) and Figure 4 c)), the period of oscillations linked to shockwaves going back and
forth within the target thickness is about 90 ns. It is typical of shockwaves travelling through 250
µm-thick aluminum targets. Maxima 1 and 2 correspond to shocks coming out onto the target
free surface and minima are related to the end of unloading of the free surface by release waves.
If damage occurs within the target (Figure 4 b) and red curves on Figure 4 c)), the maximum
after the first peak (2’ – 180 m/s) is attenuated in comparison to the case without fracturation (2 –
310 m/s). This may be due to energy dissipation involved in the damaging process. The increase
of porosity simulated by the fracturation model can be seen as spending energy into the creation
of many new surfaces. If fracturation occurs (Figure 3 b) and red curves on Figure 3 c)), there is
then apparition of two new free surfaces by spallation. In this case, the resulting rear surface
velocity maxima (2’, 3’, 4’, 5’, 6’) refers to back and forth of shock and release waves within the
spall, hence a higher frequency of oscillations (Period ≈ 20 ns). Simulation results prove here the
Fig. 4 Space-time diagram without fracturation model (a), with fracturation model (b) and rear surface velocity profile (c) obtained by simulation (+/- 10% on E) with fracturation (red), without fracturation (blue), and compared
to the experimental signal – Aluminum 6061 – E=20.3 J – t=250 μm – τ=10 ns – dfoc=1 mm (I=180 GW/cm²)
At first glance, experimental results show very different behavior of both materials, regarding
key zones of the rear surface velocity profile, i.e. elastic precursor, maximal velocity and
unloading of the rear surface. This was confirmed by Vickers micro-hardness measurements led
a) b) c) Elastic precursor 1 1 2 2’ 1 2’ 2
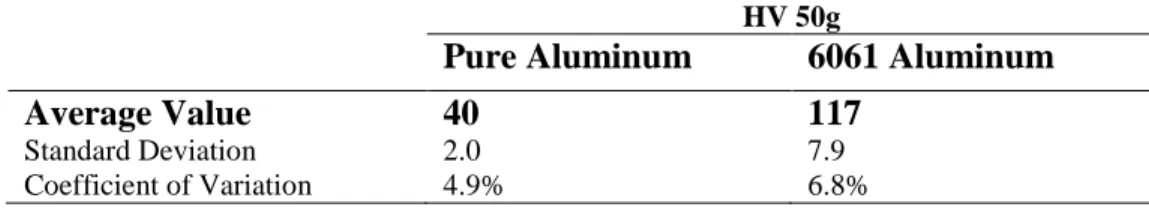
on both materials. A factor 3 exists between both materials since Pure Aluminum and 6061
Aluminum exhibit a hardness of 40 and 117 respectively (Table 1). This implies a difference of
the same order of magnitude in terms of strength and a similar difference of yield strength. This
static mechanical information is correlated to the elastic precursors visible on the rear surface
velocity profiles, which show also a difference factor of the same order of magnitude (30 m/s for
Pure Aluminum vs. 100m/s for 6061 Aluminum).
Table 1 Results of Vickers micro-hardness measurements led on samples HV 50g
Pure Aluminum 6061 Aluminum
Average Value 40 117
Standard Deviation 2.0 7.9
Coefficient of Variation 4.9% 6.8%
Simulations realized with Esther show very good accordance with the experimental curves.
Elastic precursors, related to the elasto-plasticity behavior of materials, are correctly defined.
The maximal velocity peak, impacted by both laser-matter interaction and mechanics is also well
reproduced considering the uncertainty on incident intensity (+/- 10%) and its influence on the
rear surface velocity. Taking into account a good definition of elasto-plasticity in simulations and
the accordance on the maximal rear surface velocity, the laser-matter interaction is then well
defined by Esther. The cut-off point on pure Aluminum and the unloading phase of the
Aluminum 6061 are also correctly reproduced in simulations, even if perfectible. These
observations count for a good modelling of materials damaging occurring for both materials.
Esther reveals here its ability to reproduce laser shock experiments on materials with very
different mechanical behaviors.
Same laser parameters have been used for generating a shock in a thicker sample. Both
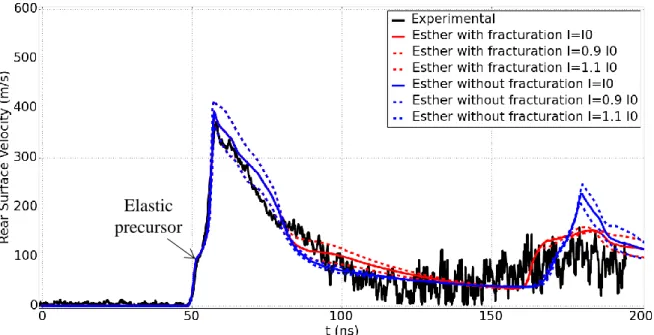
Fig. 5 Rear surface velocity profile obtained by simulation (+/- 10% on E) with fracturation (red) and without fracturation (blue) and compared to the experimental signal – Aluminum 6061 – E=18.2 J – t=335 μm – τ=10 ns –
dfoc=1 mm (I=170 GW/cm²)
Comparing Figure 4 and 5 allows having an insight of the effects of thickness on the behavior of
Aluminum 6061 under identical laser shock conditions [15]. Both configurations generate quite
similar profiles. Maximal rear surface velocity is, as expected, lower for the 335μm-thick sample
(371 m/s vs. 420 m/s). The elastic precursor is easier to identify on the 335 μm-thick sample due
to a longer propagation within the target enabling larger arrival time difference between elastic
precursor and plastic shock. The simulated elastic precursor fits perfectly the experimental one
and confirms here the reliability of the mechanical model associated to Esther for such an
experiment. The comparison of numerical signals generated with and without fracturation model
with the experimental curve obviously demonstrates that this target was damaged, even if not
clearly fractured.
Elastic precursor
Laser shock experiments with lower intensity have been led in order to observe the reliability
of Esther at very low intensity and quasi elasto-plasticity regime. Results are exposed on
Figure 6.
Fig. 6 Rear Surface velocity profile obtained by simulation (+/- 10% on E) with fracturation (red) and without fracturation (blue) and compared to the experimental signal – Aluminum 6061 – E=6.1 J – t=250 μm – τ=10 ns –
dfoc=1 mm (I=50 GW/cm²)
Figure 4 and 6 refer to the same experimental conditions, except about 3 times less induced
intensity on the results of Figure 6. In this configuration, the maximal rear surface velocity is
slightly higher than the elastic precursor (200 m/s and 100 m/s for the beginning of elastic
precursor). Simulations curves representing +/- 10% of uncertainty on intensity are very close to
each other (20 m/s of difference on the peak value). They reveal the small dependence of rear
surface velocity to intensity in this regime. The resulting behavior must then be largely
influenced by the mechanical model of the material and poorly affected by laser-matter
interaction. This must imply that a large part of induced energy is converted into elastic strain
energy and hardening of the material. A very small part is dedicated to hydrodynamic plastic Elastic
shock. The elastic precursor is accurately simulated by Esther, confirming the reliability of the
mechanical model. The first peak is reasonably well reproduced but the unloading phase could
be better fitted with a slightly lower maximal rear surface velocity. After 100 ns, bi-dimensional
effects can be considered to significantly impact the rear surface velocity. After this time, the
large discrepancy between simulation and experimental results can be attributed, for a
non-negligible part, to 2D effects [16].
5 Impact of modulations in I(t)
The experimental I(t) profiles shows modulations intrinsic to the GCLT laser source (Figure 7).
These modulations are about 10-15% around the intensity of a perfect Top-Hat pulse which has
the same experimental fluence (Feq). As shown on Figure 8, these modulations are reported in the
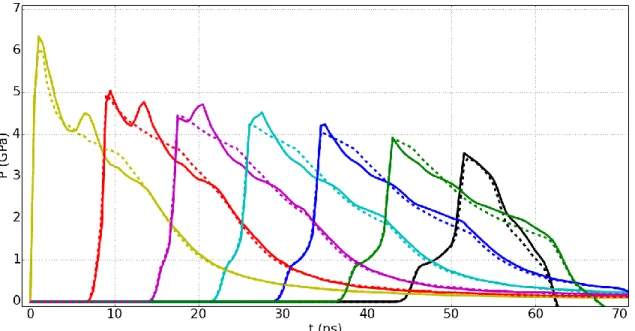
ablation pressure profile (Pabl(t)), numerically determined with Esther. While the shock wave
propagates within the target thickness, these modulations are attenuated. Beyond 200 μm of
propagation, the form of the pressure profile (P(t)) generated with the experimental I(t)
corresponds to the theoretical Top-hat one. The first peak of the experimental profile is higher
than the maximal intensity of the theoretical Top-Hat which explains a higher maximum in
Pabl(t). However, the here above-mentioned modulations are responsible of multiple release
waves within the pressure profile. They increase the attenuation of the pressure peak along the
propagation within the thickness. At 250 μm of propagation, both experimental and theoretical
Top-Hat profiles have the same maximal pressure value. Beyond this value, the experimental
profile has a lower maximal, generating a maximal rear surface velocity (v(t)) slightly smaller
Fig. 7 I(t) for a 10-ns GCLT Top-Hat (full line), and 10-ns numerical Top-Hats defined with a fluence equal to the measured experimental fluence (dotted line)
Fig. 8 Pabl(t) (yellow) and P(t) at 50 μm (red), 100 μm (magenta), 150 μm (pale blue), 200 μm (dark blue) and 250 μm (green) of propagation for a 10-ns GCLT Top-Hat (full lines) and 10-ns numerical Feq Top-Hats (dotted line)
Fig. 9 v(t) for a 10-ns GCLT Top-Hat (full line) and a 10-ns numerical Top-Hat defined with a Feq (dotted line)
This numerical study highlights the diminution of modulations in the temporal loading profile
with the propagation in the material. It shows that these perturbations have no significant impact
on the shape of the rear face velocity peak and a very limited impact on the maximal rear face
velocity. Using a perfect Top-Hat impulsion for numerical predictions in the frame of future
experimental campaigns should give a good approach of what is expected with real profiles.
6 Validating laser-matter interaction model with Esther
As mentioned before, Esther simulates the laser-matter interaction to generate an ablation
pressure used as mechanical solicitation for modelling the behavior of material under shock
loading. In order to validate the ability of Esther to generate adequate ablation pressure, P-I
points obtained with Esther must be compared to a well-known P=f(I) law such as the one
developed by Phipps from the works of Caruso [17], [18] , Nemchinov [19] and Kidder [20]:
8 / 1 4 / 1 4 / 3 A I Pabl (2)
It has been identified by Phipps as the best law for representing experiments [21]. In this study A
was chosen as equal to 1.
Pabl(t) are obtained with Esther, using the model used for fitting experiments results with
simulations (IV). This numerical study is achieved with a range of intensities from 50 to
500 GW/cm² for 5-ns, 10-ns and 50-ns for Top-Hat and Gaussian pulses. The maximum value of
Pabl(t) is extracted and plotted versus the maximum value of I(t). Results are described on
Figure 10.
Fig. 10 P=f(I) with P(t) defined with Esther and from the equation (2)
For Gaussian pulses obtained with Esther, an increase in P with a decrease of pulse duration is to be noticed. This is corroborated by Phipps’ law. The overall trend of all points obtained
with Esther for Gaussian profiles show the same progression of P than Phipps law. Despite some
fluctuations, this agreement is good, especially for rather high intensities (>250 GW/cm²). P-I
points with Top-Hat impulsions obtained with Esther are very close to the one obtained with
Pabl(t) seem to not be influenced by the pulse duration (τ) since simulations realized with Esther
generates exactly the same maximum in ablation pressure, whatever τ. In the considered regimes,
τ seems to have an influence on the loading duration but the maximum value is generated by the
very first ns of interaction. Hence, at equal intensity, a Top-Hat laser impulsion generates equal
maximum of Pabl.
8 Conclusion
The use of Esther for reproducing experiments has been demonstrated. The results presented here
show a coherent laser-matter interaction and accurate simulation of mechanics, shock behavior,
damaging and fracturation of materials. In the considered configurations, this code demonstrates
its ability and can therefore be used for predicting and designing future laser experiments in
non-confined configurations. Future work has to be done in order to develop Esther for materials such
as polymers, composites and alloys under laser shock in confined configuration.
References
1. P. Mora, “Theoretical model of absorption of laser light by a plasma,” Physics of Fluids, 25, 1051(1982)
2. N.C. Anderholm, “Laser-generated stress waves,” Applied Physics Letters, 16, 113 (1970)
3. L. Berthe et al., “State-of-the-art laser adhesion test (LASAT),” Nondestructive Testing and Evaluation, 26 (3-4), 303-317 (2011)
4. R. Fabbro et al., “Physics and applications of laser-shock processing,” Journal of Laser Applications, 10 (6), 265-279 (1998)
5. G. Seisson et al., “Dynamic fragmentation of graphite under laser-driven shocks:
6. D. Laporte, “Analysis of the response of bonded assemblies under shock wave loading – Experiments and modelling,” PhD. Manuscript (2011)
7. J. P. Colombier et al., “Hydrodynamic simulations of metal ablation by femtosecond laser irradiation,” Physical Review B, 71, 165406 (2005)
8. P. M. Leguay et al., “Ultrafast Short-Range Disordering of Femtosecond-Laser-Heated Warm Dense Aluminum,” Physical Review Letters, 111, 245004 (2013)
9. S. Laffite et al., “Velocity Interferometer blanking due to preheating in a double pulse planar experiment,” Physics of Plasma, 21, 082705 (2014)
10. G. Seisson et al., “Dynamic cratering of graphite: experimental results and simulations,” International Journal of Impact Engineering, 63 (2014)
11. D. J. Steinberg et al., “A constitutive model for metals applicable at high strain rate,” Journal of Applied Physics, 51, 1498 (1980)
12. J. N. Johnson, “Dynamic fracture and spallation in ductile solids,” Journal of Applied Physics, 52, 2812 (1981)
13. L. M. Barker et al., “Laser interferometer for measuring high velocities of any reflecting surface,” Journal of Applied Physics, 43, 4669 (1972)
14. L. Tollier et al., “Study of the laser-driven spallation process by the velocity interferometer system for any reflector interferometry technique. I. Laser-shock characterization,” Journal of Applied Physics, 83, 1224 (1998)
15. F. Cottet et al., “Spallation studies in aluminum targets using shock waves induced by laser irradiation at various pulse durations,” Journal of Applied physics, 66 (9), 4067-4073 (1989)
16. M. Boustie et al., “Study of damage phenomena induced by edge effects into materials under laser driven shocks,” Journal of Physics D: Applied Physics, 40, 7103-7108 (2007)
17. A. Caruso et al., “Ionization and heating of solid material by means of a laser pulse,” Nuovo Cimento, 45, 176 (1966)
18. A. Caruso et al., “Some properties of the plasmas produced by irradiating light solids by laser pulses”, Plasma Physics, 10, 867 (1968)
19. I. V. Nemchinov, “Steady-state motion of radiation-heated vapors of a material in the presence of lateral spreading flow,” Journal of Applied Math. And Mech., 31, 320 (1967)
20. R. E. Kidder, “Application of lasers to the production of high-temperature and high-pressure plasma,” Nucl. Fusion, 8, 3 (1968).
21. C.R. Phipps et al., “Impulse coupling to targets in vacuum by KrF, HF, and CO2 single‐pulse
lasers,” Journal of Applied Physics, 64, 1083 (1988)
Biographies
Simon BARDY received a Master degree from the European School of Material Sciences
and Engineering in 2014.
After having worked 1 year in a mechanical testing department of a major producer of civil
aircrafts, he is currently PhD student in daily collaboration with Dr. Laurent VIDEAU at the
Alternative Energies and Atomic Energy Commission (CEA, DAM, DIF), under the supervision
of Dr. Laurent BERTHE (PIMM-ENSAM ParisTech). His works aim at developing the LASer
Adherence Test (LASAT).
Table Caption List
Table 1 Results of Vickers micro-hardness measurements led on samples
Figure Caption List
Fig. 1 Schematic view of the generation of a shock wave induced by laser
Fig. 2 Schematic view of the experimental set-up used on GCLT
Fig. 3 Space-time diagram without fracturation model (a), with fracturation model (b) and rear
surface velocity profile (c) obtained by simulation (+/- 10% on E) with fracturation (red),
without fracturation (blue), and compared to the experimental signal – Pure Aluminum – E=18.3
J – t=250 μm – τ=10 ns – dfoc=1 mm (I=170 GW/cm²).
Fig. 4 Space-time diagram without fracturation model (a), with fracturation model (b) and rear
surface velocity profile (c) obtained by simulation (+/- 10% on E) with fracturation (red),
without fracturation (blue), and compared to the experimental signal – Aluminum 6061 – E=20.3
J – t=250 μm – τ=10 ns – dfoc=1 mm (I=180 GW/cm²).
Fig. 5 Rear surface velocity profile obtained by simulation (+/- 10% on E) with fracturation
(red), without fracturation (blue), and compared to the experimental signal – Aluminum 6061 –
E=18.2 J – t=335 μm – τ=10 ns – dfoc=1 mm (I=170 GW/cm²)
Fig. 6 Rear surface velocity profile obtained by simulation (+/- 10% on E) with fracturation
(red), without fracturation (blue), and compared to the experimental signal – Aluminum 6061 –
E=6.1 J – t=250 μm – τ=10 ns – dfoc=1 mm (I=50 GW/cm²)
Fig. 7 I(t) for a 10-ns GCLT Top-Hat (full line), and 10-ns numerical Top-Hats defined with a
Fig. 8 Pabl(t) (yellow) and P(t) at 50 μm (red), 100 μm (magenta), 150 μm (pale blue), 200 μm
(dark blue) and 250 μm (green) of propagation for a 10-ns GCLT Top-Hat (full lines) and 10-ns
numerical Feq Top-Hats (dotted line)
Fig. 9 v(t) for a 10-ns GCLT Top-Hat (full line) and a 10-ns numerical Top-Hat defined with a
Feq (dotted line)