HAL Id: halshs-00458503
https://halshs.archives-ouvertes.fr/halshs-00458503
Submitted on 21 Feb 2010
HAL is a multi-disciplinary open access
archive for the deposit and dissemination of sci-entific research documents, whether they are pub-lished or not. The documents may come from teaching and research institutions in France or abroad, or from public or private research centers.
L’archive ouverte pluridisciplinaire HAL, est destinée au dépôt et à la diffusion de documents scientifiques de niveau recherche, publiés ou non, émanant des établissements d’enseignement et de recherche français ou étrangers, des laboratoires publics ou privés.
Measuring intermodalism at European port cities: An
employment-based study
César Ducruet, S.W. Lee
To cite this version:
César Ducruet, S.W. Lee. Measuring intermodalism at European port cities: An employment-based study. World Review of Intermodal Transport Research, 2007, 1 (3), pp.313-334. �halshs-00458503�
Measuring intermodalism at European port cities:
An employment-based study
Published in: World Review of Intermodal Transport Research 1(3), 313-334
César DUCRUET
Erasmus University Rotterdam
School of Economics, Department of Port, Transport and Regional Economics Burg. Oudlaan 50, Woudestein, Room H12-13
P.O. Box 1738, 3000 DR Rotterdam, The Netherlands
Tel. +31 (0)10-408-1678 / Fax +31 (0)10-408-9141 / Email: [email protected]
Sung-Woo LEE
Port Research Center / Korea Maritime Institute Bangbae-dong, Seoul, Korea
Tel. +82 (0)2-2105-2830 / Fax +82(0)2-2105-2839 / Email: [email protected]
ABSTRACT
This paper proposes a continental approach to the combination of transport functions within European port cities. It reviews a number of concepts and theories, regarding with transport chain integration and urban centrality in the case of ports. While many studies on intermodalism face a lack of quantifiable data, this research proposes an original methodology based on employment. The data is collected for 76 port cities, 9,000 companies and more than one million employees in all transport modes. By bringing together employment figures and basic urban and port indicators, results of the factor analysis show the different functional and spatial trends. There is a recurrent opposition between freight and passenger-oriented specializations among port cities, which are also influenced by the European core-periphery spatial pattern. In addition, a benchmarking of port cities in terms of their intermodal potentials is provided as a means for policy implications.
Keywords: Core-periphery, Europe, Freight, Intermodalism, Logistics integration, Passenger, Port city
Acknowledgements: the authors would like to thank anonymous reviewers of the journal, as well as those of the International Association of Maritime Economists to whom this paper was presented in July 2007 at the Greece conference, for their useful comments.
1. INTRODUCTION
In Europe, maybe more than in other major port regions of the world, the integration of transport functions is a crucial problem for planners and related companies. In order to support growing trade amounts efficiently, transport and logistics players have elaborated new strategies through the promotion of logistic chains, induction of high-tech systems, and door-to-door services for just-in-time freight delivery. The context of globalisation and the emergence of containerisation are important factors to motivate players to adapt themselves to the demand and supply of industries. As a consequence, transportation nodes, of which ports, are embedded in the new paradigm of value-driven transport chains (Robinson 2002). The concept of integration encompasses a number of issues like the intermodalism, inter-firm cooperation and the institutional aspects of transport planning at local, regional, national and international levels (Goetz and Rodrigue 1999; Mc Calla et al. 2001).
However, most approaches of intermodalism in the related literature either focuses on managerial, institutional aspects (Langen de and Chouly 2004), with little regard to analytical frameworks and conceptual models (Bontekoning et al. 2004). Thus, comparative studies and spatial studies are very few, notably on an international level, while there is a growing literature based on case studies. Therefore, this paper questions the existence of general factors that would explain – at least in part – the fact that in Europe, “real intermodal junctions which comply with the complex physical and functional demands (…) are still very rare” and “there is no transport company which is responsible for either building or operating intermodal junctions” (Keller 2004). Is it
possible to highlight invariant factors affecting transport nodes and their modal diversity, beyond the physical site and the individual strategies of transport firms in particular contexts? In the case of ports, some authors have argued that the development of containerization strengthens the dependence of ports on remote markets and, as a consequence, lowers the port‟s ability to create local externalities of which the development of a diversified intermodal network (Notteboom and Rodrigue 1999; Ducruet 2006). Then, a rise in volume and efficiency of handling techniques and distribution within and surrounding port areas do not necessarily lead to more integrated and diverse transport functions. Out of Europe, other cases show the combination of a wide set of activities, as seen in New York with the port authority (PANYNJ) also implicated in rail service between port and hinterland, the management of highways, and waterfront redevelopment (Rodrigue 2003). Asian countries offer different combinations, such as air-sea connection for freight, as seen in the global hub port cities of Hong Kong and Singapore (Lee 2005), but also in Dubai, and Incheon „Pentaport‟ in South Korea. In Asia and North America, the combination of transport functions within port cities is facilitated by the coastal concentration of populations and economic activities.
In order to provide a global snapshot of the European situation, this paper proposes a continental approach to intermodalism, as argued by Hayuth (1987): “intermodal transport is highly correlated with the geographical setting and spatial organization of the region and continent”. In Europe, every transport node can be thus considered as one element of a continental urban system. By shifting intermodal issues from transport to urban considerations, it is possible to interpret the different modal specializations of the transport nodes as part of a wider - and more classic - research area focused on the functions of cities. Because the literature on urban functions and urban systems in general is largely developed elsewhere, this paper can be considered as a first
attempt to relate those to intermodal issues. As for any international comparison of economic activities shaping the economy of cities, it faces a series of challenges to find the relevant data that could help verifying how different transport modes are more or less represented in an urban system.
Most frequent measures of modal shares at seaports are based on traffics by categories (sea, road, air, railway, river…). However, such dataset is not yet available throughout Europe for a number of reasons. First, European-wide datasets do not exist on modal traffics by city or even by region or province. Even case studies on intermodality rarely provide a detailed snapshot of the modal split in a single place. Port authorities that are willing to provide their statistics on modal traffics (e.g., sea, river, rail, and road) are very few, and, not only such datasets are often not comparable among different ports, but it also remain confined within the port area. Because transport and logistic activities are key elements in the port-city relationship, their measurement should be extended to the whole port city. Second, as hinted by Mc Calla et al. (2004) in the case of inland logistics, “there are no common data sources, and (…) quantifiable sets of parameters cannot be produced” [and the] “lack of comprehensiveness of indicators of logistics operations restricts any substantive evaluations”. This explains why previous studies of intermodality at European ports have chosen an infrastructure-based approach (Joly and Martell 2003). Since every mode has its own measurement units, which are not directly comparable, such as different tons, containers, passengers, and so on, it is believed that such constraints can be partly relieved by an analysis based on the employee, a single unit.
This paper argues that employment is a good indicator of the weight of transport and logistic activities within port cities, while “transport workers get little attention” when dealing with intermodalism (Barzman and James 2004). New variables built from
employment figures collected from the Kompass1 database allow using classical quantitative techniques such as factor analysis, which are used extensively in the case of ports (Tongzon 1995; Lee and Kim 2006). Furthermore, such data source seems more effective than the collection of national-based censuses already used in previous studies. For example, analysing the distribution of employment in transport activities by using local data and national census has proved very challenging while comparing Le Havre and Southampton due to the mismatch of the different classification systems (Frémont and Ducruet 2002). Recent studies of port-related employment (Gripaios and Gripaios 1995; Gripaios 1999; Musso et al. 2000) benefit from the existence of nation-wide datasets, but remain limited to a single country or place, such as Plymouth or Genoa. Although a methodology based on modal figures might not be matched with the core issue of intermodalism, or may even contradict the concept itself based on the integrated transport of unitised goods (ECMT 1993), at least it can be considered as an attempt to evaluate the different ways in which transport functions are associated, rather than effectively combined.
The first section introduces the theories of port-urban linkages with regard to the European case, and addresses the main hypothesis of the research. The second section introduces the methodology used for selecting port cities and measuring employment in all transport activities. The factor analysis in the third section allows illustrating the major trends of logistics integration and intermodalism in Europe, together with their spatial distribution. Finally, some implications of the results are given for ports, port cities, industries, and related planning and policies.
2. PORT-URBAN LINKAGES AND LOGISTICS INTEGRATION IN EUROPE
2.1 Ports and Economic Functions
The case of ports is often peculiar, traditionally combining the advantage of maritime transport and the disadvantage of land transport, as “eccentric centres” (Bird 1973). The theory of gateway functions (Bird 1977), which has been relevant in Europe during periods of coastal urban development and industrialization, implies that port cities can overcome their peripheral situation through economies of scale brought by maritime transport (Vallega 1983; Goss 1990) and, in some cases, reach higher rank and size than those determined by the central place theory.
The gateway theory, which aimed at giving ports a more respectable position within urban studies, has been verified in some cases like Bordeaux (Gutmann 1986), Le Havre and Southampton (Brocard 1994), which have grown more than the central place theory would have predicted, thanks to their wide connections to global maritime systems. The development of global cities is based on this paradigm (Keeling 1995), as most of these places developed from maritime functions (Dogan 1988) and attracted regional air hub functions, while dominating their hinterland for rail and road transport infrastructures and services. However, such trends are more likely to be found in the developing and formerly colonial world, with the formation of primate cities (McGee 1967), rather than in Europe. Thus, there is a strong diversity of hinterland spatial organizations on a continental scale, as showed in Figure 1.
[Insert Figure 1 about here]
Another theory on the “self-agglomeration and hub effect” taking place in port cities has developed the “lock-in effect” of urban systems (Fujita and Mori 1996). Because already established urban centres retain major economic functions, those
functions cannot be developed through or attracted by modern ports and terminals, which are planned outside cities and do not have a sufficient attractivity or employment returns. This particularly applies to spatially centralized countries where core areas such as Paris, France or Seoul, Korea concentrate higher service functions while port cities such as Le Havre, Marseilles, Incheon and Busan are specialised in industrial and port functions (Frémont and Ducruet 2005). This is also hinted by Stern and Hayuth (1984) in their model of the remote gateway, in which port functions do not foster urban development, in terms of economic diversity or urban demographic growth. In the end, it is assumed that the variety of transport functions in port cities is a corollary of their urban and regional economic diversity. Furthermore, the regional environment of port cities is also dependent on the geographical, political and economical fragmentation of Europe regarding intermodal transport issues (Charlier and Ridolfi 1994).
2.2 Freight Transport vs. Passenger Transport
The implications of such theories are important for European ports in many ways. The liberalization of the European market is giving more impetus to port competition and concentration in serving a single and extending hinterland. However, the positive effects of traffic growth on local economic diversity can be questioned. While the connection between ports and the European heartland is getting more complex and more efficient, port cities remain secondary markets compared to the rest of the hinterland. The improvement of transport linkages between ports and the hinterland, in fact, do not motivate economic players to invest in port cities. Several studies indicate a lower economic weight and diversity of port cities in Europe (Lever 1994; Rozenblat 2004). Inland cities tend to retain higher functions (Brunet 1989; Rozenblat and Cicille 2003). This spatial division of functions has taken place, with heavy industry shifting towards
ports from the 1960s, accentuating their dependence on uneven global change, and leading to the combination of higher unemployment and lower services (Lawton and Lee 2002). This also explains why port cities have been often given lower ranks in urban typologies (Pumain and Saint-Julien 1976). The risk for the European transport policy is to reinforce the problems of peripheral regions (of which port regions) while seeking to improve their connection to core regions. Oppositely, the problems faced by port cities can be turned as advantages, notably in terms of waterfront redevelopment, as seen as one example of urban regeneration (Gordon 1997; Hoyle 2000; Marshall 2001). One important strategy of port cities is, therefore, to develop passenger transport (air, rail) rather than freight transport, as a means to improve their position within the European urban system and their economic attractiveness. Thus, the purpose of gateways to bypass “the threat of traffic gridlock in metropolitan areas” [and to improve their] “unique position to stimulate intermodal transport in Europe and use intermodal systems as a tool to enlarge their hinterlands” (van Klink and van den Berg 1998) can be seen as both complementing and contradicting the urban strategy. This research is thus also looking at the different associations of transport functions in relation with either port or urban attributes.
3. METHODOLOGY 3.1 Selecting the Port Cities
The sample of port cities is composed of 76 places, representing 871,059,239 tons of waterborne trade (7.2% of world total), 48,374,388 TEUs (16.4% of world total) and 86,128,000 inhabitants (22% of national-related population). Places were chosen throughout European territory for their belonging to both seaborne container and air services, each of them reflecting a specific dimension of transport networks. Some cities
being only inserted in one of the two services have been excluded, like Felixstowe, Zeebrugge, Dunkirk, Gioia Tauro, Algeciras, Messina, Salerno, Kotka, and Marsaxlokk. Moreover, inland port cities have been excluded even though they share both river trade and air traffic like Paris, Strasbourg, and Duisburg so as to keep a geographical homogeneity based on seaports. Estuarine upstream port cities, being more close to the sea, have been kept, like Nantes, Bordeaux, Rouen, Hamburg, Rotterdam, Sevilla, Antwerp, Bilbao, Bremen, Bristol, Cardiff, Southampton, Glasgow, Hull, and London although there shall be an effect of this particular location on their modal split. Due to data collection on a metropolitan rather than a local administrative level, some cities may have their population larger than generally.
3.2 Measuring Employment
Given the trend of logistic development in outer urban areas, employment figures have not been restrained to the inner city area. Many activities such as air transport and related logistics, distriparks, multimodal platforms and also container terminals tend to locate at peripheral sites that are more convenient for environmental and technical matters. We have therefore considered the various official metropolitan areas in all countries. When this was not provided, the contiguous or morphological urban area has been preferred so as to include suburban districts (Moriconi-Ebrard 1994), by selecting the companies with their postal addresses.
The Kompass database provides information for a 1.9 million companies in 70 countries worldwide. Because financial information such as annual turnover is not available for all firms, employment has been preferred although it is less efficient to weight the activities. Transport activities have been selected among others by using the different codes (Table 1). Calculating the total number of employees by port city and
transport mode has faced some difficulties. Because several companies operate in more than one transport mode (e.g., sea and air) their employees have been redistributed equally among those different modes. We are aware of the limits of such methods. Table 1 provides the detail of the activities together with aggregated figures. The aggregation of some activities has been necessary to get a clearer picture of the modal distribution, and also to avoid the lack of correlation between the different activities, that is a requisite for a standard factor analysis. In the end, seven categories are kept for analysing the distribution of activities among port cities, from a collection of 8,926 transport-related companies and resulting in a total of 1,154,866 employees. Total employment is well balanced among port and maritime transport (28.1%), air transport (19.5%), logistics and warehousing (15.7%), rail transport (15.4%), road transport (14.5%), and forwarding (6.8%). In the following sections, those employment variables are gathered with basic attributes of port cities such as demographic size (Helders 2005), port traffics (Lloyd‟s List 2005), and air traffics (Aéroports Magazine 2005). The complete dataset is provided in Appendix A.
[Insert Table 1 about here]
3.3 Preliminary Outcomes
The distribution of employment by main region (Table 2) shows the dominance of Northern Europe in all branches of activities, although it has a comparable number of port cities with Southern Europe. Within the north, the Scandinavia / Baltic area shows a strong specialisation in port, railways, logistics, air, and road transport. This illustrates the historical importance of Scandinavia in the European transport sector. Northwest Europe is better represented by maritime transport, port tonnage and forwarding. This clearly
indicates the strategic position of this region regarding the mass transit of freight movements to and from the European heartland. Comparatively, other areas are poorly represented, except for the British Isles with air tonnage and population (the London hub); West Mediterranean with population, land transport and port tonnage; East Mediterranean with air tonnage. Such differences in employment volumes can also be explained by the different economic structures of the countries. In Northern Europe, major groups are located such as Multinational Corporations, but in the south, transport activities are more likely to be dominated by small and medium-sized companies. Also, the areas have a different history in terms of public/private investment in transport activities.
[Insert Table 2 about here]
In terms of the distribution of passenger-related activities relative to freight-related activities, the spatial pattern is also interesting (Figure 2). Most cities having a high share of passenger-related activities compared to the share of freight-related employment locate away from the European heartland, except for some cities such as Bordeaux and Nice in France, and Amsterdam in Holland. This highlights the importance of remote metropolises that are either national capitals, such as Dublin, Lisbon, Athens-Piraeus, Stockholm, Helsinki, Riga, or regional capitals, such as Gothenburg and Leixoes-Porto. Those major urban settlements combine a lack of inland connectedness with the core regions and the problems related to lack of space for extensive port activities in large urban areas.
The distribution of the share of transport employment by mode and by port city offers a better perspective (Figure 3). Although such analyzing tool is not perfect due to the variety of situations, there is a noticeable opposition between different groups of variables and, therefore, of port cities. Port and sea transport employment are opposed to logistics and road transport employment, while air, railway, and forwarding stand in between those two groups. Unsurprisingly, the first group is represented by major seaports such as Hamburg, Le Havre, Genoa, Liverpool, Rotterdam, and Marseilles. The second group by coastal cities where port functions are not very important compared to their role as distribution centres, such as Rouen, Nantes, Bordeaux, Nice, and Brest in France. Finally, the third group, though it is smaller in size, comprises major air transport hubs and large urban areas such as London, Amsterdam, Athens, and Lisbon.
[Insert Figure 2 about here]
However, this snapshot of the situation does not provide sufficient evidence on the interplay of the different transport functions, which can be estimated better through a factor analysis.
4. FACTOR ANALYSIS 4.1 General Trends
Before running the factor analysis, the variables have been changed to logarithms in order to reduce peak values. The factor analysis is based on a Spearman correlation matrix. This latter correlation is calculated by applying the Pearson correlation formula to the ranks of the data rather than to the actual data values themselves. In so doing, “many
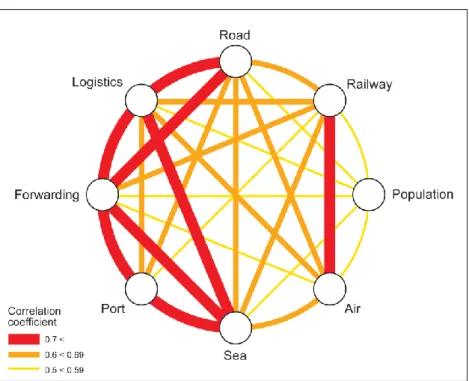
of the distortions that plague the Pearson correlation are reduced considerably” (Nagpaul 2005). The graph of most significant correlations (Figure 4) shows both the importance of forwarding activities in the integration of transport modes, and the division between on one side freight-oriented activities (forwarding, road, port, sea, logistics), and passenger-oriented activities, on the other side (railway, air).
[Insert Figure 4 about here]
Results provide four main factors accounting for more than 85% of the total variance (Table 3). The following sections describe the meaning of the observed trends and provide an interpretation of their geographical distribution.
The first logic (F1) gives the most important direction of transport functions‟ concentration, with forwarding, warehousing, sea and road employment at the top of the hierarchy. This order can be interpreted as a hierarchy of transport nodes across the European continent.
The second logic (F2) clearly opposes maritime transport to air transport. Port traffic, port and sea employment are opposed to air traffic, air and railway employment, and population. It is clear that ports‟ efficiency attracting freight traffics is not well matched with passenger-oriented activities and the size of cities. Then, places of transit or „port gateways‟ are opposed to „central places‟ for which the attractivity is more based on passengers (i.e., tourists or high-skilled workers).
The third logic (F3) is also an opposition. Port and air traffics show the importance of freight generation, while road, forwarding and warehousing employment show the importance of distribution and logistics. We propose thus to interpret such trend as an opposition between freight centres and logistics centres.
Finally, the fourth logic (F4) offers a very interesting opposition. Employment in several transport modes (air, port, sea, and railway) is opposed to demographic size and road employment. Although it is a very secondary trend, it can be interpreted as a meaningful distinction between the banal characteristics of cities and their transport specialization. Thus, transport activities will not have a predominant role for „anycities‟, while other places with a less developed economy will be more specialized as „transport nodes‟.
[Insert Table 3 about here]
4.2 Concentration of Transport Activities (F1)
The first factor is dominated by forwarding, logistics, and sea transport. It means that those activities are the most commonly represented in the port cities, and are likely to be combined in a hierarchical way. The two most important variables have in common to reflect in the freight sector, but they operate for various industries and act as integrators of different modes, among which sea and road transport are better represented.
As noticed above, northern port cities are more concentrated (Figure 5), notably in the Scandinavia/Baltic area and the northern range (here from Antwerp to Hamburg). Elsewhere, we see the importance of major cities, either national capitals (London, Dublin, Lisbon, and Piraeus-Athens) or regional capitals (e.g., Marseilles, Barcelona, and Naples). The poor representation of the Atlantic Arc and the Mediterranean, for a majority of port cities, comes from their relative peripheral situation from the European heartland, but also reflect different histories. The privatisation of several transport sectors in UK since the 1980s has probably affected employment volumes in the port cities. Another explanation is the different configurations of the national urban systems.
Spatially-centralised countries (e.g., France, Spain) show a lower concentration level in their port cities than more balanced countries (i.e., the „Rhine‟ model), due to the primacy of national capitals. The largest and dominant city tends to combine all transport modes while port cities remain specialised in port and distribution. The highest score for Hamburg is easily explained by its central situation within the heartland compared to other port cities, which has undoubtedly fostered its multifunctional character. For instance, several global carriers have elected Hamburg as their European head office, such as COSCO, CSCL, China Shipping, and even Yang Ming moved its head office from London to Hamburg in 1992, illustrating the new phase of the European market and integration.
[Insert Figure 5 about here]
4.3 Port Gateways vs. Central Places (F2)
The radical opposition between passenger-oriented activities (air, rail, population) and freight-oriented activities (port, sea, forwarding), and more precisely of air and port traffics, is emblematic of the distinction in Europe between gateways and central places (Ducruet et al. 2007). The development of airports has followed the already existing urban hierarchy, and thus the pattern of railway nodes, while port activities and maritime transport have developed separately, for the purpose of serving continental markets from eccentric locations. As in the French case, waterway barging and rail transport have been fiercely competing for decades, which had serious consequences on the contemporary „divorce‟ between ports and railways (Merger 2004). In terms of statistical relevancy, the combination of port traffic with port employment and air traffic with air transport
employment, although it may appear obvious, is proving the quality of the original dataset from Kompass.
[Insert Figure 6 about here]
The related map (Figure 6) shows clearly the port and maritime specialisation of port cities located along the „heartland‟. Apart few exceptions such as Nice and Amsterdam, most of all other cities are in a peripheral situation. Such spatial and functional opposition clearly reflects the influence of the core-periphery pattern of European activities and settlements on the nature of transport activities within port cities. The specialization of Le Havre and Rouen is accentuated by their proximity to the Paris urban region, their main hinterland. Other similar profiles in northern Italy and along the North and Baltic seas have lower scores probably due to better connections to the heartland. It is interesting to remark that for Barcelona, the air and landside activity is more important than the port and maritime activity, but other port cities located around Madrid are also specialized in port activities. The cases of Bergen, Bari and Constantza are well explained by the absence of an important airport and by their important seaborne bulk cargoes.
4.4 Logistics Centres vs. Freight Centres (F3)
Some cities are more likely to have developed trucking (road, logistics, and forwarding) while other are specialized in the handling of cargo volumes in general (air-sea freight). Although in reality, road transport and (air-sea-air freights cannot be separated, such opposition may be interpreted as a distinction between value-added centres, with
additional activities such as distribution, packaging, and storage, and load centres, which are better defined by the level of cargo volumes passing through.
[Insert Figure 7 about here]
In the map (Figure 7), load centres are concentrated around the heartland (northern range Antwerp-Hamburg and southern range Barcelona-Trieste) and value-added centres are more likely to locate in the western fringe (Edinburgh-Malaga) and in the Scandinavia-Baltic (Aarhus-Helsinki) area, but the pattern is not perfect and has several exceptions. Some are obvious, such as the case of island port cities (Palma, Valletta, St. Helier, and Belfast), where road transport is limited, or the case of remotely located port cities where the airport plays a crucial role for freight (e.g., Bergen, Edinburgh, and Thessaloniki). Value-added centres usually have lower port activities and are more likely to be regional economic centres for their regional or national economy (e.g., Rouen, Nantes, and Bordeaux).
4.5 Anycities vs. Transport Nodes (F4)
Although this factor is less weighty (only 6% of the variance) as shown in Table 3, if offers a possibility to distinguish cities according to their overall level of specialisation in the transport sector. For some cities, their size as market centres is more important than the employment generated in transport activities. Inversely, some cities are developed in the transport sector but they are not well represented as market centres. Again, such distinction between central place and gateway is usual in Europe and is depicted in a vast literature such as typologies of cities (Ducruet and Lee 2006).
When transferred to a map (Figure 8), this trend takes a remarkable signification. Market centres locate mostly in the western part (from southern Iberian Peninsula to British Isles) and in the southeast (southern Italy and Greece). Transport nodes concentrate in the Scandinavia-Baltic area, northern Italy, and some more in Ireland and along the English Channel. For the southern cities, perhaps it is reasonable to explain their profile by the importance of tourism in their development. The rapid urbanisation of coastal zones, notably along the Spanish gold coast since the 1960s, has increased the size of cities while their traditional industries and ports have stagnated. For the British cities, the aforementioned argument on the probable effects of privatisation on the transport sector is again well illustrated. Large urban areas exist in UK, but it is not accompanied by equivalent employment either in industrial or transport activities.
[Insert Figure 8 about here]
4.6 Balanced vs. Unbalanced Modal Splits: A Synthesis
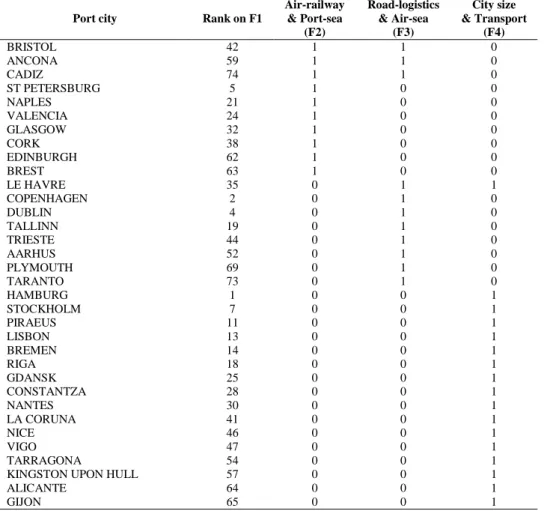
A possible method to go beyond the different oppositions is to evaluate the degree to which some port cities show a balanced profile rather than a specialization. For each factor, port cities for which the contribution is less than 0.1% to at least one factor, have been considered equilibrate between the opposing trends (Table 4).
One striking result is that among those 34 port cities, 28 are remotely located from the „heartland‟ of the continent. The other cities can be said to have successfully “resisted” to specialization, such as Le Havre, Trieste (road-logistics & air-sea), Hamburg, Bremen, Nice (city size & transport), and Valencia (air-railway and port-sea). Among the 42 “specialized” port cities which were excluded from the table, 19 are located around the heartland, of which the main European ports (Rotterdam, Antwerp,
Genoa, Barcelona…). It means that the core-periphery pattern has a strong effect on the European gateways, in terms of intermodal potentials. Although this spatial „rule‟ is not perfect, it confirms that the distance between a port city and a core region is a major component of its economic diversity and self-development (Fujita and Mori, op. Cit.). Another explanation is that remote port cities have been forced to develop a wider and more balanced variety of transport functions, due to the physical constraints and the spatial discontinuities.
[Insert Table 4 about here]
5. CONCLUSION
This paper has proposed an alternative approach to intermodalism, through the measurement of transport employment among 76 European port cities. It raises several issues such as the different contexts and evolutions of the port cities. On one side, the research is successful because the results provided by the new data are not contradicting our empirical knowledge of ports and port cities in Europe. Thus, the measurement of employment using a European-wide database on companies, though it is not perfect due to the arbitrary methodology, notably for companies operating in more than one activity, is fruitful in many ways, and allows getting a new geographical perspective of European port-city relationships.
On the other side, this research brings new evidence to the wider study field of intermodalism. Although the methodology cannot fully demonstrate the technical integration among different transport modes, it shows an estimation of intermodal potentials within European port cities. Among the observed trends, there is no strong interaction between different modes, such as between air and maritime transport.
Transport modes of the same „family‟ (e.g., freight transport and passenger transport) are better combined through the principal components. Only less significant factors show some interaction, such as between road and logistics, or between air and sea traffics. Thus, we have in Europe a modal specialization of transportation nodes rather than an effective combination, as hinted by Hayuth (1987) in his pioneer works on intermodalism.
In the end, results all point at the separation between gateways and central places. On one hand, the hierarchy of logistics, the trends of air-rail transport, road-logistics, and city size could apply to “anycity” (Lee and Ducruet 2006). On the other hand, trends of port-sea specialisation, air-sea freight, and transport employment specialisation reveal the specific dimension of the port cities. Not only this distinction is verified for the first time through quantitative measurements on a continental scale, but also it is matched with a classical understanding of the European territory. From a very deterministic point of view, it could be argued that the degree and variety of intermodalism at port cities are diminished by the European core-periphery pattern and its lock-in effects. It would mean that apart few exceptions, European port cities are condemned to specialise in a narrow set of functions based on freight transport while inland cities keep on widening their economic diversity and attractiveness, based on passengers. It may explain why some port cities face difficulties while they strive to develop their attractiveness for high-skilled workers and more sophisticated economic functions.
From a more optimistic perspective, it can be argued that the different specialisations of cities are a means to avoid concentrating all activities in a small set of multifunctional hubs, like in Asia. In order to give more reality to this theory, more voluntarism is needed from the European policies, by giving extra incentives for investing in peripheral areas, while valuing the diversity of sub-regional systems and avoiding excessive concentration at transport nodes. Further research can be conducted from the
same data by, for example, redistributing employment according to intermodal – rather than modal – categories, since many companies operate in more than one transport mode simultaneously. This would probably help understanding better the factors underlying the distinction between modal cities and intermodal cities.
REFERENCES
Banister, D. (1995) Transport and Urban Development, Alexandrine Press, Oxford. Barzman, J. and James, E. (2004) Speed Freaks and Sloths: Debates on New
Transportation Connections in Le Havre (1840s to Today), in Dienel, H.-L. (ed), Unconnected Transport Networks: European Intermodal Traffic Junctions 1800-2000, Campus Verlag, Frankfurt/New York, pp. 101–137.
Benacchio, M., Ferrari, C., Haralambides, H.E. and Musso, E. (2001) „On the Economic Impact of Ports: Local vs. National Costs and Benefits‟, World Conference on Transport Research, Seoul Conference, July 22-27.
Bird, J. (1973) „Of central places, cities and seaports‟, Geography, Vol. 58, pp. 105–118. Bird, J. (1977) Centrality and Cities, Routledge Direct Editions, London.
Bontekoning, Y.M., Macharis, C. and Trip, J.J. (2004) „Is a new applied transportation research field emerging? A review of intermodal rail-track freight transport literature‟, Transportation Research Part A, Vol. 38, No 1, pp. 1–34.
Brocard, M. (1994) „Deux villes frontières portuaires: Le Havre et Southampton‟, La
Revue d’Ici, No 11, pp. 8–12.
Brunet, R. (1989) Les Villes ‘Européennes’, La Documentation Française, Paris.
Charlier, J.J. and Ridolfi, G. (1994) „Intermodal transportation in Europe: of modes, corridors and nodes‟, Maritime Policy and Management, Vol. 21, No 3, pp. 237– 250.
Dogan, M. (1988) Giant Cities as Maritime Gateways, in Dogan, M. and Kasarda, J.D. (eds), The Metropolis Era (1) A World of Giant Cities, S.A.G.E. Publications, London, pp. 30–55.
Ducruet, C. (2004) Port Cities, Laboratories of Globalization, Unpublished PhD in Geography, Le Havre University, France.
Ducruet, C. (2005) „Approche comparée du développement des villes-ports à l‟échelle mondiale: problèmes théoriques et méthodologiques‟, Cahiers Scientifiques du
Transport, Vol. 48, pp. 59–79.
Ducruet, C. (2006) „Port-city relationships in Europe and Asia‟, Journal of International
Logistics and Trade, Vol. 4, pp. 13–35.
Ducruet, C. and Jeong, O. (2005) European Port-city Interface and its Asian Application, Korea Research Institute for Human Settlements, Anyang.
Ducruet, C., Joly, O. and Martell, H. (2007) Air-sea Linkages in European Port Cities, in Fredouet, C.H. and Rimmer, P.J. (eds), International Transport and Logistics: East
Ducruet, C. and Lee, S.W. (2006) „Frontline soldiers of globalization: port-city evolution and regional competition‟, Geojournal, Vol. 67, No 2, pp. 107–122.
ECMT (2003) Terminology on Combined Transport, OECD, Paris.
Frémont, A. and Ducruet, C. (2002) „Activités et métiers du transport: Le Havre et Southampton‟, Etudes Normandes, Vol. 1, pp. 25–36.
Frémont, A. and Ducruet, C. (2005) „The emergence of a mega port, from the local to the global, the case of Busan‟, Tijdschrift voor Econ. En Soc. Geografie, Vol. 96, No 4, pp. 421–432.
Fujita, M. and Mori, T. (1996) „The role of ports in the making of major cities: self-agglomeration and hub-effect‟, Journal of Development Economics, Vol. 49, No 1, pp. 93–120.
Goetz, A.R. and Rodrigue, J.P. (1999) „Transportation terminals: new perspectives‟,
Journal of Transport Geography, Vol. 7, No 4, pp 237–240.
Gordon, D.L.A. (1997) „Managing the changing political environment in urban waterfront redevelopment‟, Urban Studies, Vol. 34, No 1, pp. 61–83.
Goss, R.O. (1990) „Economic policies and seaports (1) The economic functions of seaports‟, Maritime Policy and Management, Vol. 17, No 3, pp 207–219.
Gripaios,R. (1999) „Ports and their influence on local economies: a UK perspective‟, The
Dock and Harbour Authority, Vol. 79, pp. 235–241.
Gripaios, P. and Gripaios, R. (1995) „The impact of a port on its local economy: the case of Plymouth‟, Maritime Policy and Management, Vol. 22, No 1, pp. 13–23.
Gutmann, M.P. (1986) „The dynamics of urban decline in the late Middle Ages and early modern times: economic response and social effects‟, 9th
International Economic History Congress, Bern, International Economic History Association, p. 36.
Hayuth, Y. (1987) Intermodality: Concept and Practice, Lloyd‟s of London Press, London.
Helders, S. (2005) The World Gazetteer, http://www.world-gazetteer.com/home.htm Hoyle, B.S. (2000) „Global and local change on the port-city waterfront‟, The
Geographical Review, Vol. 90, No 3, pp. 395–417.
Joly, O. and Martell, H. (2003) „Infrastructure benchmarks for European container ports‟, in: Regional Cooperation and Economic Integration, 4th Inha & Le Havre International Conference, October 8-9, Inha University, Incheon, Republic of Korea. pp. 147–154.
Keeling, D.J. (1995) Transport and the World City Paradigm, in Knox, P.L. and Taylor, P.J. (eds), World Cities in a World System, Cambridge University Press, Cambridge, pp. 115–129.
Keller, P. (2004) Intermodality of Network Points: the Planner’s View, in Dienel, H.-L. (ed), Unconnected Transport Networks: European Intermodal Traffic Junctions
1800-2000, Campus Verlag, Frankfurt/New York, pp. 37–48.
Langen, P. de and Chouly, A. (2004) „Hinterland access regimes in seaports‟, European Journal of Transport and Infrastructure Research, Vol. 4, No 4, pp. 361–380.
Lawton, R. and Lee, R. (2002) Port Development and the Demographic Dynamics of
European Urbanization, in Lawton, R. and Lee, R. (eds), Population and Society in Western European Port Cities, c. 1650-1939, Liverpool University Press, Liverpool,
pp. 1–36.
Lee, S.W. (2005) Interaction Between City and Port in Asian Hub Port Cities, Unpublished PhD in Urban Planning, Seoul National University.
Lee, S.W. and Ducruet, C. (2006) „Waterfront redevelopment and territorial integration in Le Havre (France) and Southampton (UK): implications for Busan, Korea‟, Ocean
Policy Research, Vol. 21, No 2, pp. 127–156.
Lee, S.W. and Kim, C.H. (2006) „Performance evaluation of Asian port distriparks using factor analysis‟, Ocean Policy Research, Vol. 21, No 1, pp. 52–82.
Lee, S.W., Song, D.W. and Ducruet, C. (2007) „A tale of Asia‟s world ports: the spatial evolution in global hub port cities‟, Geoforum (forthcoming).
Lever, W.F. (1995) „Regional economic growth and port activities in European cities‟, in
Portes Océanes et Développement des Territoires Intérieurs, 5th International Conference Cities and Ports, International Association Cities and Ports, Dakar, pp. 309–316.
Lloyd‟s List (2005) Lloyd’s Ports of the World 2004, Informa, London.
Marshall, R. (2001) Waterfronts in Post-industrial Cities, Spon Press, New York.
Mc Calla, R.J., Slack, B. and Comtois, C. (2001) „Intermodal freight terminals: locality and industrial linkages‟, The Canadian Geographer, Vol. 45, No 3, pp 404–413. Mc Calla, R., Slack, B. and Comtois, C. (2004) „Dealing with globalisation at the regional
and local levels: the case of contemporary containerisation‟, The Canadian
Geographer, Vol. 48, No 4, pp. 473–487.
Mc Gee, T. (1967) The Southeast Asian City: a Social Geography of the Primate Cities, G. Bell & Sons Ltd., London.
Merger, M. (2004) Inner Ports and Railway Networks in France or the ‘History of a
Divorce’ (1830-1914), in Dienel, H.-L. (ed), Unconnected Transport Networks: European Intermodal Traffic Junctions 1800-2000, Campus Verlag, Frankfurt/New
York, pp. 87–99.
Moriconi-Ebrard, F. (1994) Geopolis: Pour Comparer les Villes du Monde, Anthropos, Paris.
Musso, E., Benacchio, M. and Ferrari, C. (2000) „Ports and employment in port cities‟,
International Journal of Maritime Economics, Vol. 2, No 4, pp. 283–312.
Nagpaul, P.S. (2005) Guide to Advanced Data Analysis Using IDAMS Software, UNESCO: http://www.unesco.org/webworld/idams/advguide/TOC.htm
O' Connor, K. (1989) „Australian ports, metropolitan areas and trade-related services‟,
Australian Geographer, Vol. 20, No 2, pp. 167–172.
Pumain, D. and Saint-Julien, T. (1976) „Fonctions et hiérarchies des villes françaises‟,
Annales de Géographie, Vol. 470, pp. 385–440.
Robinson, R. (2002) „Ports as elements in value-driven chain systems: the new paradigm‟,
Rodrigue, J.P. (2003) „Maritime transportation and the port authority of New York and New Jersey: global changes, regional gains and local pains‟, in Maritime Transport,
Globalisation, Regional Integration and Territorial Development, June 5th, Le Havre.
Rozenblat, C. (2004) Les Villes Portuaires en Europe, Analyse Comparative, CNRS, Montpellier.
Rozenblat, C. and Cicille, P. (2003) Les Villes Européennes: Analyse Comparative, Maison de la Géographie, Montpellier.
Slack, B. (1989) „Port services, ports and the urban hierarchy‟, Tijdschrift voor Econ. En
Soc.Geografie, Vol. 80, No 4, pp. 236–243.
Stern, E. and Hayuth, Y. (1984) Developmental Effects of Geopolitically Located Ports, in Hoyle, B.S. and Hilling, D. (eds), Seaport Systems and Spatial Change, John Wiley and Sons, Chichester, pp. 239–249.
Tongzon, J. (1995) „Determinants of port performance and efficiency‟, Transportation
Research Part A, Vol. 29, No 3, pp. 245–252.
Trafic Aéroportuaire 2004: Le Palmarès Mondial, Aéroports Magazine, December.
Vallega, A. (1983) Nodalité et Centralité Face à la Multimodalité: Éléments pour un
Relais entre Théorie Régionale et Théorie des Transports, in Muscara, C. and Poli,
C. (eds), Transport Geography Facing Geography, Dipartimento di Pianificazione Territoriale e Urbanistica, Roma, pp. 69–88.
van Klink, H.A. and van den Berg, G.C. (1998) „Gateways and intermodalism‟, Journal
Table 1: Distribution of transport employment by activities in the port cities Detailed activities Aggregated activities Total
employees % total
Air charter services
AIR TRANSPORT 225,177 19.5 Air transport services, passengers and freight
Air services, specialised
Aircraft hire and rental services, air taxis Airport administration
Airport equipment Airport services
Cargo confirming and inspection services
LOGISTICS &
WAREHOUSING 181,400 15.7 Packaging and crating services for transportation
Pallets and freight containers Storage services for liquids Warehouse services, specialised Warehouses, cold storage Warehouses, storage sites
Warehousing and distribution logistical services, international Haulage and storage of hazardous materials
ROAD TRANSPORT 167,599 14.5 Road haulage, bulk
Road haulage, tanker Road haulage, part loads
Road transport services classified by type of freight Port and harbour administration
PORT SERVICES 139,651 12.1 Stevedoring, harbour and dock services, ship attendance
Tug, salvage and offshore shipping services Shipping services, tanker
Furniture, ship Rail transport services
RAIL TRANSPORT 178,270 15.4 Railway administration
Shipping and forwarding agents FORWARDING 78,805 6.8 Shipping services, passenger and freight
SEA & RIVER
TRANSPORT 183,964 16.0 Ship classification
Ship registration
Inland waterway transport services Ferry services
Ships, boats and yachts
TOTAL 1,154,866 100.0
Table 2: Regional distribution of variables (Unit: %) REGION Scan d in av ia / B altic B ritis h I sle s No rth west E u ro p e W est M ed . / Ib er ian Pen in su la E ast M ed . / Bl ac k Sea T OT AL
Number of port cities 15 16 11 26 8 76
Railway 52.0 8.7 7.1 21.8 10.4 100.0
Road 43.2 8.5 22.0 22.5 3.9 100.0
Port 54.6 6.6 17.7 10.6 10.4 100.0
Air 43.6 9.5 30.4 13.1 3.3 100.0
Sea & river 36.3 7.7 46.4 7.9 1.7 100.0
Forwarding 28.2 13.9 36.9 15.9 5.1 100.0
Logistics & warehousing 48.3 12.9 20.7 12.9 5.3 100.0
Population 18.5 28.1 14.0 33.0 6.5 100.0
Air tonnage 13.3 33.1 24.7 7.0 21.9 100.0
Port tonnage 16.4 12.8 39.3 21.9 9.6 100.0
Source: calculated from Kompass
Table 3: Major trends
F1 F2 F3 F4 Eigenvalues 5.88 1.44 0.62 0.57 Cumulated variance (%) 58.83 73.20 79.41 85.15 Contribution (%) RAILWAY 11.22 - 3.87 0.58 - 2.43 ROAD 12.23 0.28 - 22.58 5.40 PORT 10.23 13.54 0.28 - 10.00 AIR 11.03 - 8.37 - 0.59 - 12.23
SEA & RIVER 12.65 1.74 0.09 - 8.77
FORWARDING 13.13 1.09 - 1.79 0.59
LOGISTICS & WAREHOUSING 12.87 0.53 - 6.23 1.79
POPULATION 8.54 - 6.61 2.96 53.59
AIR TONNAGE 4.47 - 31.42 25.90 - 2.03
PORT TONNAGE 3.62 32.56 38.99 3.17
Table 4: Types of intermodalism at selected European port cities
Port city Rank on F1
Air-railway & Port-sea (F2) Road-logistics & Air-sea (F3) City size & Transport (F4) BRISTOL 42 1 1 0 ANCONA 59 1 1 0 CADIZ 74 1 1 0 ST PETERSBURG 5 1 0 0 NAPLES 21 1 0 0 VALENCIA 24 1 0 0 GLASGOW 32 1 0 0 CORK 38 1 0 0 EDINBURGH 62 1 0 0 BREST 63 1 0 0 LE HAVRE 35 0 1 1 COPENHAGEN 2 0 1 0 DUBLIN 4 0 1 0 TALLINN 19 0 1 0 TRIESTE 44 0 1 0 AARHUS 52 0 1 0 PLYMOUTH 69 0 1 0 TARANTO 73 0 1 0 HAMBURG 1 0 0 1 STOCKHOLM 7 0 0 1 PIRAEUS 11 0 0 1 LISBON 13 0 0 1 BREMEN 14 0 0 1 RIGA 18 0 0 1 GDANSK 25 0 0 1 CONSTANTZA 28 0 0 1 NANTES 30 0 0 1 LA CORUNA 41 0 0 1 NICE 46 0 0 1 VIGO 47 0 0 1 TARRAGONA 54 0 0 1
KINGSTON UPON HULL 57 0 0 1
ALICANTE 64 0 0 1
Figure 1: Comparison of three main continental hinterlands of seaports
Figure 2: The distribution of transport and passenger-related employment
Source: adapted from Kompass
Figure 3: Matrix of transport employment distribution in the port cities (%)
Source: calculated from Kompass
Figure 4: Graph of major correlations among variables*
N.B. Air and port tonnages are excluded due to average correlations lower than 0.5
Figure 6: Port gateways vs. central places
Appendix: Database on employment, population and traffics Po rt c it y R A IL WA Y R OA D POR T A IR S E A & R IV E R FOR WA R D IN G L OG IS T IC S & WA R E HO U S IN G POPU L A T ION (0 0 0 s) 2 0 0 5 A IR T ON N A GE 2 0 0 3 POR T T ON N A GE 2 0 0 3 AALBORG 123 852 99 257 249 192 597 122 1229 2651894 AARHUS 33 325 287 29 273 371 165 226 1961 10141000 ABERDEEN 0 489 2055 416 961 180 724 183 3997 4150435 ALICANTE 111 478 0 861 111 8 483 428 5849 3367046 AMSTERDAM 4758 4218 1349 44865 674 4185 5554 1188 1353760 65461000 ANCONA 7 795 278 71 60 198 149 100 5469 9574807 ANTWERPEN 232 2530 3556 375 2948 3150 7513 933 4903 142874512 BARCELONA 8382 10447 1046 1534 773 1838 5677 4973 76173 35512073 BARI 882 983 522 131 34 217 110 303 3740 3608480 BELFAST 1762 503 310 1126 391 496 255 585 42116 17057000 BERGEN 59 373 487 745 3146 145 260 213 9958 97662524 BILBAO 474 1210 524 144 648 130 2345 1120 3826 29010145 BORDEAUX 10746 6079 337 405 232 885 1491 971 15592 8394219 BREMEN-BREMERHAVEN 3670 5259 2744 1419 3521 1813 6399 1001 2237 48973000 BREST 0 541 292 96 144 44 389 213 1917 2368397 BRISTOL 12 1069 342 28 30 1109 654 616 5279 11439000 CADIZ 0 28 25 0 5 54 75 407 146 4758407 CARDIFF 0 287 0 5 35 72 87 720 3292 2287000 CARTAGENA 0 82 6 0 6 6 30 201 74 21300792 CASTELLO 0 2392 6 21 39 87 68 290 0 9984994 CATANIA 11 495 16 1 71 91 405 852 12354 2636778 CONSTANTZA 61 1872 4786 22 727 680 2685 303 281 40524000 COPENHAGEN 3040 5361 43662 17249 33396 1255 5109 2366 379037 7197000 CORK 111 882 249 413 191 711 1838 188 7114 9500000 DUBLIN 10101 7372 3772 14981 6588 3759 7319 1024 133871 23500000 EDINBURGH 4 46 116 19 58 17 500 696 53281 41607000 GDANSK 12 1262 2306 1168 1072 774 2378 867 1954 21293000 GENOA 600 798 3320 495 1858 454 1502 692 2813 54680994 GIJON 330 242 510 0 38 47 137 285 484 19165080 GLASGOW 41 1209 344 148 307 353 2209 1379 5791 9214000 GOTENBURGH 2435 2879 8433 1382 5345 1006 3211 786 58976 33300000 HAMBURG 3838 10029 9276 19583 64561 11045 9666 3278 35968 106300000 HELSINKI 26137 31159 1005 21034 3459 3746 12177 1215 88140 9304898 JERSEY - ST HELIER 0 3 5 0 0 1 21 28 5680 552539 KIEL 49 157 131 362 111 111 95 235 27200 3049000 KINGSTON UPON HULL 9 593 98 19 307 238 353 302 130 10298000 LA CORUNA 111 1959 537 184 114 50 1203 387 703 12659350 LE HAVRE 11 940 2963 9 1403 2049 886 254 133 71933680 LEIXOES - PORTO 1801 740 310 105 312 976 398 1218 28140 12647541 LISBON 12732 3059 2041 17085 1598 1552 1351 2613 95767 12154815 LIVERPOOL 1005 411 59 37 1383 495 810 3562 24253 31753000 LONDON 2278 1143 859 3125 2688 3082 6725 11327 1736563 5100000
MALAGA 111 1141 0 111 111 65 979 843 11318 2292703 MALMO 36 1925 270 687 505 627 530 598 28504 7619000 MARSEILLES 1300 2656 1442 1047 3000 3702 1162 1573 53547 95600000 NANTES 3 4170 455 1106 253 2404 963 765 10589 3104071 NAPLES 1368 2490 2621 794 3146 573 102 3770 6200 15023374 NEWCASTLE UPON TYNE 20 335 123 799 132 64 630 1428 4089 2763000 NICE 190 971 30 1276 84 238 137 908 15315 611092 OSLO 2291 4773 3161 12982 6566 1922 30104 808 72688 5960000 OSTENDE 5 271 118 24 10 14 43 69 78066 6238731 PALERMO 0 314 58 150 25 21 27 987 5372 4906177 PALMA MAJ 111 308 3 2293 466 0 499 475 22358 5774675 PALMAS CAN IS 111 235 360 860 111 136 459 621 43307 14274491 PIRAEUS - ATHENS 17428 1506 3887 6383 1697 1840 5286 3231 109741 16318000 PLYMOUTH 175 15 100 88 183 8 60 247 68 2053000 RIGA 11658 3724 4180 285 488 2664 7478 843 5209 21721700 ROSTOCK 0 146 923 15 560 18 448 205 3424 21600000 ROTTERDAM-EUROPORT 101 5166 2603 457 8710 3163 4466 3328 230 327796000 ROUEN 0 7124 946 49 153 877 1231 535 38 22000000 SANTANDER 0 1022 381 89 203 374 308 229 40 5374037 SEVILLA 111 1281 227 275 267 191 825 1312 5287 4834657 SOUTHAMPTON 3 252 675 16 406 147 352 764 322 34774000 ST PETERSBURG 29469 6797 3159 683 2625 3898 3187 4784 26045 41309200 STOCKHOLM 12656 15967 397 39762 1295 1770 17713 1692 131355 5420000 SZCZECIN 1490 1849 4896 547 2317 2083 2286 505 340 12253000 TALLINN 3196 1946 2083 1164 3274 1583 1161 394 4541 37632800 TARANTO 4 108 244 0 8 10 129 255 0 36833652 TARRAGONA 111 675 403 111 111 13 758 357 4 29023633 TEES 0 933 67 14 46 163 601 675 943 53800000 THESSALONIKI 0 247 681 6 30 269 296 829 1211639 14329553 TRIESTE 4 891 617 135 130 522 482 201 901 47173863 VALENCIA 126 1777 351 1554 349 600 1041 1740 11776 35332817 VALLETTA 0 8 59 6 195 186 69 258 12925 2352614 VENICE 112 776 3376 684 343 254 396 259 11222 28176203 VIGO 111 429 68 111 115 125 1582 419 1137 4438633