The Eco-Indicator 98
LCA Methodology
LCA Methodology
The Eco-Indicator 98 Explained
~ M a r k G o e d k o o p , -'Patrick H o f s t e t t e r , 3Ruedi M i i l l e r - W e n k , ~Renilde S p r i e m s m a
*PR6 C o n s u l t a n t s , Plotterweg 12, 3821 BB-Amersfoort, The Netherlands; email: G o e d k o o p @ p r e . n l , URL: www.pre.nl : E T H - U N S , E T H Z e n t r u m H A D F1, C H 8092 Zurich, email: [email protected]
3 IWC)-HSG, Tigerbergstrasse 2, C H 9000 St. Gallen, email: R u e d i . m u e l l e r - w e n k @ I W O . U N I S G . C H
Abstract
The Eco-Indicator 98 project aims at a complete revision of the Eco-lndicator 95 methodology. Like its predecessor, the target is to develop single scores for designers. The method now in- cludes resources and land use. Important improvements are: the use of fate analysis, tile much better definition of the damage categories concerned with human health and ecosystem health, using the PAF (Potentially Affected Fraction) and DALY (Dis- ability Adjusted Life Years) concept, and a completely new ap- proach to modelling resources and land use. Perhaps the most fundamental improvement is the management system for value choices. The result of this management system is that there will be three instead of one indicator. Each version is based on a different cultural perspective. The method should be updated continuously. It is proposed to set up an independent organisa- tion to guide this future development.
Keywords: DALY concept; damage categories; Disability Ad- justed Life Years (DALY); Eco-Indicator 98; ecosystem health; fate analysis; human health; land use; management system for value choices; modelling resources and land use; PAF concept; Potentially Affected Fraction (PAF); resources, supply of; safe- guard subjects
1 Introduction
This p a p e r gives an overview of the Eco-Indicator 98 meth- o d o l o g y that is currently being developed by an international g r o u p o f L C A and e n v i r o n m e n t a l experts under commis- sion o f the Dutch M i n i s t r y for Environment. ( V R O M ) with c o - f i n a n c i n g by the Priority P r o g r a m m e E n v i r o n m e n t spon- s o r e d by the Swiss N a t i o n a l Science F o u n d a t i o n . The Eco- I n d i c a t o r 98 project aims to review and improve the Eco- I n d i c a t o r 95 i m p a c t assessment m e t h o d o l o g y (GOEDKOOP, 1995). T h e aim is the same, to develop a m e t h o d to express the total e n v i r o n m e n t a l burden of a process in a single score. T h e m e t h o d is intended for internal use in companies, espe- cially for p r o d u c t d e v e l o p m e n t applications. If the Eco-indi- c a t o r 98 is used in an L C A a p p l i c a t i o n , which has to be in a c c o r d a n c e to the u p c o m i n g ISO 14042, then the assess- m e n t result s h o u l d be restricted to internal use.
Before the end of 1998, a detailed m e t h o d o l o g y r e p o r t will be m a d e available. This r e p o r t is followed by a " M a n u a l for
Designers" that will contain a new list o f about 150 Stand- ard Eco-lndicator scores for c o m m o n l y used materials and processes, as well as a description o f the application and the limitations of the method. As the d e v e l o p m e n t is in the final stages of completion, but not yet c o m p l e t e d , the final meth- odology description may differ f r o m this paper.
The methodology presented here is the result of the work of many specialists. The contributors are all listed in the annexe.
1.1 The Eco we indicate
The development of an E c o - I n d i c a t o r m e t h o d o l o g y is not possible without a clear definition o f the term environment. In our society, " e n v i r o n m e n t " is used in m a n y different con- texts. In fact, the w o r d is a mental c o n s t r u c t with which we mean a very large range o f effects.
After considerable studies on possible definitions, we define the term environment as:
.... a set o f biological, physical a n d chemical parameters influenced by man, that are conditions to the functioning o f man and nature. These conditions include human health, ecosystem health and sufficient supply o f resource.
Other definitions are also possible, but lead to a different methodology. For instance, we could have substituted re- sources for "material welfare", but we have chosen to con- sider material welfare as an issue for economists.
F r o m this definition, we conclude t h a t there are basically three items that need protection:
9 H u m a n health 9 Ecosystem health 9 The resource base
We n a m e d these three items d a m a g e categories. Other terms could have been Safeguard Subjects, as is done by (SVEEN et al., 1992), Endpoints, such as is d o n e in the current ISO discussion, or the very objective t e r m C h a n g e Categories, as we should first calculate the changes a n d then attach a posi- tive o r negative value to them.
352
Int. J. LCA 3 (6) 352 - 360 (1998)L C A M e t h o d o l o g y T h e E c o - I n d i c a t o r 9 8
1.2 "Less is better" or "only above threshold"
Traditionally, LCA is based on the "less is better" approach. This means impacts are assessed on their potential effect and not on their actual effects. Calculating actual effects is possible when more information is available, for instance, on b a c k g r o u n d concentration or exposure. Several studies have shown that the site dependent factors are very impor- tant if we w a n t to base our assessment on real damages (PoT- TING et al., 1998).
The problem is that temporal and spatial information is lack- ing in almost all LCAs. This means that if we w a n t to assess the real damage caused by a product, we should assess every emission (i.e. from every power plant of a power grid), tak- ing into account the local and temporal characteristics. This would increase the d a t a a m o u n t beyond practicable limits. O u r solution is that we develop a model for assessing the average d a m a g e in Europe. This means that instead of look- ing into specific conditions for each emission, we look at the average conditions in a region as large as Europe. This also means that we assume that every emission is diluted instantly all over Europe. This c o m p r o m i s e is a coarse a p p r o x i m a - tion, as we are aware that the differences in Europe are ex- tremely big. However, w i t h o u t this "solution", it is pres- ently impossible to use the damage modelling approach. Although we develop this methodology especially for Eu- rope, there are no fundamental reasons that would restrict the applicability to other regions. Preliminary studies have been made on adapting the method on Japan and Colombia (GoMEz, 1998). If we could achieve developing models for a dozen regions in the world, we could assess each industrial process in its own region, taking into account the specific sensitivities of the environment on the continental scale. Later, the method could be refined and adapted to smaller scales.
Ultimately, it must be possible to combine the LCA approach with very site-specific conditions.
2 T h e C o r e C o n c e p t o f t h e D a m a g e A p p r o a c h The Eco-Indicator score should s o m e h o w represent the per- ceived seriousness of the e n v i r o n m e n t a l load o f a product. Perceived seriousness is subjective by definition, as the seri- ousness of something is very m u c h dependent on values. The p r o b l e m is that natural science cannot determine w h a t the term "seriousness" means. This does not mean there is no role for natural science. On the contrary, the role is very important. We need natural science to be able to calculate the relation between the impacts from a p r o d u c t lifecycle and the damages resulting from this.
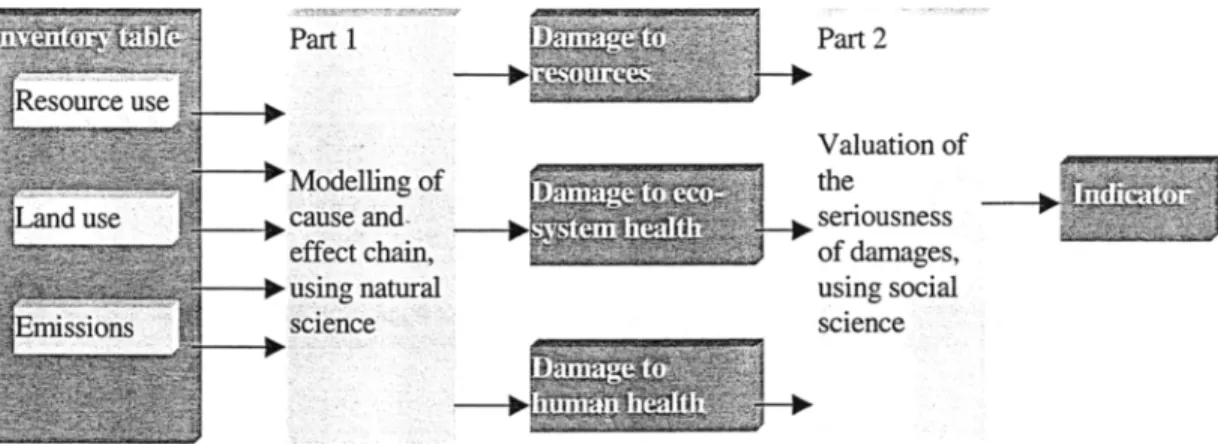
The Eco-Indicator m e t h o d o l o g y thus consists o f two parts
(--~ Fig.
1 ):1. N a t u r a l science is used to calculate changes in the envi- ronment caused by the environmental flows from a prod- uct lifecycle.
2. A weighting procedure is used to establish the serious- ness of these changes. In the text these changes are re- ferred to as damages.
The method is developed in a m o d u l a r way. Different value systems can be incorporated and it is possible to modify or replace the building blocks used in the natural science part. Although the first part of the modelling is d o m i n a t e d by natural science, it is also not free of subjectivity. In the de- sign of the modelling, we are c o n f r o n t e d with choices that have subjective elements. Instead of trying to suppress or
Fig. 1: The core concept of the Eco-Indicator 98 methodology. There are two parts. In the first part, the best available scientific information is used to calculate the average damages caused by an inventory table. In the second part, societal preferences are used to assess the seriousness of the damage
The Eco-Indicator 98
LCA Methodology
e l i m i n a t e the subjective elements, we try to M A N A G E them using m e t h o d s developed in social science.
3 Modelling the Damages
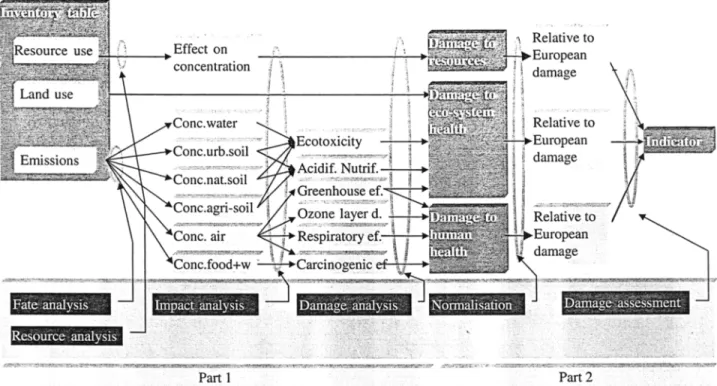
As e x p l a i n e d before, the first p a r t of the m e t h o d is to link the emissions, the land use and the resource e x t r a c t i o n s in an i n v e n t o r y table to potential damages. We use four differ- ent p r o c e d u r e s to establish this link:
1. Fate analysis, which establishes the relation between an emission (mass) and a t e m p o r a r y c o n c e n t r a t i o n increase 2. Resource analysis, which establishes the relation between a resource extraction and the effect on the concentrations 3. I m p a c t analysis, once we have established the concen- trations, we analyse to which extent a substance con- tributes to an i m p a c t
4. D a m a g e analysis, which establishes the relation between the i m p a c t categories and the d a m a g e to h u m a n health, ecosystem health and resources
Figure 2 gives an overview of the whole m e t h o d and shows the p o s i t i o n o f the four analysis types.
3.1 Fate analysis
An i m p o r t a n t feature, or rather a limitation, of the inven- tory table is the lack of spatial and temporal information. Lead emissions that occur in the raw material extraction phase are added to lead emissions that occur from electric- ity generation (in a usually large n u m b e r of power plants). Next they are a d d e d to emissions from leachates from the future d e c o m p o s i t i o n of p r o d u c t s in m a n y landfills over hundred or more years. This means we only k n o w the total quantity of an emission, w i t h o u t k n o w i n g when and where the emissions occur and w h a t the concentrations in the en- vironment are. The only limitation we make is that the emis- sions are supposed to be released within Europe.
In the Eco-lndicator 98 methodology, we use the European Uniform System for the Evaluation of Substances (EUSES: JAc;r:R et al., 1996) (--~ Fig. 3). This model is the follow-up of the USES model that was applied by (GuIN~:E et al., 1996). Unlike the earlier model, all defaults can be set by the user. Furthermore the system comes with a number of defaults that are accepted by the European Comnaission to be p r o p e r averages for the European environment.
EUSES is not really meant for LCA applications. This means that we had to find solutions for the following problems (SM~wNSMa, 1997):
Fig. 2" General representation of the methodology. The boxes below refer to procedures, the other boxes refer to (intermediate) results as they will be made explicit in the method
LCA Methodology
The Eco-Indicator 98
A fate model can calculate concentrations that are the result of a steady state flow. In the inventory table, only mass-loadings are specified. We solved this with an allo- cation p r o c e d u r e that translates the massloading into a t e m p o r a l c o n c e n t r a t i o n increase. This is another ap- proach then presented in (GuIN~E et al., 1996).
EUSES is m a d e for organic substances, and not for inor- ganic substances or dust. We found that the behaviour of heavy metals in air can best be described with meas- ured d e p o s i t i o n velocities. (Ho~sTEVrER, 1998)
EUSES uses three nested compartments, a local, a re- gional and a c o n t i n e n t a l scale. We use the regional scale. Normally, the regional scale is open. The wind and the runoff transfer emissions out of the regional scale. F o r LCA, such a transfer is not permitted as this would mean parts of the emissions get lost. This meant we have to minimise the w i n d speed and the runoff in the model. However, these artificial settings influence the inner w o r k - ings o f the model. Especially the build-up of heavy met- als in soil and w a t e r are distorted.
3.2 Resource analysis
In the E c o - l n d i c a t o r 98 methodology we only model min- eral resources and fossil fuels. The use of agricultural and silvicultural biotic resources and the mining of resources such as sand o r gravel, are considered to be adequately covered by the effects on land-use.
In the case of n o n - r e n e w a b l e resources (minerals and fossil fuels), it is clear that there is a limit to the resources. H o w - ever, it is also clear t h a t it is extremely difficult to determine how large the resources are, simply because industry does not explore new resources if the known resources can cover several decades; furthermore, the resource estimates are heav-
ily influenced by p o l i t i c a l c o n s i d e r a t i o n s (CaMBrH. and LAHERRERE, 1998). A n o t h e r obstacle is that the depletion of a single resource does not have to be a big p r o b l e m if this resource can be substituted by another resource.
Because of these p r o b l e m s , the Eco-Indicator 98 m e t h o d o l - ogy does not consider resource quantity, but resource qual- ity. We have chosen to take the average resource concentra- tion as the indicator for the resource quality. This means that the result of the resource analysis is very c o m p a r a b l e to the fate analysis, instead of modelling the increase of the concentration of pollutants, we model the decrease of the concentration of mineral resources.
In geo-statistic models, it is generally accepted that the dis- tribution of concentrations of mineral resources is log-nor- mal if we plot quantities against grade. This p h e n o m e n o n is sometimes referred to as Laski's law. Although real p r o o f for this relation is not easy to provide, an illustrative exam- ple for the case o f u r a n i u m is a v a i l a b l e from Deffeyes (DEFFEVES, 1964). Deffeyes also presents data on the distri- bution of other resources. This data, which is critically ana- lysed in (M0t.i.ER-W~:NK, 1998-1), forms the basis for the resource analysis.
3.3 I m p a c t analysis
For some, but not all, impact categories it is useful to in- clude an impact analysis step. The procedure is k n o w n in the LCA m e t h o d o l o g y as classification (grouping) and char- acterisation (addition using equivalence factors). The result is a n u m b e r of impact categories.
In other cases it a p p e a r s to be best to model the damages for individual substances directly, w i t h o u t using a characterisa- tion. O n l y in the case of greenhouse effect and ozone layer depletion it turns out to be useful to use equivalence factors.
The Eco-Indicator 98
LCA Methodology
However, to enhance the c o m p a t i b i l i t y of our m e t h o d with other LCIA m e t h o d s , we will present the values for the im- p a c t categories as an intermediate result. O n l y for eutro- p h i c a t i o n and acidification this specification is not possible as these effects c a n n o t be separated in d a m a g e modelling.
3.4 D a m a g e analysis
D a m a g e analysis is one of the most extensive parts of the methodology. It links the impact categories to the three d a m - age categories:
1 D a m a g e to h u m a n health 2 Damage to ecosystem health 3 Damage to resources
The process can at best be understood when we start with the description of the exact definition of the damage categories.
3.4.1 The h u m a n health d a m a g e category
We consider tile links between h u m a n health and emissions causing r e s p i r a t o r y effects or cancer, the ozone layer effect, and the greenhouse effect. We assume the links to other im- pact categories are of lower importance.
When we follow the cause and effect chain, we will see t h a t there are a large n u m b e r of health effects, i m p o r t a n t health damages are caused by carcinogenity and respiratory effects. All these effects cause a certain level of disability, p r o b a b l y ranging from a cough, to an a s t h m a attack, a period o f seri- ous suffering due to cancer o r even p r e m a t u r e death. If we w a n t to have a single i n d i c a t o r for h u m a n health we need to be able to weight these different disabilities. We have chosen to use the DALY (Disability Adjusted Life Years) scale, which has been developed by (MURRAY and LOeEZ, 1996) for the W H O and W o r l d b a n k . The original purpose was to have a tool to analyse the r a t i o n a l e of national health budgets. The core of the DALY system is a disability weighting scale. This scale has been developed in a n u m b e r o f panel sessions. The scale lists a b o u t 20 different disabilities on a scale be- tween 0 and 1 ( = death).
Example
Carcinogenic substances cause a number of deaths each year. In the DALY health scale, death has a disability rating of 1. If a type of cancer is on average fatal ten years prior to the normal life expectancy, we would count 10 lost life years for each case. This means that each case has a value of 10 DALY's.
During a summer smog period, many people have to be treated in hospital for a number of days. This type of treatment in a hospital has a rating of 0.392 on the DALY scale. If the hospital treatment lasts 0.01 years on average (3.65 days), each case would be weighted 0.004 DALY's.
With this system, we can calculate the number of Disability Adjusted Life Years if we k n o w h o w m a n y people in Europe are exposed to a b a c k g r o u n d c o n c e n t r a t i o n above threshold levels in air, drinking water and f o o d .
HOVSTETI"ER, who has studied the use of DALY's in LCA, supplies most data for r e s p i r a t o r y and carcinogenic effects. N e x t to this data, we use the p r o p o s a l of Frischknecht and Braunschweig (FRIscHKNECHT, 1998), tO include the effect of nuclear radiation. This i m p a c t c a t e g o r y can also be used to include the effects of ozone depletion.
Estimating the health effects of the greenhouse effect proves to be a very difficult matter, as there are large uncertainties as to the consequences of this effect. As a temporary solu- tion, we have based our findings on the ExternE project (ExterneE: MAYEItHOFEI~ et al., 1997).
3.4.2 The ecosystem health d a m a g e category
Eco-systems are very c o m p l e x , a n d it is very difficult to d e t e r m i n e all d a m a g e s i n f l i c t e d o n t h e m . An i m p o r t a n t difference with h u m a n h e a l t h is t h a t even if we could, we are not really c o n c e r n e d w i t h t h e i n d i v i d u a l organisnl, plant or animal. Tile species d i v e r s i t y is usually much m o r e o f a concern. This m e a n s w e c a n n o t use the DALY con- cept. Instead, we e x p r e s s the e c o s y s t e m d a m a g e as a per- c e n t a g e o f species t h a t a r e t h r e a t e n e d o r t h a t d i s a p p e a r from a given area.
We have looked for a p a r a m e t e r t h a t only describes tile threat to lower organism species such as algae, worms and plants. The assumption is that these are g o o d proxies for the total ecosystem health. The lower o r g a n i s m s are at the start of the food chain in all ecosystems. If their health is affected, all species will suffer.
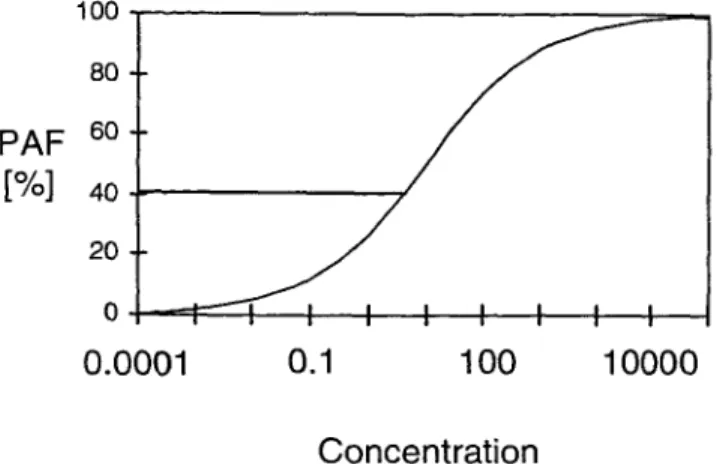
For ecotoxicity, we will use a m e t h o d recently developed by R I V M for the Dutch E n v i r o n m e n t a l O u t l o o k (MEENT and KLEP~ER, 1997). This m e t h o d d e t e r m i n e s the Potentially Af- fected Fraction (PAF) of species in relation to the concentra- tion of toxic substances. The PAF's are determined for the lower organisms, like w o r m s , algae and other lower organ- isms in soil or water. It can at best be described as a cumula- tive combination of N O E C values for a n u m b e r of species. The higher the concentration, the larger the number of spe- cies is affected. The PAF d a m a g e function has a typical shape as shown in Figure 4.
The steepness of the curve d e p e n d s on the background con- centration. However,.instead o f using the background con- centration, we determine a w o r k p o i n t on the vertical axis. This w o r k point is the total c o m b i n e d PAF o r COMBI-PAF in Europe.
The procedure to calculate e c o s y s t e m health damage can be described as follows:
LCA Methodology
The Eco-Indicator 98
PAF
[%]
100 8O 60 40 2O 00.0001
I • • 1
I
I
I
I
I
I
O. 1
1 O0
1 0 0 0 0
Concentration
Fig. 4: A logistic PAF-curve expressing the potential affected frac- tion of species at different concentrations of a substance
9 Determine the PAF function for each emission.
9 Determine the temporary, marginal increase of the con- centration from the fate model.
9 Determine the marginal damage from this increase using the slope of the PAF function at the workpoint. Being based on N O E C , A PAF does not necessarily pro- duce observable damage. Therefore, even a high PAF value of 5 0 % or even 9 0 % does not have to result in a really observable effect.
For Acidification and Nutrification, we cannot use the PAF concept directly, as the link between these impact categories and N O E C s for lower organisms is not a good proxy for damage. Instead, we will have to look at the effects of plants. Another problem is that we cannot use a N O E C for plants; instead we must look at the chance that a plant species still occurs in an area. This is called the Probability Of Occur- rence or P O O (WIERTZ, 1992). Perhaps surprisingly for the LCA community, it turns out that it is impossible to separate the damages caused by acidification and eutrophication in dam- age modelling. We can only establish a link between the P O O and the deposition of Ammonia, Sulphates and Nitrates, but we cannot see if plants disappear from nitrification or acidifi- cation. W h e n the P O O is plotted against the deposition of these substances, we get a similar, but inverse curve as in Fig- ure 4. A similar calculation is in principle also possible for a relation between P O O and C O 2 concentrations, it is yet how- ever unclear if sufficient reliable data will be available. To establish the P O O in relation to these effects, we can use one of the several plant d a t a bases. A particular difficulty is to weight the P O O and PAF result. We will have to make an assumption on c o m p a r a b l e damage levels expressed in re- ally threatened species and species affected by a toxic stress. For land use, we will use the percentage of plant species that are threatened as an indicator. (MOLLER-WENK, 1998- 2) and (KOLLNER, 1998) have shown that there are two ef-
fects w h e n land is converted. T h e species diversity on the land itself, but also the species diversity on the remaining land is influenced.
It is a c o m m o n l y accepted fact t h a t the species diversity in an area is not only a function of the area quality, but also on the area size. This means that the reduction or enlargement of natural areas in a region will directly influence the number of species in the w h o l e region.
In the LCA field, there is a debate w h e t h e r land-use changes or land o c c u p a t i o n should be modelled. We will do both. If land is t r a n s f o r m e d , the restoration time must be included. If land was already transformed, but is used for a year, we only c o u n t one year.
3.4.3 The resources damage category
The d a t a of DEFW'.YES (explained in the resource analysis) has been used by C h a p m a n a n d R o b e r t s (CHAI'.~IaN and ROBERTS, 1983) to develop an assessment p r o c e d u r e for the seriousness of resource depletion. They developed a method in which the energy needed to e x t r a c t a resource is analysed in relation to the concentration. The basic idea is that the energy requirement to extract a resource is ultimately the limiting factor for the resource availability. T h e y take into account t w o trends:
1 The increase in energy c o n s u m p t i o n due to the fact that resource concentration decreases
2 The decrease in energy c o n s u m p t i o n due to the expected considerable efficiency increases in mining techniques. In short, they state that, although there is a fundamental limit to the efficiency increase, the concentration decrease will con- tinue forever if we assume the log-normal distribution is cor- rect. This means that there will be an energy decrease for many decades to come for all minerals, followed by an energy in- crease due to the lowering of the concentrations.
MiJller-Wenk (MocLER-WENr(, 1998-1) has proposed to use the so-called surplus energy, that is the additional energy that is needed to compensate for the future decrease of concentra- tions. H e argues that it is not a p p r o p r i a t e to include the ex- pected efficiency increase, as this is never done in LCA. In our project, we intend to follow the a p p r o a c h of MOLLER- WErqK, this means that resource depletion is expressed as surplus energy, per kg extracted pure mineral or fossil fuel.
4 M o d e l l i n g
S u b j e c t i v i t y
In the previous chapter, we have shown h o w we can calcu- late the damage to the three damage categories human health, ecosystem health and resource quality. In this process, we
The Eco-Indicator 98
LCA Methodology
can use the best available natural science. However, as we i n d i c a t e d in the i n t r o d u c t i o n , we c a n n o t use natural science to d e t e r m i n e h o w serious this d a m a g e is perceived. Further- m o r e , we have experienced that the so called natural science p a r t is n o t free o f values either.
F o r instance, if we w a n t to assess the d a m a g e caused by c a r c i n o g e n i c substances, we will see t h a t there are 3 groups in the I A R C classification. G r o u p one contains the substances for which the carcinogenic effect is proven, while g r o u p 3 c o n t a i n s o n l y substances for which there is a suspicion that they are carcinogenic. The question of course is, which groups d o we take into account. If we follow the precautionary prin- ciple, we w o u l d include all groups. If we were very prag- m a t i c and we were to believe only in "hard scientific facts", we w o u l d p r o b a b l y only t a k e group 1 and 2.
This e x a m p l e can be c o m p l e m e n t e d by several other prob- lems we have run into during the d e v e l o p m e n t work. We have to m a k e suhjective choices and we must be a w a r e of this. O u r s o l u t i o n is not to stop thinking when we encoun- ter such a choice but to set up a m a n a g e m e n t system for the subjectivity in each step.
4.1 C u l t u r a l t h e o r y as a modelling tool for subjectivity H o f s t e t t e r (HoFSTETTER, 1 998) has a n a l y s e d the p r o b l e m o f m o d e l l i n g s u b j e c t i v i t y t h o r o u g h l y a n d he p r o p o s e s to use the C u l t u r a l T h e o r y (THoMeSON et al., 1990) to distin- guish five b a s i c value systems. T h o m p s o n derives these v a l u e s y s t e m s by l o o k i n g at the s t r e n g t h o f the relation p e o p l e h a v e w i t h their g r o u p a n d the degree an i n d i v i d u - al's life is c i r c u m s c r i b e d by e x t e r n a l l y i m p o s e d prescrip- t i o n s . T h e v i a b l e c o m b i n a t i o n s o f the p o s i t i o n o f each in- d i v i d u a l in this g r o u p - g r i d t y p o l o g y a n d their cultural bias are c a l l e d w a y o f life. T h e a s s u m p t i o n is t h a t these v i a b l e c o m b i n a t i o n s h a v e a large influence on the value system o f i n d i v i d u a l ' s a n d their g r o u p s .
These value systems have been used by several a u t h o r s in risk p e r c e p t i o n studies. Experiences show t h a t this distinc-
tion is very valuable in explaining peoples attitudes. Please note the theory does not say there are only five types of people. A l m o s t n o b o d y really conforms to the properties of a single group. People can switch between different attitudes dependent on their context.
HOFSTETTER proposes to use only the three perspectives ac- tively p a r t i c i p a t i n g in societal decision making
1. Individualists 2. Egalitarians 3. Hierarchists
The basic attitudes related to these value systems are sum- marised in Table 1.
W h e n we look at this table, we can see that the so called egalitarians w o u l d include all substances suspected to be carcinogenic, while for instance individualists would demand that there is strong evidence for carcinogenity in humans. The latter would include only group one of the carcino- genic substances in their decision s u p p o r t system. We have made similar assessments when we cncotmtered other sub- jective choices in the modelling.
4.2 Weighting
We intend to use a panel method to set the weights between the three d a m a g e categories. The p r o c e d u r e will consist of three steps. The first and third steps are based on panel ses- sions with small groups . The second step uses a written questionnaire for a large group. A more sophisticated three- step procedure suggested by (BRUNNEIq 1998) may be used in a next phase.
Earlier experiences (KoRTMAN et al., 1994) and (HOFSTETI'EI~.
in c h a p t e r 8 in BRAUNSCHWEI(; et al., 1996) show that the behaviour of each panel is very much determined by the basic value system a person is using. This is the second area where we will use cultural theory.
Table 1: Typical values in the three different perspectives (THOMPSON et al. 1990).
Egalitarian Individualist Hierarchist
Perception (myth) of nature Nature ephemeral Nature benign Nature perverse/tolerant Perception of human nature Born good, malleable Self-seeking Sinful
Perception of needs and Can manage needs, but not Can manage needs and Can manage resources, but resources resources resources not needs
Attitude to nature Attentive Laissez faire Regulatory Attitude towards humans Construct egalitarian society Channel rather then change Restrict behaviour Attitude towards resources Need reducing strategy Manage needs and resources Increase resources Attitude towards risk Risk aversive Risk seeking Risk accepting
LCA Methodology
The Eco-Indicator 98
We intend to specify the answers in the questionnaires ac- cording to these value systems. In order to do this, we will ask each panel m e m b e r a n u m b e r of additional questions to get i n f o r m a t i o n on their basic values. The result of t h e panel p r o c e d u r e is thus three sets of valuations, one for each value system.
The benefit of this a p p r o a c h is that we can specify the rela- tion between the value system and the result of the indicator methodology. Experiences with earlier value setting proce- dures suggest t h a t people t h a t adhere to a certain value sys- tem tend to agree in their opinions. This means that the un- certainty is relatively low within the same value system.
4.3 Three instead of one result
The use of cultural theory has wide implications for the meth- odology and the user. The most visible effect is that we will not have one result but three. We intend to develop the meth- odology in three different versions (HoFsTETTER, 1998):
1. In the individualist version, we will choose to include only p r o v e n cause effect relations, when we have the choice we will use the short-term perspective.
2. In tile hierarchical version we will also choose to include facts t h a t are backed up by scientific and political bodies with sufficient recognition. The hierarchical attitude is rather c o m m o n in the scientific community. For insid- ers: a nice e x a m p l e is the current debate in the SETAC and ISO discussions on LCIA.
3. In the egalitarian version, we will consistently use a pre- c a u t i o n a r y principle. We will try not to leave anything out and if in d o u b t we will include it and we will use the very long time perspective. The final weighting will be set according to the views of the egalitarians in the panel. It will be clear that this version is the most complete version, but it will also have the largest uncertainties. As a consequence, we will not have a single score for a m a - terial or process, but we will have three scores depending on the perspective. This m a y seem like a nuisance to the user, but it actually correctly reflects the fact that the judgement of e n v i r o n m e n t a l p r o b l e m s is not objective. By presenting three choices to the user, the user can choose the most ad- equate perspective. O f course it is possible to make an aver- age of the three perspectives. It is even possible to m a k e a weighted average, as there is data on the distribution of p e o - ple with a certain perspective for many European countries. However, one m u s t be a w a r e that the average has a r a t h e r limited meaning. It is the average of fundamentally different views. We t h i n k the best solution would be to present the results of any design alternative for the three perspectives. If all perspectives give the same conclusion, we know our an- swer is robust. If one of the perspectives is different, we can say that the a n s w e r depends on the perspective.
5 C o n c l u s i o n s a n d a P r o p o s a l
The new m e t h o d o l o g y introduces m a n y new concepts. The m o s t i m p o r t a n t innovations are:
The consistent use of cultural perspectives to m a n a g e subjectivity. Leading to three different indicators, depend- ing on the cultural perspective
9 The modelling of the cause and effect chain for all im- pact categories until the d a m a g e categories or endpoints 9 The modelling of resource depletion, using geostatistical
models
9 The modelling of land use, t a k i n g into account the ef- fects on the remaining area of land
9 The use of DALY and PAF a p p r o a c h e s for h u m a n and ecosystem health
9 The consistent development o f a panel procedure using a large panel
The proposed m e t h o d o l o g y is not perfect and never will be. There is a constant need for u p d a t i n g as our u n d e r s t a n d i n g of the damage modelling and o u r assessment of the serious- ness of the damages will c o n t i n u a l l y evolve. There is a need for a continuous i m p r o v e m e n t o f the methodology, and we hope to be able to develop new versions in future.
To guide this process, M. G o e d k o o p has t a k e n the initia- tive to set up an E c o - I n d i c a t o r Society. Industries, g o v e r n - ments a n d scientists s h o u l d steer a n d s u p p o r t this i n t e r n a - t i o n a l society a n d they s h o u l d d e v e l o p a p o l i c y for f u r t h e r d e v e l o p m e n t a n d for p u b l i c r e l a t i o n s , as it is very i m p o r - t a n t to clearly c o m m u n i c a t e t h e i n t e n d e d a p p l i c a t i o n o f the m e t h o d o l o g y : a tool for designers, n o t h i n g m o r e a n d n o t h i n g less.
6 R e f e r e n c e s
BRAUNSCHWEIG, A; FORSTER, R; HOFSTETTER, P; MOLLER-WENK, R.
(1996): Developments in LCA Valuation. IWOE Diskussions- beitrag Nr. 32, St. Gallen
BRUNNER, ST. (1998): Panel Methods and their Application for Weighting in LCA. UNS Working Paper for the Project Envi- ronmental Prioritising within the Framework of the Swiss Pri- ority Programme Environment; ETH Zurich
CHAPMAN, P.E; ROBERTS, F. (1983): Metal Resources and Energy. Butterworths Monographs in Materials
CAMBELL, C.J.; LAHERRERE, J.H. (1998): The End of Cheap Oil. Sci- entific American, March 1998, pp 60-65
DEFFEYrS, K. (1964): Uranium Distribution in Mined Deposits and in the Earth Crust. Department of Energy, Grand Junction Colo- rado; see also Scientific American 242, 1980, p 50
The Eco-Indicator 98
LCA Methodology
EUSES ( 1996): JAGER, D.T. et al.: EUSES the European Union Sys- tem for the Evaluation of Substances. National Institute of Pub- lic Health and the Environment (RIVM), The Netherlands; Avail- able from the European Chemicals Bureau (EC/JRC), Ispra, Italy ExternE (1997): Core project. Extension of the Accounting Frame- work; Final Report, Compiled by MAYERHOVER, P.; KREWI'I-s W.; FRIEDRICH, R. The European Commission, Contract JOS3-CT95- 0002 Stuttgart (available on www.ExternE.jrc.sp)
FRtSCHtZNECHT, R. (1998): Life Cycle Inventory Analysis for Deci- sion Making. Dissertation ETH Nr. 12599, ISBN 3-9520661-3- 3, ETH Zurich
GOEDKOOV, M.J. (1995): De Eco-lndicator 95. Final report; NOH report 9523; PRd Consultants; Amersfoort (NL); ISBN 90- 72130-77-4
GoMrz, J.D. ( 1998): Approach for the Use of the Eco-lndicator 98 Concept in Latin America. MSc Thesis; IHE; Delft
GUINf:E, J. et al. ( 1996): LCA Impact Assessment of Toxic Releases. Product Policy Report 1996/21, Ministry of Environment (VROM), The Hague
HOFSTE'/-rER, P. (1998): Perspectives in Life Cycle Impact Assess- ment; A Structured Approach to Combine Models of the Tecbnosphere, Ecosphere and Valuesphere., KIuwers Academic Publishers, 1998, Info:
www.wkap.nl/book.htm/O7923-8377-
XKoP, TM/\N, J.G.M.; LINDEIJF.R, E.W.; SAS, H.; SPREN(,F.RS, M. (1994): Towards a Single Indicator for Emissions. IDES (IVAM- er) Amsterdam
KOLLNER, T. (1998): Life-Cycle Impact Assessment for Land Use. Effect Assessment Taking the Attribute Biodiversity into Account. IWC) Discussion Paper, unpublished first draft, 29.8.98, Uni- versity St. Gallen
MEENT, D.; KLEPPER, O. (1997): Mapping the Potential Affected Fraction (PAF) of Species as an Indicator of Generic Toxic Stress. RIVM report 607504001, June 1997; RIVM. Bilthoven MOLLER-WENK, R. (1996): Damage Categories and Damage Func-
tions as Core Elements of Life-Cycle Impact Assessment. IWOE Diskussionsbeitrag. 36 (Draft version 29.10.1996, Universit/it St. Gallen
MULLER-WENK, R. (1998-1): Depletion of Abiotic Resources Weighted on the Base of "Virtual" Impacts of Lower Grade De- posits in Future. IWO Diskussionsbeitrag Nr. 57, Universit/it St. Gallen, March 1998, ISBN 3-906502-57-0
MULLER-WENK, R. (1998-2): Land Use - The Main Threat to Species. IWOE Discussion Paper no. 64, IWOE University of St. Gallen MURP, AY, CHR.; LoI'F2., A. ( 1996): The Global Burden of Disease. WHO,
World Bank and Harvard School of Public Health. Boston PoTrIN(;, J.; HAUSCHtLD, M.;WENzrL, H. (1998): "Less is hctter"
and "Only above Threshold ": Two Incompatible Paradigms for Human Toxicity in Lifecycle Assessment? Int. J. LCA, in print for issue 6, 1998
SPRJENSMA, R. ( 1997): Working Document on Fate Analysis for the Eco-lndicator 97. In: EUSES, Internal Working Document, PR6 Consultants
STI!rN, B.; RYDINt;, S.O. ( 1992): The EPS Enviro-Accotmting Method. IVL, B-1080 Gothenburg
THOMPSON, M.; El.US, R.; WII.I)AVSKY, A.: Cultural Theory, Wcstview Print Boulder 1990
WJrRrz J, VAN DUg & J.B. LATOUR ( 1992); MOVE: Vegetatie-mod- ule; de kans op voorlomcn van 700 plantensnorten als functie van vocht, pH, nutrientcn en zout. RIVM rapport n r. 711901006. Bilthoven
A p p e n d i x : E x p e r t T e a m
Name Employer Contribution to this project
Ruedi MQIler Wenk IWO-HSG St. Gallen General methodology, Resources, Land-use Patrick Hofstetter UNS-ETH, Zurich General methodology, DALY, Cult. Theory Thomas K611ner IWO-HSG St. Gallen Land-use
Thomas Mettier UNS-ETH, Zurich Panel procedure Stephan Brunner Ex-ESU-ETH, Zurich Panel procedure
Arthur Braunschweig IWO-HSG St. Gallen ] General methodology, Radiation Dick van der Meent RIVM ECO PAF
Mathieu Rikken RIVM CSR EUSES Ton Breure RIVM ECO PAF
Reinout Heijungs CML Leiden General methodology Erwin Lindeijer IVAM Amsterdam General methodology Hein Sas CE Delft General methodology
Mark Goedkoop PRe Consultants Project leader, General methodology Renilde Spriensma PRe Consultants Fate analysis, DALY and PAF
We like to thank T. K611ner, T. Mettier and A Braunschweig for their critical review and useful comments on this article